

Motley Fool Stock Advisor is the better choice for most investors. At $99/year with a 30-day guarantee and a +978.9% return since 2002 (TraderHQ analysis of the published trade log, data as of Aug 31, 2026), it’s hard to argue with the math. But IBD Leaderboard wins for active traders who want real-time entry/exit alerts and can commit to daily monitoring.
Long-term GARP conviction vs short-term momentum trading — in a market where the VIX sits at 14.92 but single-stock dispersion spans 210 points, both approaches have merit.
The S&P 500 closed August at ~7,686 (+13.1% YTD on a total-return basis, within 0.7% of its high) — and the calm VIX (14.92, versus March’s 35.30 war-panic peak) actually flatters conditions for momentum traders. But 210-point dispersion between winners and losers (top 20 averaging +168.7%, bottom 20 at -41.6%) means the direction of selection still shifts fast. Within technology alone, SNDK surged +560% and WDC +162% while INTU dropped -45.8% and TTD -63.9% — a gap that creates false breakout signals and premature stop-outs for IBD’s momentum approach.
The rotation challenges momentum systems: Energy +38.4%, Materials +20.4% are LEADING. Technology +24.1% is strong but internally split — memory and storage soaring while enterprise software bleeds. The VIX at 14.92 is calm at the index level, but that calm hides the 210-point single-stock split that tests breakout traders. AAII bears sit at 44.4% — the highest since March’s war panic — yet credit spreads hold at 2.60% and manufacturing PMI at 55.6 signals strong expansion, sending mixed signals about economic direction.
The Fed holds at 3.50-3.75%, but CPI at 3.4% (core 2.5%) is sticky on war-driven energy, the 10-year yield touched a 19-month high of 4.76%, and the CAPE ratio hovers near ~40-42 — with September hike odds at ~60-65% after Jackson Hole. Stock Advisor rates EXCEPTIONAL — its 46 ten-baggers, 66% win rate, and 24.5-year recession-tested track record thrive when quality compounds through rotation. IBD Leaderboard rates SITUATIONAL — the hardware melt-up gives momentum traders real trends, but 210-point dispersion with hike-day volatility still challenges even disciplined traders. When SNDK surges +560% and INTU drops -45.8% in the same sector, CAN SLIM’s breakout signals remain unreliable.
This isn’t a “which is better” comparison — it’s a “which investor are you” comparison. Stock Advisor says buy great companies and hold for years. Leaderboard says catch breakouts, take profits, and repeat. Both work. Neither works for everyone.
If you’ve been going back and forth between these two, the decision comes down to one question: Do you want to check your portfolio monthly or daily?
Try Stock Advisor risk-free for 30 days
Quick Comparison: Motley Fool Stock Advisor vs IBD Leaderboard
| Dimension | Stock Advisor | IBD Leaderboard | Edge |
|---|---|---|---|
| Track Record | +978.9% since 2002 (published trade log) | “Market-beating” (unspecified) | Stock Advisor |
| Price | $99/year (promo) | $699/year or $69/month | Stock Advisor |
| Methodology | Buy-and-hold growth | CAN SLIM active trading | Tie (different) |
| Time Commitment | ~30 min/month | Daily monitoring | Stock Advisor |
| Entry/Exit Guidance | Buy on recommendation, hold 5+ years | Exact buy points and sell targets | Leaderboard |
| Refund Policy | 30-day money-back | No prorated refunds | Stock Advisor |
| Best For | Patient long-term investors | Active traders | Depends on you |
| Overall Winner | — | — | Stock Advisor (for most) |
Motley Fool Stock Advisor: The 24.5-Year Compounding Machine
Stock Advisor is The Motley Fool’s flagship service—the one that built their reputation. The philosophy is deceptively simple: find companies with durable competitive advantages, buy them, and hold while the market catches up.
The Numbers Speak:
Since February 2002, Stock Advisor picks have returned +978.9% compared to the S&P 500’s +214% per-position benchmark. That’s not marketing—it’s a published trade log with every pick timestamped and tracked (TraderHQ analysis, data as of Aug 31, 2026).
Put differently: $10,000 invested following their recommendations would be worth roughly $107,900 today. The same amount in the S&P 500, measured over the same per-position holding periods, would be around $31,400.
The win rate tells the story of patience: 66% overall, improving to 92.2% for positions held 10+ years. They’ve generated 46 ten-baggers and 191 doublers across 526 positions—the kind of asymmetric returns that make long-term holding worthwhile.
But those numbers hide volatility. Stock Advisor’s aggressive picks have seen 40-50% drawdowns. Their biggest winners—Netflix, Amazon, Nvidia—have all experienced gut-wrenching drops before their runs. The strategy works if you can hold through the pain.
What You Actually Get:
- 2 new stock picks per month with full thesis explaining the “why”
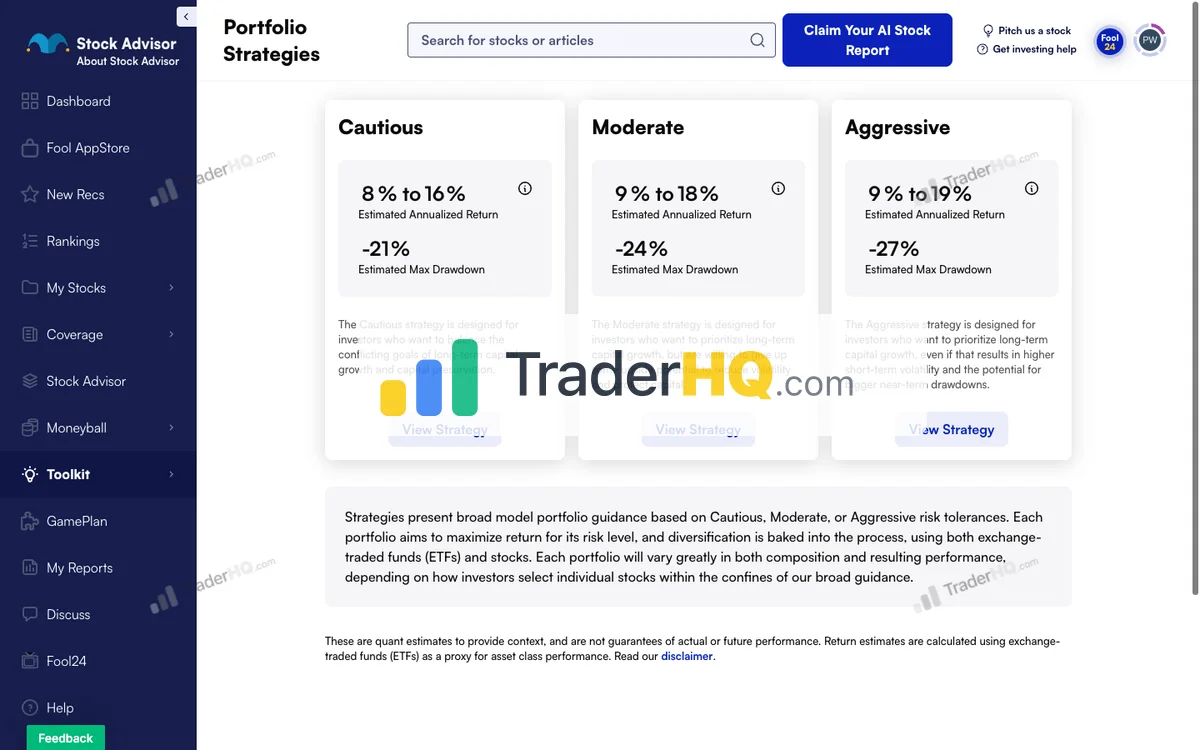
- Three portfolio strategies (Cautious, Moderate, Aggressive) calibrated to different risk tolerances
- Foundational Stocks list — 10 highest-conviction core holdings
- Moneyball database — 344 companies with 12+ scoring dimensions
Why It Works:
Stock Advisor isn’t selling stock tips—it’s selling a framework for building wealth. The portfolio strategies address the psychological reality that even the best picks are worthless if you can’t hold them through volatility.
Best For: Investors with 5+ year horizons, $25K+ portfolios, and the stomach for 30-50% drawdowns. If you need hand-holding during crashes, this will frustrate you.
Price: $99/year for new members (normally $199). 30-day money-back guarantee.
For the complete analysis, read our Stock Advisor review.
Try Stock Advisor — 30-Day Guarantee
IBD Leaderboard: Real-Time Alerts for Active Traders
IBD Leaderboard is built on William O’Neil’s legendary IBD Methodology (formerly CAN SLIM)—a system developed from decades of studying what makes winning stocks. Unlike buy-and-hold services, Leaderboard gives you exact entry and exit points designed to capture breakout opportunities.
The Methodology:
CAN SLIM identifies stocks with strong earnings growth, institutional sponsorship, and technical breakout patterns. When a stock hits a buy point, you get an alert. When it hits a sell target—or triggers a stop-loss—you get another alert. No guessing.
What You Actually Get:
- 10-15 curated stocks on the Leaders List at any time
- Full trading plans with exact buy points overlaid on charts
- Real-time alerts via email, desktop, and mobile
- Model portfolio showing how picks are positioned
- Free product coaching — one-on-one sessions with Leaderboard experts
Why It Works:
Leaderboard removes the guesswork from active trading. You’re not staring at charts trying to decide if this is the right entry. The system tells you when to buy, when to add, and when to sell.
Best For: Active traders who can monitor positions daily, want structured trading plans, and are comfortable with higher turnover. If you want to set and forget, this isn’t for you.
Price: $39 for 4-week trial, then $69/month or $699/year. No prorated refunds.
For the full breakdown, see our IBD Leaderboard review.
The Real Differences: What Actually Matters
Philosophy: Hold Forever vs. Take Profits
This is the fundamental divide.
Stock Advisor says: Buy great companies and hold for 5+ years. Let the winners run. Ignore the noise. The strategy relies on a few massive winners (think Netflix at 10,000%+) to offset the inevitable losers.
Leaderboard says: Catch the breakout, ride the momentum, take profits at targets. The strategy relies on many smaller wins with strict loss limits to protect capital.
Neither is wrong. They’re designed for different investor psychologies.
Time Commitment: Monthly vs. Daily
Stock Advisor requires about 30 minutes per month. Read the new picks, decide if you want to buy, and then… do nothing. The entire philosophy is built on not watching your portfolio obsessively.
Leaderboard requires daily attention. Real-time alerts mean real-time decisions. When a stock hits a buy point, you need to act. When it hits a stop-loss, you need to sell. If you can’t check your phone during market hours, you’ll miss opportunities.
Track Record Transparency
This is where Stock Advisor has a significant edge.
Every Stock Advisor pick since February 2002 is publicly tracked with timestamped entry prices. You can verify the +978.9% claim yourself. The scorecard shows winners and losers—the 66% win rate is transparent, as are the 46 ten-baggers and 191 doublers across 526 positions that drove the returns (TraderHQ analysis of the published trade log, data as of Aug 31, 2026).
Leaderboard claims “market-beating results” but doesn’t publish a comprehensive performance history the same way. The methodology has decades of research behind it, but the specific service performance is less transparent.
Price and Risk
Stock Advisor costs $99/year (promo) with a 30-day money-back guarantee. If it’s not for you, you get your money back.
Leaderboard costs $699/year or $69/month with no prorated refunds. The 4-week trial at $39 is the only risk-free way to test it—and it auto-converts to $69/month if you don’t cancel 7 days before the trial ends.
At 7x the price with no refund policy, Leaderboard needs to deliver significantly more value to justify the cost. For active traders who will use it daily, it might. For most investors, it won’t.
How to Decide: Stock Advisor vs IBD Leaderboard
Choose Stock Advisor if:
- You’re investing for 5+ years and won’t touch the money
- You want the 92.2% win rate that comes with 10+ year patience
- You have $25K+ to allocate (the fee becomes trivial relative to returns)
- You want a proven 24.5-year track record with 46 ten-baggers
- You’d rather spend 30 minutes per month than 30 minutes per day
- You want a money-back guarantee to test the service
- You’ve seen momentum reversals like APP (a +1,571% winner now down 53.7% in 2026 alone) and prefer to avoid whipsaw risk
Choose IBD Leaderboard if:
- You enjoy active trading and want specific entry/exit points
- You can monitor positions during market hours
- You prefer the CAN SLIM methodology over buy-and-hold
- You’re comfortable with higher turnover and more frequent decisions
- You’re willing to pay 7x more for real-time alerts
Either Works if:
- You’ll actually follow the recommendations (the biggest variable is you, not the service)
- You understand that 35%+ of picks from any service will lose money
- You’re adding this as one input to your process, not your entire strategy
The Tiebreaker:
Ask yourself: “Would I hold through a 40% drop?” If yes, Stock Advisor. If that makes you want to sell and try again later, Leaderboard’s structured exits might suit you better.
Try Stock Advisor — 30-Day Guarantee
The Bottom Line
Stock Advisor wins for most investors. The 24.5-year track record (+978.9%, TraderHQ analysis of the published trade log, data as of Aug 31, 2026), the 66% win rate improving to 92.2% for 10+ year holds, 46 ten-baggers, the $99/year price point, the 30-day guarantee, and the minimal time commitment make it the obvious choice for anyone who wants to build wealth without becoming a full-time trader.
IBD Leaderboard earns a SITUATIONAL fit rating for genuine active traders — those who enjoy the process of catching breakouts, managing positions, and taking profits. The CAN SLIM methodology has produced legendary returns for those who master it. The calm VIX (14.92) and the hardware melt-up give momentum traders real trends to work with — but challenges remain. 210-point dispersion between winners and losers means the intra-sector bifurcation (SNDK +560%, WDC +162% vs INTU -45.8%, TTD -63.9%) still creates false breakout signals that trigger stop-losses before moves develop. The rotation continues: Energy +38.4% and Materials +20.4% lead while the software/ad-tech complex bleeds, and September hike odds at ~60-65% add regime risk — the April 2025 and March 2026 V-bottoms both punished stop-loss sellers on the way down. AAII bears at 44.4% and credit spreads at 2.60% send contradictory signals about economic direction, even as manufacturing PMI at 55.6 shows expansion. If you choose Leaderboard, the calm tape helps, but consider tighter position sizing until the hike decision resolves and dispersion narrows.
The real question isn’t which service is “better.” It’s which one you’ll actually use. A mediocre service you follow beats a great service you ignore.
If I had to recommend one for a friend who’s never subscribed to either? Stock Advisor, because the training wheels of a 24.5-year track record with 46 ten-baggers make it easier to trust the process when it hurts.
Not sure between these two? Explore all your options in our guide to the best stock advisors.

Motley Fool Stock Advisor Performance
The Motley Fool · 526 picks · 25 years · Updated Aug 31, 2026
| SA Return | S&P 500 | Alpha | Win Rate |
|---|---|---|---|
| +979% | +214% | +765% | 66% |
S&P 500 shows what you'd have earned buying the index on each pick date instead. Same timing, fair comparison.
| SA Multi-Baggers | 10x+ | 5x+ | 3x+ | 2x+ |
|---|---|---|---|---|
| Count | 46 | 91 | 128 | 191 |
| SA Asymmetry | Avg Winner | Avg Loser | Ratio |
|---|---|---|---|
| Return | +1.7K% | -44% | ~38:1 |
Best Performers (All-Time)
| SA Pick | Return |
|---|---|
 AAPL Apple | +6.5K% |
 MME.DL MME.DL | +4.3K% |
 CTAS CTAS | +4.6K% |
 NVDA NVIDIA | +133K% |
 DIS Disney | +6.1K% |
 SHOP Shopify | +4.6K% |
 NFLX Netflix | +44K% |
 BKNG Booking Holdings | +22K% |
 AMZN Amazon | +35K% |
 TSLA Tesla | +16K% |
46 ten-baggers. These 1,000%+ winners—NVDA, NFLX, AMZN—are what drive the portfolio. You don't need to pick all winners; you need a few massive ones.
See All Stock Advisor Recommendations →Latest Stock Advisor Picks
Tickers masked to protect subscriber value. Recent picks need 3-5+ years to demonstrate thesis.
| SA Pick | Return |
|---|---|
**** Cloud Monitoring | +97% |
**** Chip Manufacturer | +85% |
**** Infrastructure Construction | +63% |
**** Growth Company | +51% |
**** Growth Company | +41% |
**** E-commerce & Cloud Giant | +28% |
**** Growth Company | +23% |
**** Convenience Stores | +19% |
**** Growth Company | +18% |
**** Growth Company | +16% |
Early results mislead. < 1 year: 57.1% win rate. 10+ years: 92.2%. That 35-point gap explains why judging picks early leads to selling future winners.
Stock Advisor Win Rate by Holding Period
| Hold Time | SA Win Rate | Avg Return |
|---|---|---|
| < 1 Year | 57.1% | +16% |
| 1-3 Years | 55.7% | +11% |
| 3-5 Years | 48.8% | +23% |
| 5-10 Years | 62.9% | +206% |
| 10+ Years | 92.2% | +4.1K% |
Time is the strategy. 10+ year picks show 92.2% win rate with +4.1K% average returns. Same methodology, same picks—time transforms the results.
Stock Advisor Performance by Year
| Year | SA Picks | Avg Return | Win Rate | |
|---|---|---|---|---|
| 2026 | 31 | +10% | 57% | DDOG+97% |
| 2025 | 26 | +7% | 48% | ASML+133% |
| 2024 | 25 | +25% | 67% | AMD+186% |
| 2023 | 25 | +78% | 73% | CRWD+607% |
| 2022 | 23 | +58% | 59% | NET+495% |
| 2021 | 22 | -13% | 32% | LRCX+491% |
| 2020 | 24 | +146% | 46% | TSLA+1.1K% |
| 2019 | 23 | +56% | 70% | SNPS+259% |
| 2018 | 19 | +228% | 68% | SHOP+1.1K% |
| 2017 | 22 | +700% | 86% | NVDA+8.4K% |
| 2016 | 20 | +446% | 80% | SHOP+4.6K% |
| 2015 | 22 | +208% | 68% | CASY+839% |
| 2014 | 20 | +354% | 80% | ATVI+2.8K% |
| 2013 | 17 | +386% | 65% | NFLX+2.5K% |
| 2012 | 23 | +1.2K% | 74% | TSLA+16K% |
| 2011 | 19 | +561% | 63% | AAPL+3.2K% |
| 2010 | 18 | +459% | 83% | AMZN+2.9K% |
| 2009 | 20 | +3.3K% | 90% | NVDA+56K% |
| 2008 | 18 | +1.2K% | 89% | AAPL+6.5K% |
| 2007 | 19 | +1.5K% | 37% | NFLX+29K% |
| 2006 | 20 | +2.5K% | 65% | NFLX+25K% |
| 2005 | 16 | +8.4K% | 63% | NVDA+133K% |
| 2004 | 17 | +6.0K% | 59% | NFLX+44K% |
| 2003 | 17 | +229% | 65% | PHIN+1.4K% |
| 2002 | 16 | +3.2K% | 81% | AMZN+35K% |
Inside Stock Advisor
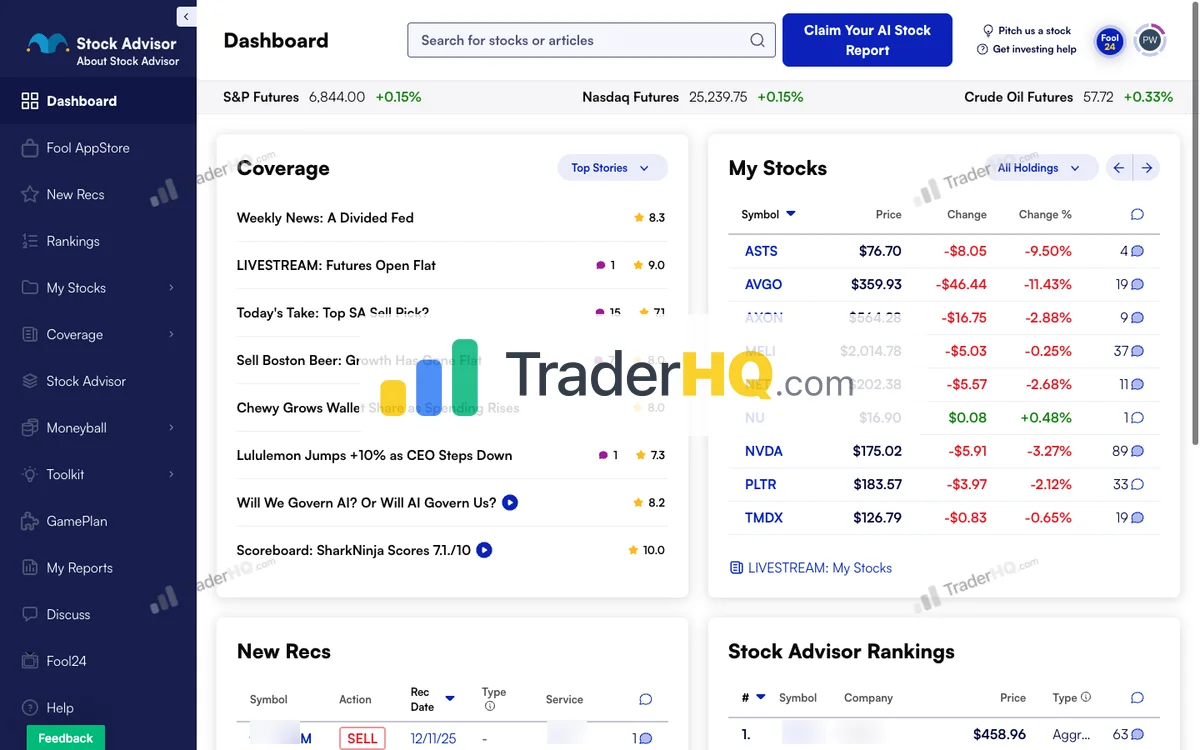
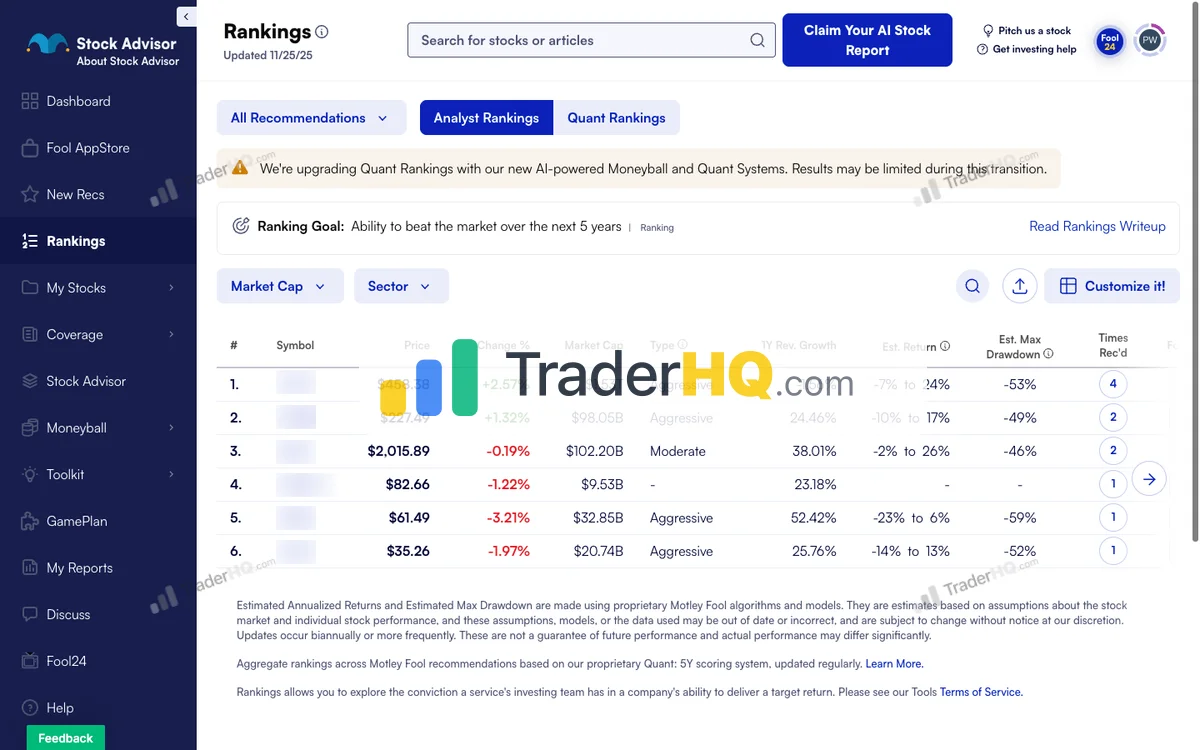
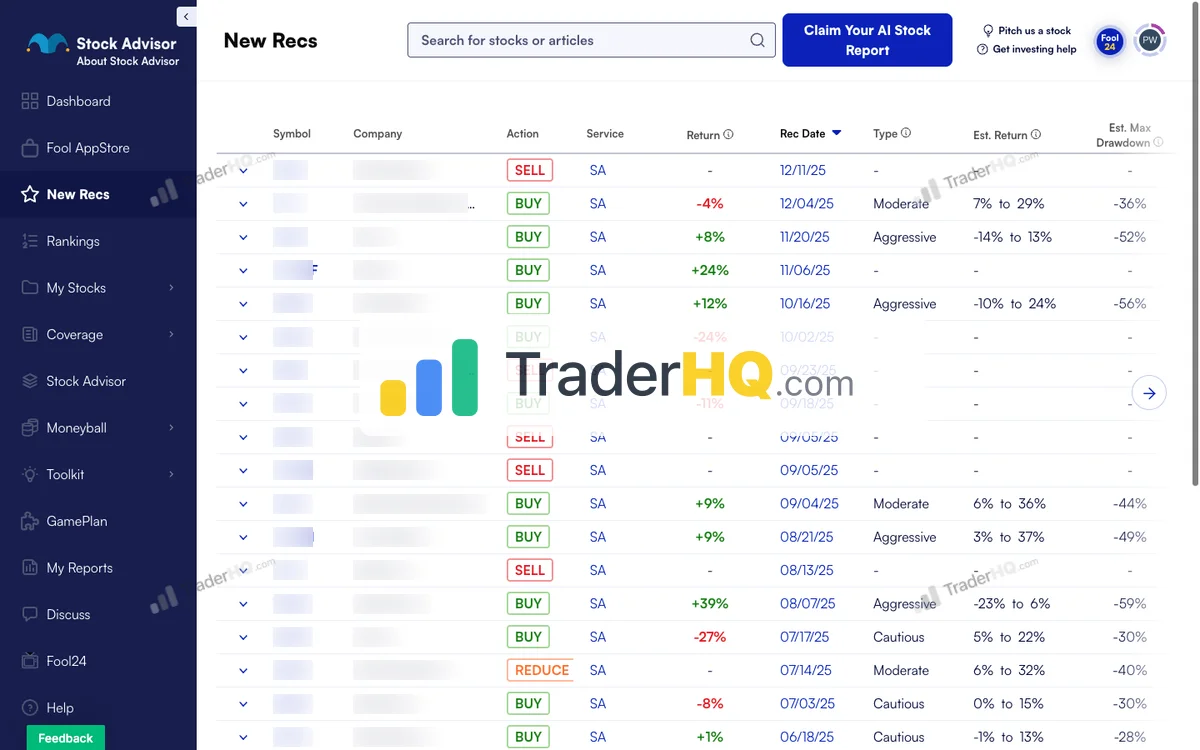
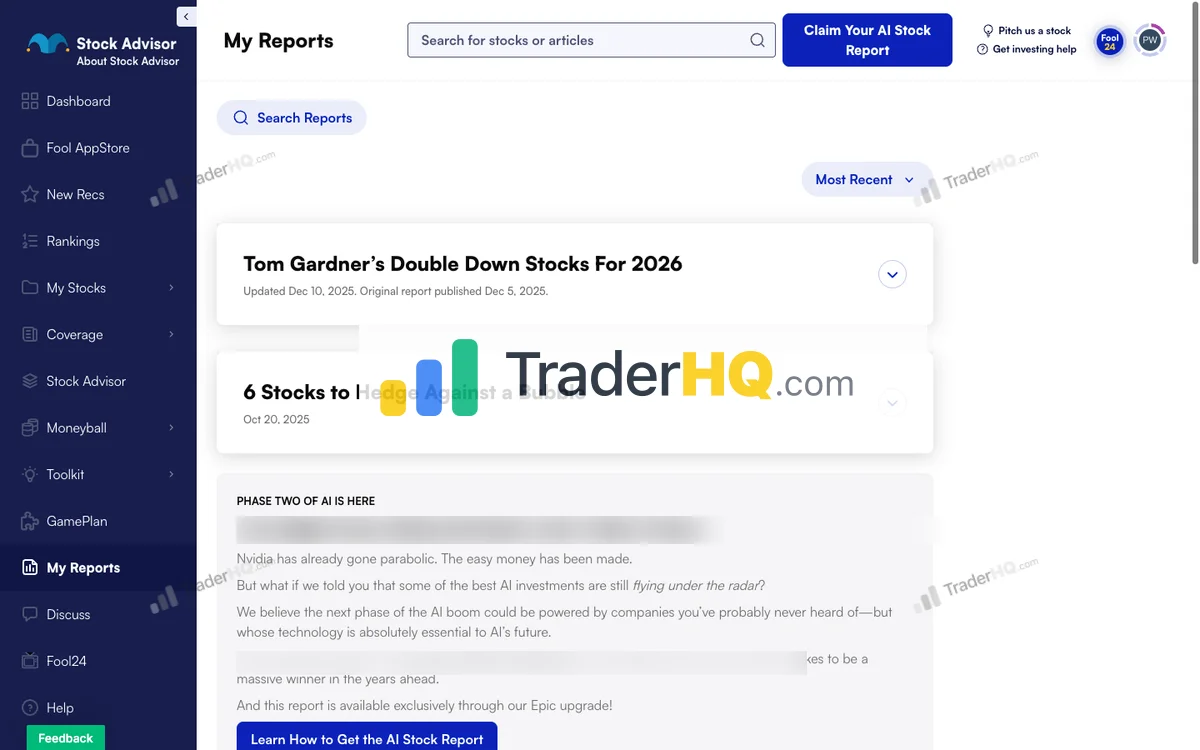
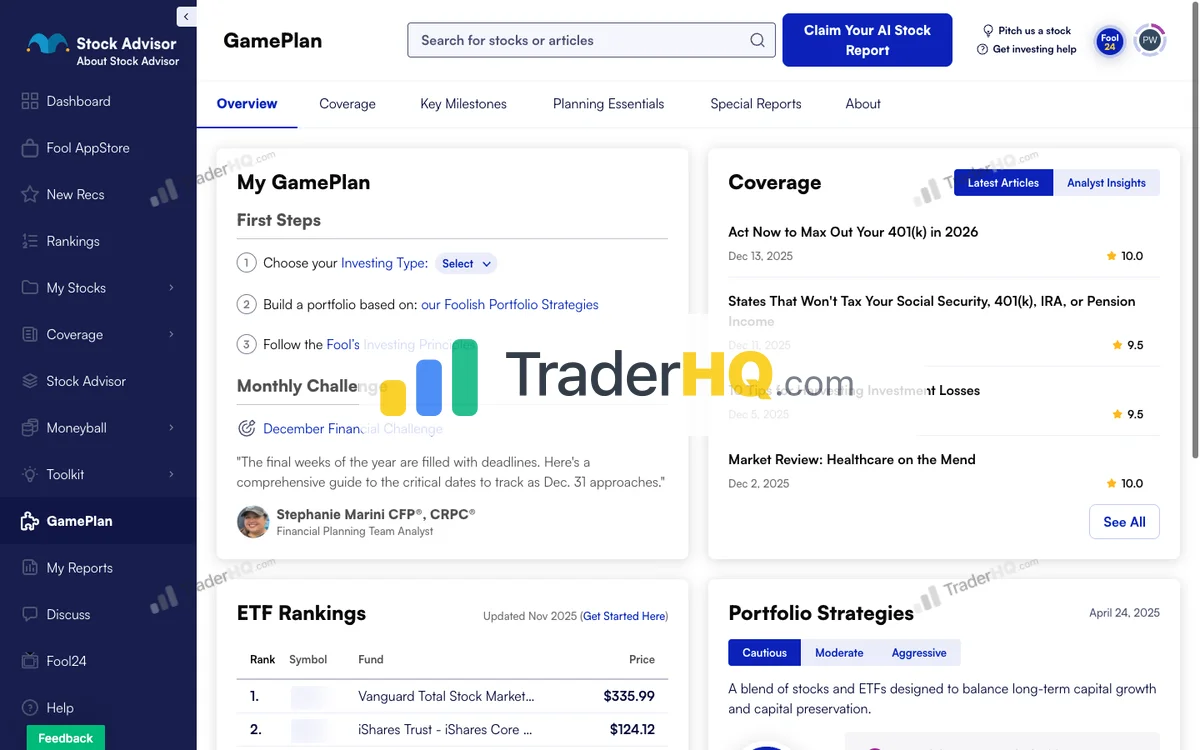
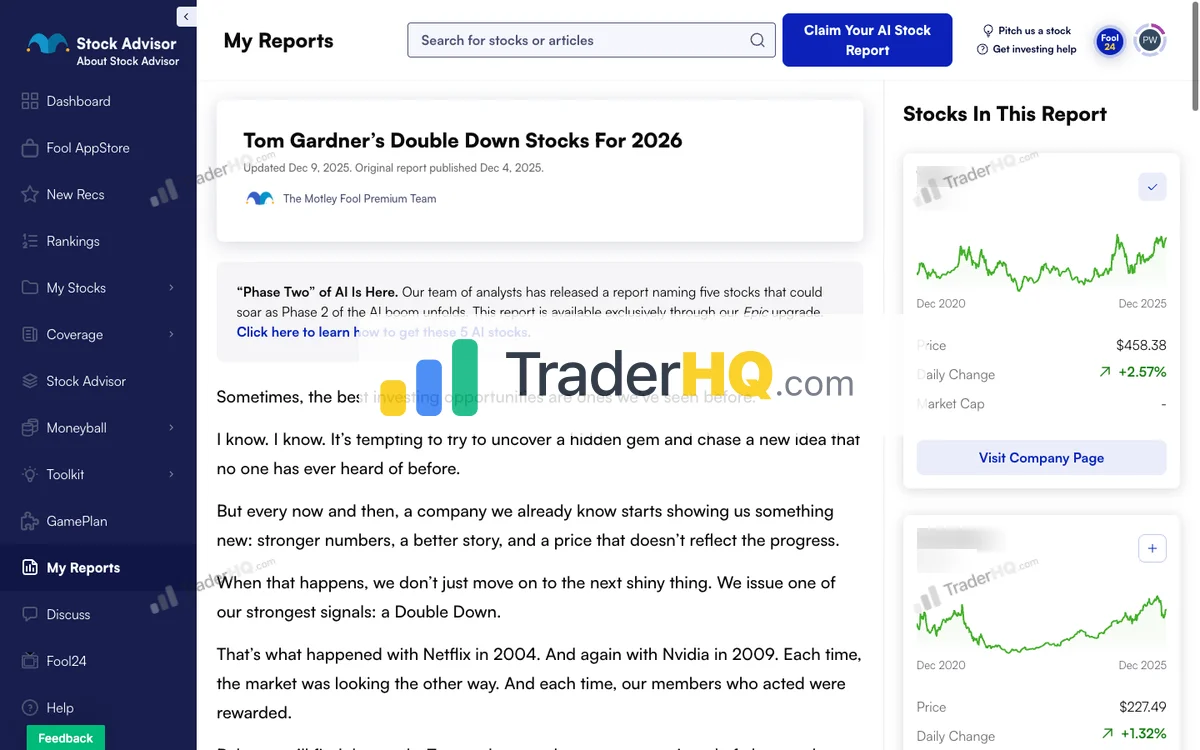
9 screenshots · Click to expand
Frequently Asked Questions
Stock Advisor vs IBD Leaderboard: which is better?
Stock Advisor is better for most investors. It costs $99/year (vs $699 for Leaderboard), has a +978.9% track record since 2002 (66% win rate, 92.2% for 10+ year holds, 46 ten-baggers, 191 doublers across 526 positions — TraderHQ analysis of the published trade log, data as of Aug 31, 2026), offers a 30-day money-back guarantee, and requires only 30 minutes per month. Stock Advisor earns an EXCEPTIONAL fit rating for September 2026’s 210-point dispersion environment. The VIX sits at 14.92 — calm at the index level — but 210 points of single-stock dispersion and a ~60-65% September hike probability mean through-cycle conviction still matters more than momentum chasing. IBD Leaderboard rates SITUATIONAL — the hardware melt-up gives momentum real trends, but violent rotation (Energy +38.4% leading, the software/ad-tech complex bleeding) and hike-day volatility still create whipsaw conditions. Leaderboard is better specifically for active traders who can commit to daily monitoring and navigate volatile rotation skillfully.
Is Motley Fool Stock Advisor worth it?
Yes, for long-term investors who can hold 5+ years. Stock Advisor has returned +978.9% since 2002 compared to the S&P 500’s +214% per-position benchmark (TraderHQ analysis of the published trade log, data as of Aug 31, 2026). The 66% overall win rate improves to 92.2% for 10+ year holds, with 46 ten-baggers and 191 doublers generated across 526 positions. At $99/year with a 30-day money-back guarantee, the math works if you follow the strategy—but expect 30-50% drawdowns on individual positions.
Is IBD Leaderboard worth it?
Yes, for active traders who will use it daily. Leaderboard provides real-time alerts with exact buy and sell points based on the proven CAN SLIM methodology. At $699/year with no refunds, it’s a significant commitment—but for traders who want structured trading plans without doing their own technical analysis, it can be valuable.
Can I use both Stock Advisor and IBD Leaderboard?
You can, but the philosophies conflict. Stock Advisor says hold great companies for 5+ years through any volatility. Leaderboard says take profits at targets and cut losses quickly. Using both means you’d be holding some positions forever while actively trading others—which can work, but requires mental clarity about which strategy applies to which positions.
What’s the difference between CAN SLIM and buy-and-hold?
CAN SLIM is an active trading system; buy-and-hold is passive wealth building. CAN SLIM (the methodology behind IBD Leaderboard) identifies breakout opportunities with specific entry and exit points, typically holding positions for weeks to months. Buy-and-hold (Stock Advisor’s approach) focuses on owning great businesses for years, ignoring short-term price movements.
Which service has better returns?
Stock Advisor has the more transparent track record. Their +978.9% return since 2002 is publicly verifiable with every pick timestamped (TraderHQ analysis of the published trade log, data as of Aug 31, 2026)—including 46 ten-baggers and 191 doublers across 526 positions. IBD Leaderboard claims “market-beating results” but doesn’t publish a comparable comprehensive performance history. The CAN SLIM methodology has decades of research behind it, but specific Leaderboard service returns are harder to verify independently.
Which is better in 2026’s market: Stock Advisor or IBD Leaderboard?
Stock Advisor retains the edge, though momentum conditions are real. The VIX sits at 14.92, which looks calm at the index level — but 210-point dispersion means intra-sector reversals still punish breakout strategies. Energy +38.4% and Materials +20.4% lead while the software/ad-tech complex bleeds (INTU -45.8%, TTD -63.9%), and AAII bears at 44.4% add uncertainty even as manufacturing PMI at 55.6 signals expansion. Stock Advisor’s 978.9% total return and 46 ten-baggers through 2008, 2020, and 2022 prove through-cycle conviction works in exactly this kind of rotating, high-dispersion environment. Leaderboard’s CAN SLIM methodology benefits from strong hardware trends, but a ~60-65% September hike probability means hike-driven corrections remain a live risk to stop-loss strategies.
Can I use both Stock Advisor and IBD Leaderboard together?
You can, but you need strict mental separation. Stock Advisor picks are core long-term holdings you buy and hold for 5+ years through any volatility (978.9% total return, 46 ten-baggers prove this works). Leaderboard picks are tactical trades with defined entry and exit points, typically held weeks to months. The key is never confusing the two: don’t sell a Stock Advisor pick because it hits a Leaderboard stop-loss, and don’t hold a Leaderboard trade past its sell target because you “believe in the company.” In September 2026’s rotating market — with the VIX calm at 14.92 and 210-point dispersion between winners and losers — some investors successfully run a core-satellite approach: Stock Advisor for 70-80% of the portfolio (through-cycle conviction), Leaderboard for 20-30% of active trading capital (capturing momentum in energy and materials leadership).
Ready to Decide?
Both services work—the question is which one matches your investing style. For a deeper dive into Stock Advisor’s methodology and track record, see our full Stock Advisor analysis. For a complete look at IBD’s approach, check our IBD Leaderboard deep dive.
Want to compare Stock Advisor with other options? Explore our best stock advisor services guide. You can also see how Stock Advisor compares to Alpha Picks, Seeking Alpha Premium, or Morningstar Investor.