

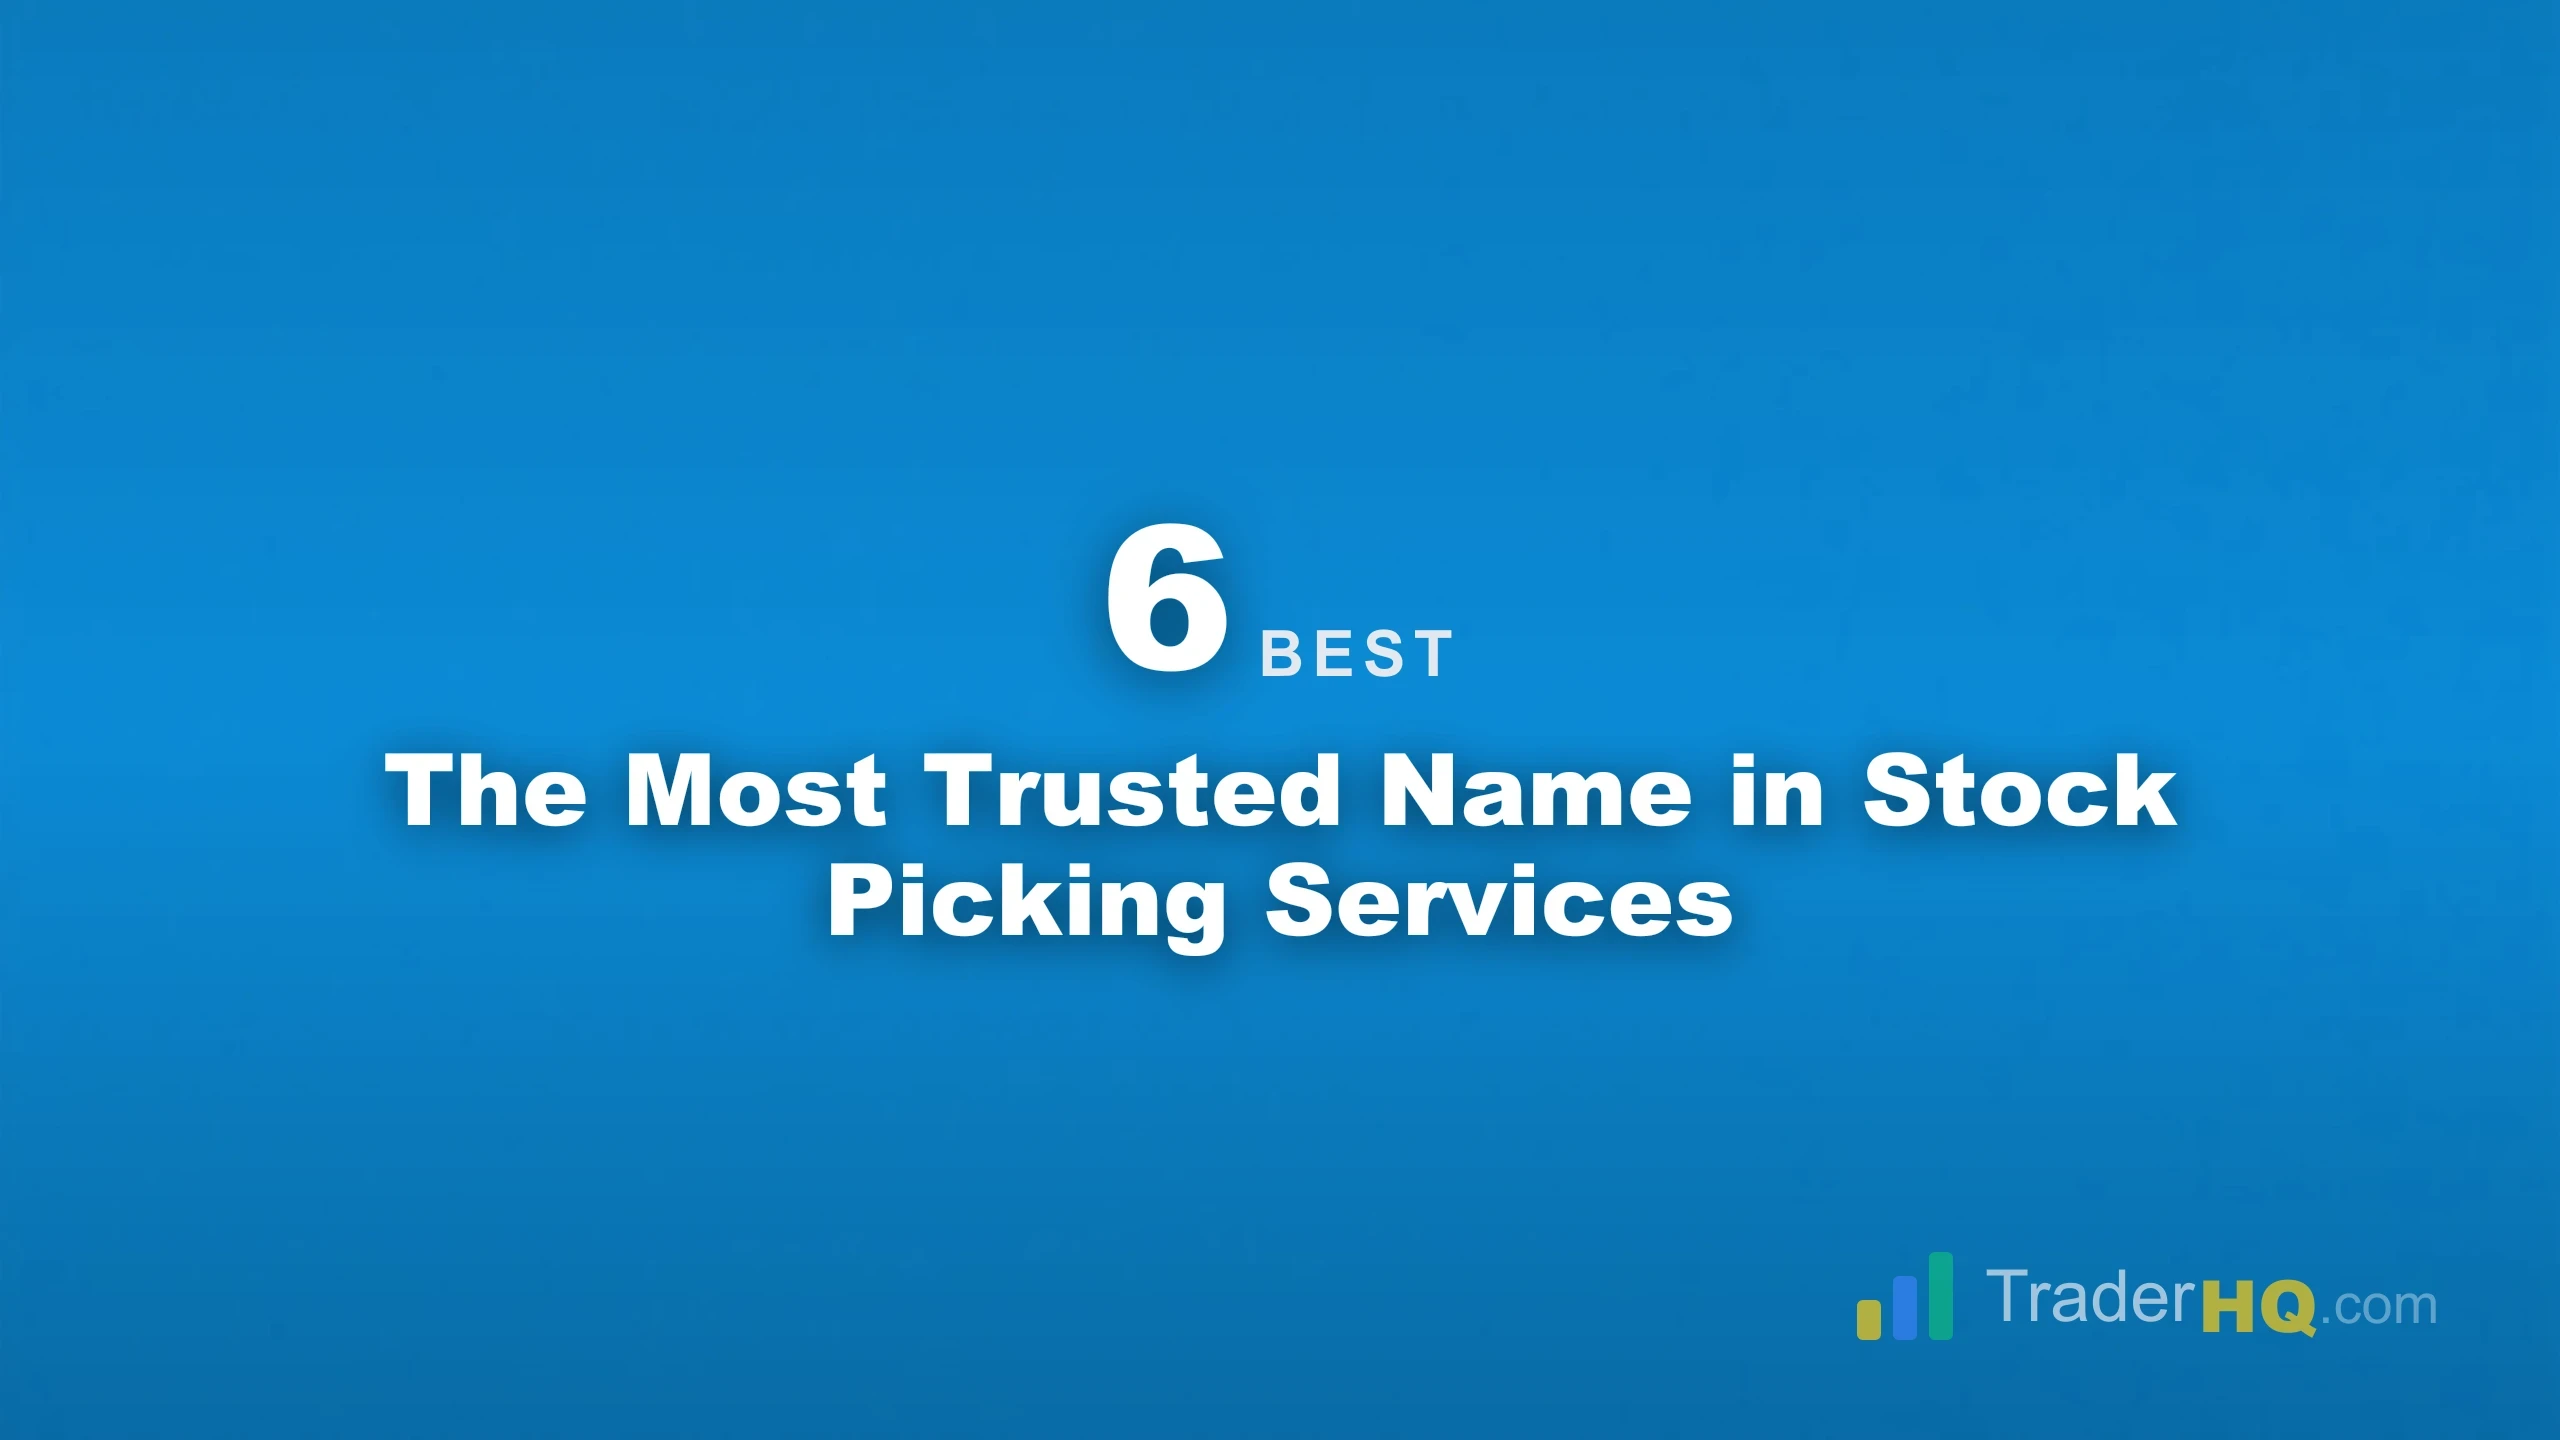
You’ve seen the ads. The podcast sponsorships. The YouTube pre-rolls promising market-crushing returns. And now you’re here, wondering if The Motley Fool is actually legit—or just brilliant marketing.
Here’s the short answer: The Motley Fool is a legitimate investment research company with 30+ years of history and track records that have beaten the market. Our analysis of their flagship Stock Advisor service shows a +978.9% total return since 2002 (TraderHQ analysis of the published trade log, data as of Aug 31, 2026), compared to the S&P 500’s +214%—with 46 ten-baggers, 191 doublers, and a 92.2% win rate for positions held 10+ years. That’s real, and it’s independently verifiable.
Why this matters right now (September 2026): The S&P 500 closed August at 7,686, up +13.1% YTD on a total-return basis and less than 1% from its all-time high (Slickcharts, Aug 31, 2026). But the index-level calm (VIX 14.92) hides the real story: a 210-point spread between the average top-20 S&P name (+168.7%) and the average bottom-20 (−41.6%). Meanwhile, Fed Chair Warsh used Jackson Hole to push September hike odds to ~60–65%, CPI runs at 3.4% YoY, and the Fed is holding at 3.50–3.75%. This is a stock-picker’s market, not a passive investor’s market.
The old economy vs. new economy divide:
| Sector | YTD Performance |
|---|---|
| Energy | +38.4% (leading — war premium + refining margins) |
| Technology | +24.1% (bifurcated — memory surging, software collapsing) |
| Basic Materials | +20.4% |
| Financials | +7.8% (lagging the index) |
| Consumer Cyclical | -3.5% (weakest sector) |
Memory and storage stocks are up +162% to +560% (SNDK +560%, MU +236%, STX +201%, WDC +162%) while ad-tech and software collapse (TTD -63.9%, APP -53.7%, INTU -45.8%). That split—15 stocks up +100% YTD against 3 down 50%+—is the starkest proof that stock selection matters more than sector allocation. Manufacturing is expanding (ISM 55.6, highest since May 2022), credit spreads at 2.60% signal no systemic stress, and AAII bearishness sits at 44.4% even as the index grinds higher. The market is not broken—it is deeply bifurcated.
This bifurcation reveals why different Motley Fool services exist—and why both Stock Advisor and Rule Breakers fit the moment:
- Stock Advisor captures the quality rotation—its GARP methodology owns the hardware winners while treating software names down 25–50% as thesis calls, not stop-loss candidates. The service’s +978.9% total return, 46 ten-baggers, 191 doublers, and 526 positions (TraderHQ analysis of the published trade log, data as of Aug 31, 2026) prove this quality-first approach works across every cycle—including the hike-fear-and-recovery pattern playing out right now.
- Rule Breakers positions for the innovation cycle that’s already underway. With 37 ten-baggers over 21.9 years and a 74% win rate (official-computed, data as of Aug 19, 2026), the memory/HBM sold-out cycle and Moderna’s mRNA oncology breakthrough prove innovation returns are alive and accelerating.
- Hidden Gems rides the small-cap wave and benefits from the manufacturing expansion (ISM 55.6) that favors smaller domestic companies.
With a 210-point dispersion between top performers (+168.7%) and bottom performers (-41.6%), CAPE near 40–42 (highest since 2000), the Fed holding at 3.50–3.75% with a September hike ~65% priced, and CPI at 3.4%, each Motley Fool service captures a different piece of this bifurcated opportunity. The full ecosystem—from Stock Advisor at $99 to Epic’s multi-strategy bundle—serves investors across this entire market, where bearish sentiment at 44.4% coexists with credit spreads at 2.60% showing no systemic stress.
But here’s what the ads don’t emphasize: The Motley Fool runs six different service tiers ranging from $99 to $13,999 per year. The upselling is relentless. And those headline returns required holding through multiple 40-50% drawdowns—which most subscribers didn’t do.
This review will help you answer two questions: Should you trust The Motley Fool at all? And if so, which of their services actually fits your situation?
The Motley Fool at a Glance
| Dimension | Details |
|---|---|
| Founded | 1993 by Tom and David Gardner |
| Headquarters | Alexandria, Virginia |
| Track Record | 30+ years, verified performance since 2002 |
| Price Range | $99 – $13,999/year |
| Flagship Return | +978.9% (Stock Advisor) vs +214% S&P 500 |
| Refund Policy | 30-day full refund (entry tiers); credit swap only (premium tiers) |
| Best For | Long-term investors with 5+ year horizons |
Who Are the Gardner Brothers?
Tom and David Gardner founded The Motley Fool in 1993 from a backyard shed in Alexandria, Virginia. The name comes from Shakespeare—the court jester who could speak truth to power when others couldn’t.
Their core philosophy hasn’t changed in three decades:
- Buy 25+ companies over time — Diversification isn’t optional
- Hold for 5+ years minimum — Anything shorter is “gambling with investment money”
- Let winners run — Don’t trim positions just because they’ve appreciated
- Expect volatility — 10% drops annually, 20% every four years, 30% every decade
Important note about David Gardner: He stepped back from active stock picking in May 2021. He now focuses on education through his Rule Breaker Investing podcast, but he does NOT make stock recommendations for any current service—including Rule Breakers, which now carries his philosophy but is managed by analyst teams.
Tom Gardner remains actively involved, personally leading picks for Hidden Gems, the Moneyball Portfolio, and his real-money Everlasting Portfolio.
The Complete Motley Fool Service Lineup
Here’s what you’re actually choosing between:
| Service | Price | Monthly Picks | Target Portfolio | Best For |
|---|---|---|---|---|
| Stock Advisor | $99/yr (promo) | 2 | $25K+ | Entry point for most investors |
| Epic | $299/yr (promo) | 5 | $50K+ | Diversified strategy exposure |
| Epic Plus | $1,999/yr | 8+ | $100K+ | Daily ideas + AI insights |
| Fool Portfolios | $3,999/yr | 10+ | $250K+ | Tom’s real-money portfolios |
| Fool One | $13,999/yr | 30+ | $500K+ | Complete all-access |
Note on Rule Breakers: Rule Breakers is no longer sold standalone. It’s bundled into Epic membership alongside Stock Advisor, Hidden Gems, and Dividend Investor.

Motley Fool Rule Breakers Performance
The Motley Fool · 217 picks · 22 years · Updated 2026-08-19
| RB Return | S&P 500 | Alpha | Win Rate |
|---|---|---|---|
| +312% | +186% | +126% | 74% |
S&P 500 shows what you'd have earned buying the index on each pick date instead. Same timing, fair comparison.
| RB Multi-Baggers | 10x+ | 5x+ | 3x+ | 2x+ |
|---|---|---|---|---|
| Count | 37 | 65 | 90 | 105 |
| RB Asymmetry | Avg Winner | Avg Loser | Ratio |
|---|---|---|---|
| Return | +918% | -36% | ~25:1 |
Best Performers (All-Time)
| RB Pick | Return |
|---|---|
 ANET Arista Networks | +4.3K% |
 MNST MNST | +3.2K% |
 AVGO Broadcom | +3.2K% |
 ISRG Intuitive Surgical | +7.9K% |
 GOOGL Alphabet (Google) | +3.1K% |
 PANW Palo Alto Networks | +3.2K% |
 TSLA Tesla | +16K% |
 MELI MercadoLibre | +13K% |
 VRTX Vertex Pharma | +4.8K% |
 SHOP Shopify | +7.0K% |
25:1 asymmetry. Winners average +918%, losers average -36%. One winner offsets 25 complete losses—this is why selling winners early is costly.
See All Rule Breakers Recommendations →Latest Rule Breakers Picks
Tickers masked to protect subscriber value. Recent picks need 3-5+ years to demonstrate thesis.
| RB Pick | Return |
|---|---|
**** Life Sciences Software | +42% |
**** Growth Company | +21% |
**** Growth Company | +17% |
**** Growth Company | +14% |
**** Growth Company | +6% |
**** Social Platform | -11% |
**** Growth Company | -12% |
**** RNA Therapeutics | -18% |
**** Growth Company | -34% |
**** Growth Company | -34% |
Early results mislead. < 1 year: 41.7% win rate. 10+ years: 98.6%. That 57-point gap explains why judging picks early leads to selling future winners.
Rule Breakers Win Rate by Holding Period
| Hold Time | RB Win Rate | Avg Return |
|---|---|---|
| < 1 Year | 41.7% | -7% |
| 1-3 Years | 61.3% | +47% |
| 3-5 Years | 55.3% | +60% |
| 5-10 Years | 69.8% | +212% |
| 10+ Years | 98.6% | +1.8K% |
The 5-10 year sweet spot. 69.8% win rate, +212% average returns. Long enough for thesis to play out, recent enough to reflect current dynamics.
Rule Breakers Performance by Year
| Year | RB Picks | Avg Return | Win Rate | |
|---|---|---|---|---|
| 2026 | 9 | +2% | 63% | VEEV+42% |
| 2025 | 12 | +1% | 42% | BBIO+99% |
| 2024 | 16 | +63% | 69% | GH+430% |
| 2023 | 19 | +69% | 58% | CRWD+647% |
| 2022 | 19 | +75% | 63% | ANET+678% |
| 2021 | 16 | +39% | 44% | CRWD+210% |
| 2020 | 13 | -16% | 31% | ISRG+100% |
| 2019 | 14 | +118% | 64% | DDOG+661% |
| 2018 | 13 | +403% | 92% | AXON+1.3K% |
| 2017 | 9 | +387% | 89% | TWLO+687% |
| 2016 | 14 | +1.4K% | 100% | SHOP+7.0K% |
| 2015 | 5 | +652% | 80% | AXON+2.5K% |
| 2014 | 11 | +1.1K% | 100% | ANET+4.3K% |
| 2013 | 8 | +456% | 100% | AX+912% |
| 2012 | 8 | +1.4K% | 100% | META+2.4K% |
| 2011 | 4 | +4.5K% | 100% | TSLA+16K% |
| 2010 | 2 | +323% | 100% | OLED+423% |
| 2009 | 7 | +3.4K% | 100% | MELI+13K% |
| 2008 | 4 | +1.6K% | 100% | ISRG+2.8K% |
| 2007 | 7 | +1.1K% | 100% | CMG+2.7K% |
| 2006 | 1 | +3.3K% | 100% | ISRG+3.3K% |
| 2005 | 6 | +3.4K% | 100% | ISRG+7.9K% |
Stock Advisor: The Flagship Service
If you’re new to The Motley Fool, Stock Advisor is where you start. It’s their most affordable service, has their longest track record, and delivers everything most investors actually need.

Motley Fool Stock Advisor Performance
The Motley Fool · 526 picks · 25 years · Updated Aug 31, 2026
| SA Return | S&P 500 | Alpha | Win Rate |
|---|---|---|---|
| +979% | +214% | +765% | 66% |
S&P 500 shows what you'd have earned buying the index on each pick date instead. Same timing, fair comparison.
| SA Multi-Baggers | 10x+ | 5x+ | 3x+ | 2x+ |
|---|---|---|---|---|
| Count | 46 | 91 | 128 | 191 |
| SA Asymmetry | Avg Winner | Avg Loser | Ratio |
|---|---|---|---|
| Return | +1.7K% | -44% | ~38:1 |
Best Performers (All-Time)
| SA Pick | Return |
|---|---|
 NVDA NVIDIA | +133K% |
 NFLX Netflix | +44K% |
 BKNG Booking Holdings | +22K% |
 MME.DL MME.DL | +4.3K% |
 CTAS CTAS | +4.6K% |
 AAPL Apple | +6.5K% |
 AMZN Amazon | +35K% |
SHOP Shopify | +4.6K% |
TSLA Tesla | +16K% |
 DIS Disney | +6.1K% |
46 ten-baggers. These 1,000%+ winners—NVDA, NFLX, AMZN—are what drive the portfolio. You don't need to pick all winners; you need a few massive ones.
See All Stock Advisor Recommendations →Latest Stock Advisor Picks
Tickers masked to protect subscriber value. Recent picks need 3-5+ years to demonstrate thesis.
| SA Pick | Return |
|---|---|
**** Cloud Monitoring | +97% |
**** Chip Manufacturer | +85% |
**** Infrastructure Construction | +63% |
**** Growth Company | +51% |
**** Growth Company | +41% |
**** E-commerce & Cloud Giant | +28% |
**** Growth Company | +23% |
**** Convenience Stores | +19% |
**** Growth Company | +18% |
**** Growth Company | +16% |
$10K → $108K. Following every recommendation since inception would yield a 10.8x return. Recent picks look small now, but compounding hasn't had time to work.
Stock Advisor Win Rate by Holding Period
| Hold Time | SA Win Rate | Avg Return |
|---|---|---|
| < 1 Year | 57.1% | +16% |
| 1-3 Years | 55.7% | +11% |
| 3-5 Years | 48.8% | +23% |
| 5-10 Years | 62.9% | +206% |
| 10+ Years | 92.2% | +4.1K% |
526 data points over 25 years. The pattern repeats: early volatility, mid-term clarity, long-term outperformance. The data is the strategy.
Stock Advisor Performance by Year
| Year | SA Picks | Avg Return | Win Rate | |
|---|---|---|---|---|
| 2026 | 31 | +10% | 57% | DDOG+97% |
| 2025 | 26 | +7% | 48% | ASML+133% |
| 2024 | 25 | +25% | 67% | AMD+186% |
| 2023 | 25 | +78% | 73% | CRWD+607% |
| 2022 | 23 | +58% | 59% | NET+495% |
| 2021 | 22 | -13% | 32% | LRCX+491% |
| 2020 | 24 | +146% | 46% | TSLA+1.1K% |
| 2019 | 23 | +56% | 70% | SNPS+259% |
| 2018 | 19 | +228% | 68% | SHOP+1.1K% |
| 2017 | 22 | +700% | 86% | NVDA+8.4K% |
| 2016 | 20 | +446% | 80% | SHOP+4.6K% |
| 2015 | 22 | +208% | 68% | CASY+839% |
| 2014 | 20 | +354% | 80% | ATVI+2.8K% |
| 2013 | 17 | +386% | 65% | NFLX+2.5K% |
| 2012 | 23 | +1.2K% | 74% | TSLA+16K% |
| 2011 | 19 | +561% | 63% | AAPL+3.2K% |
| 2010 | 18 | +459% | 83% | AMZN+2.9K% |
| 2009 | 20 | +3.3K% | 90% | NVDA+56K% |
| 2008 | 18 | +1.2K% | 89% | AAPL+6.5K% |
| 2007 | 19 | +1.5K% | 37% | NFLX+29K% |
| 2006 | 20 | +2.5K% | 65% | NFLX+25K% |
| 2005 | 16 | +8.4K% | 63% | NVDA+133K% |
| 2004 | 17 | +6.0K% | 59% | NFLX+44K% |
| 2003 | 17 | +229% | 65% | PHIN+1.4K% |
| 2002 | 16 | +3.2K% | 81% | AMZN+35K% |
Inside Stock Advisor
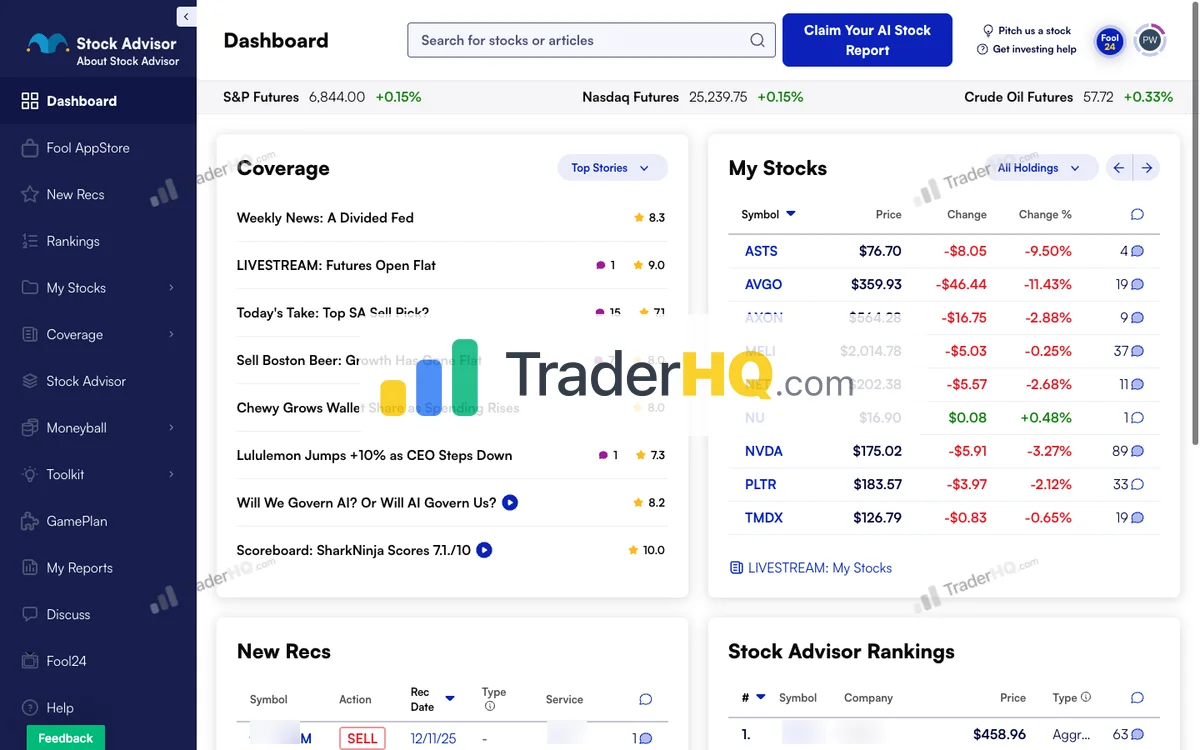
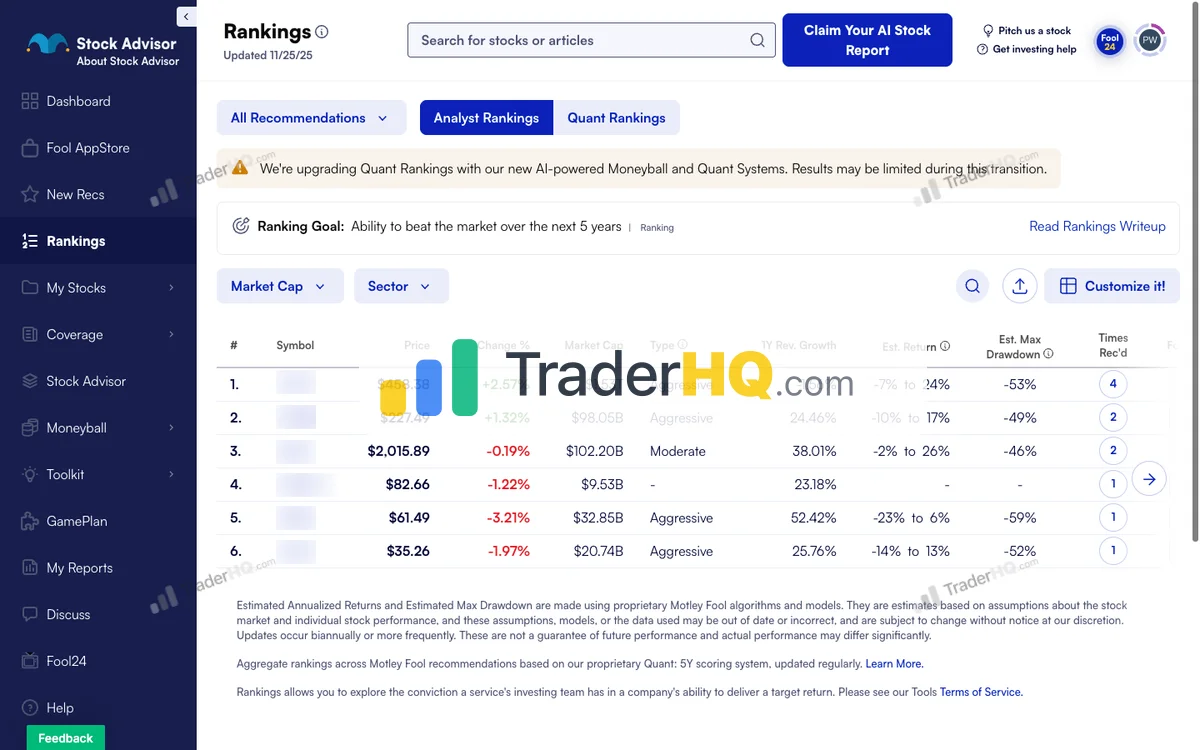
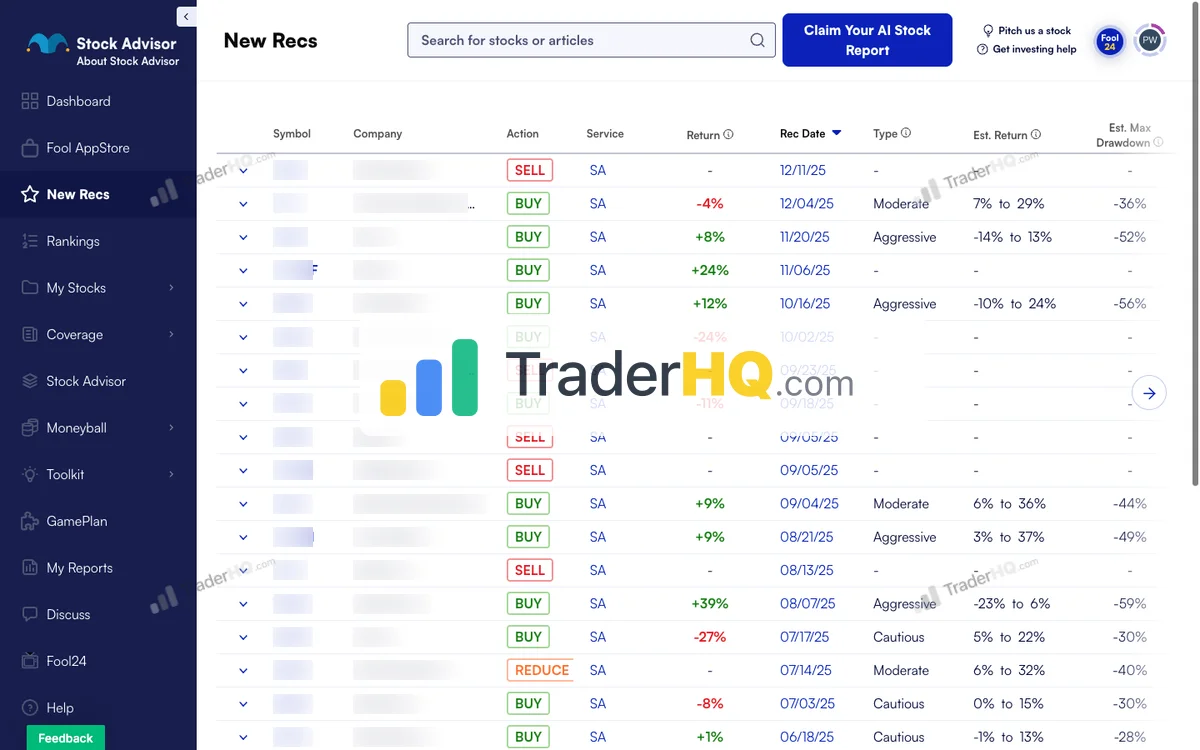
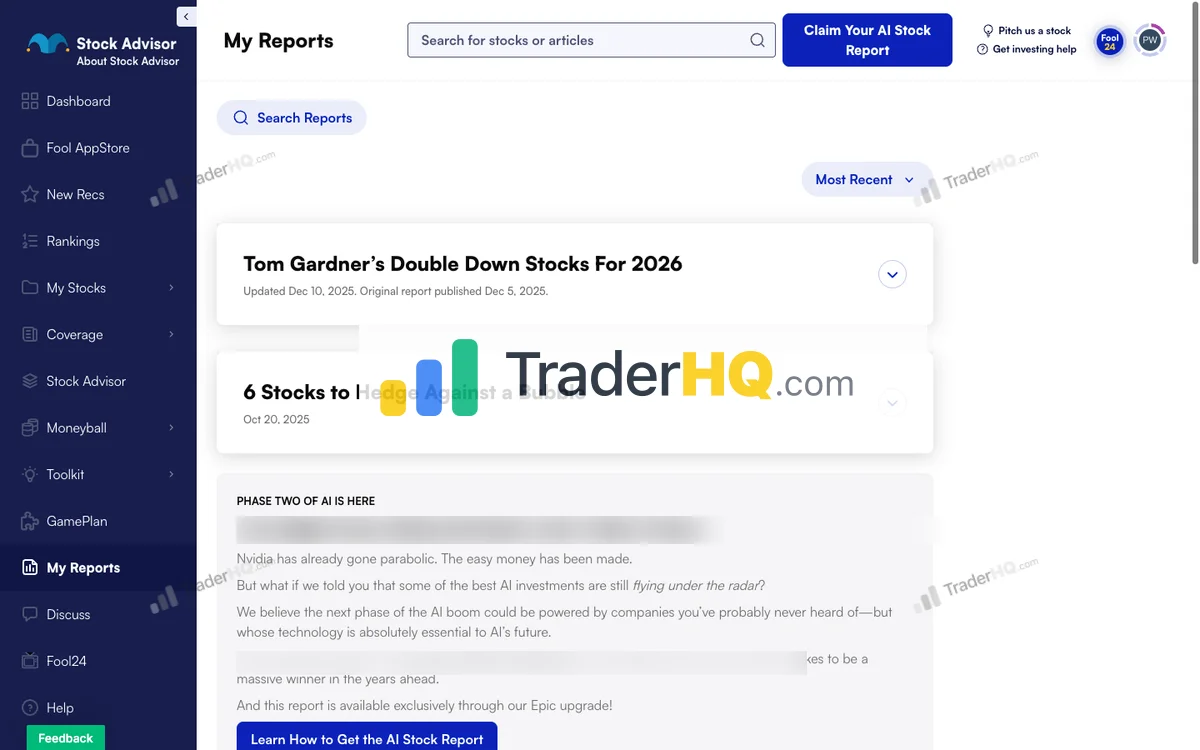
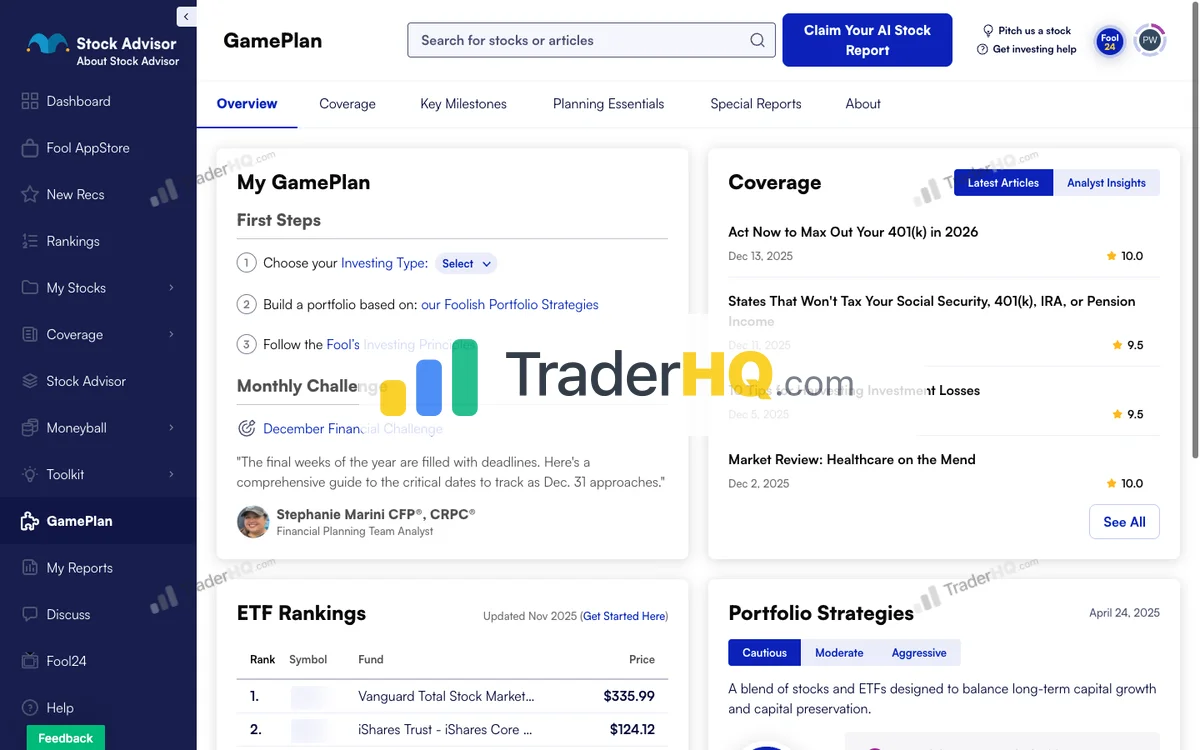
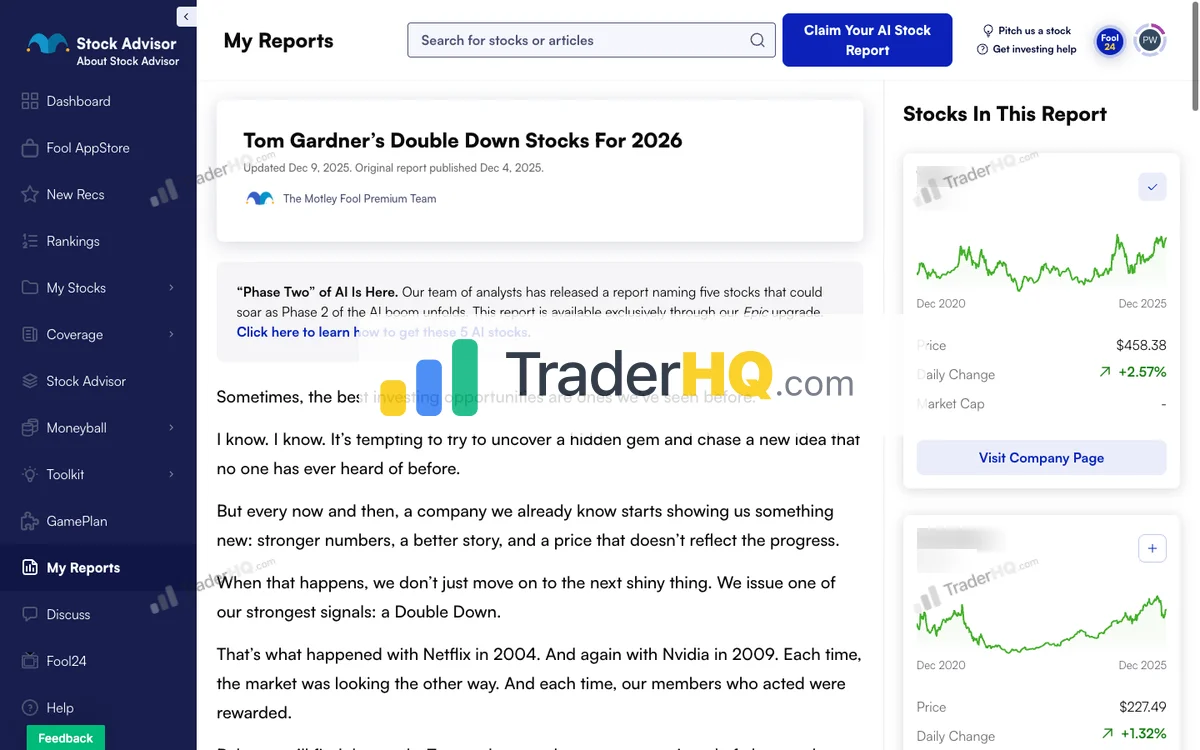
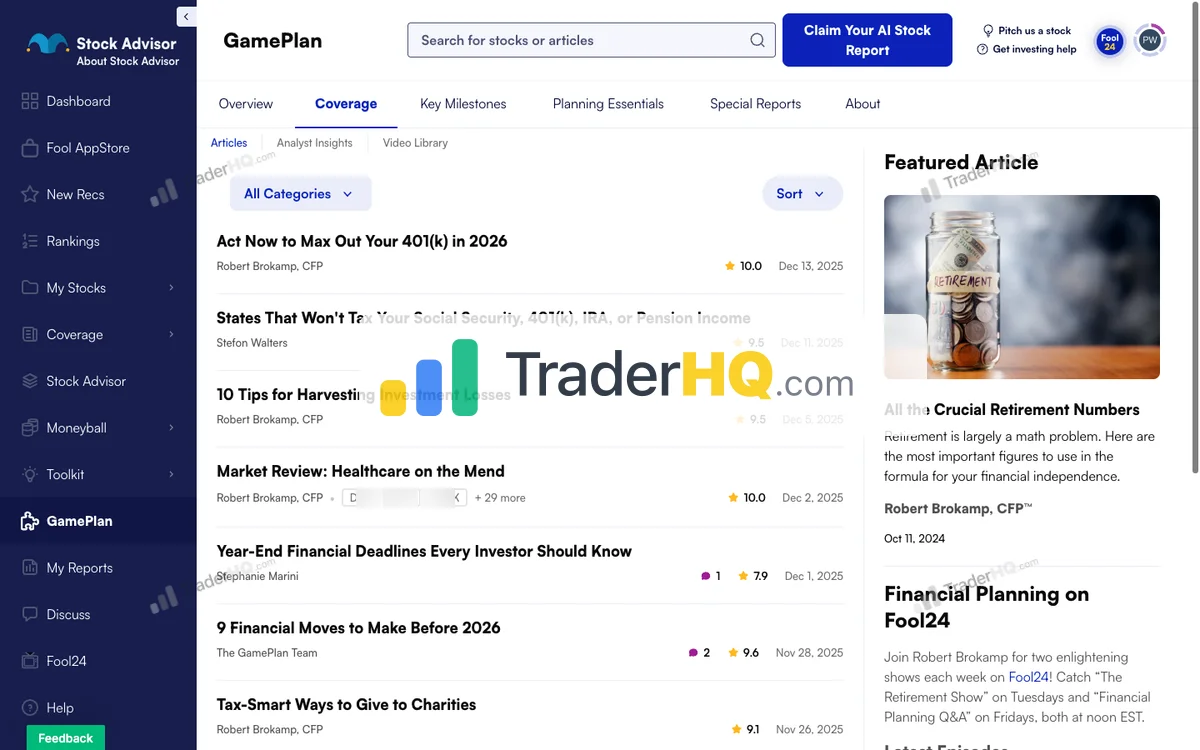
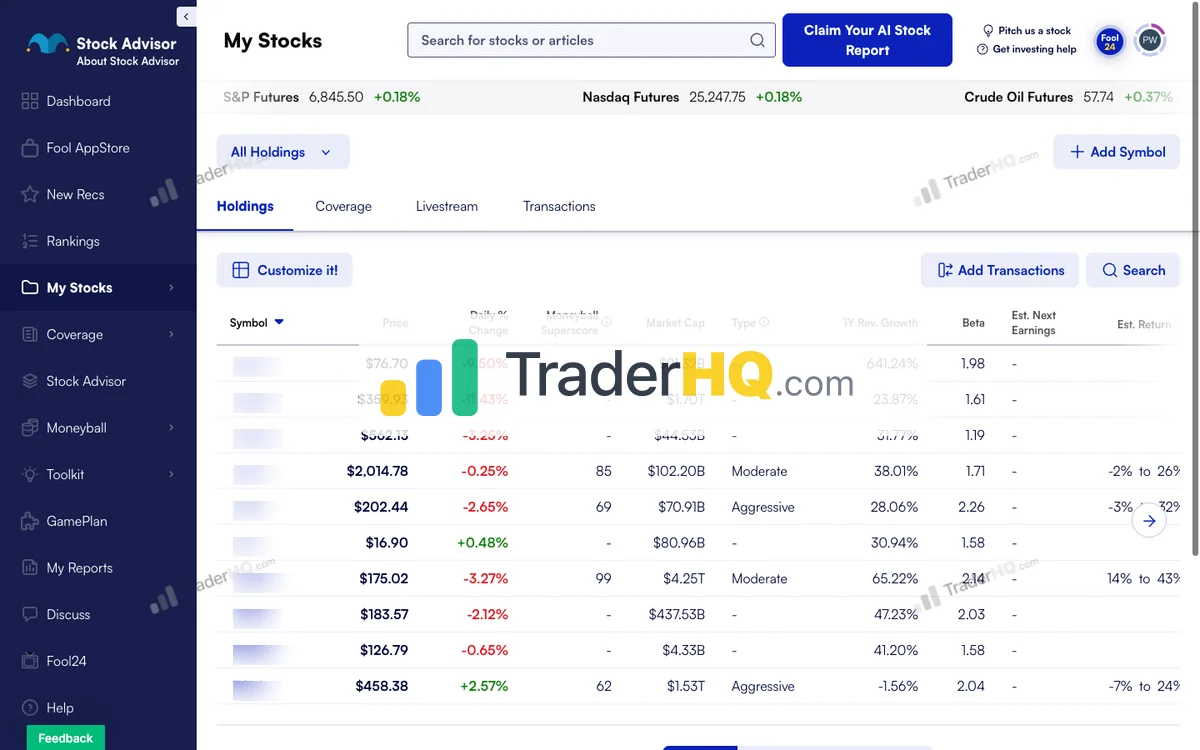
9 screenshots · Click to expand
The Track Record
$10,000 invested in Stock Advisor’s picks in 2002 would be worth roughly $107,886 today. The same $10,000 in an S&P 500 index fund? About $31,400.
| Metric | Stock Advisor | S&P 500 |
|---|---|---|
| Cumulative Return (since 2002) | +978.9% | +214% |
| 2022 Drawdown | ~40% | ~18% |
| Win Rate (10+ year holds) | 92.2% | — |
| Win Rate (under 1 year) | 52.2% | — |
The pattern is clear: time is the strategy. Hold for a decade and you’re winning 92.2% of the time with an average return of +4,051.8%. Bail in the first year and you’re barely better than a coin flip. The service has produced 46 ten-baggers and 191 doublers over its 24.5-year history.
How we did the math (TraderHQ analysis of the published trade log, data as of Aug 31, 2026): We computed returns from the publisher’s published trade log of 526 positions using recommendation-date closing prices, with dividends included where applicable. The S&P 500 comparison is the average of index returns over each pick’s individual holding period—an apples-to-apples benchmark, not the index’s full-period return. This is our own computation of the publisher’s record, confirmed to match their aggregates; it is not a third-party audit.
Known data gaps: 4 positions lack entry dates; 23 positions have no computed return; sector data covers only 4% of positions, so sector rankings would be unrepresentative.
Position-level texture: The record’s best and worst are both instructive. NVDA, recommended April 1, 2005, is up +133,425% after 21 years—the single biggest driver of the headline. AMZN, the program’s second pick (Sept 2002), is up +34,705% and still held. On the losing side, SIVB.Q lost -99.3% (2016) and SKLZ lost -99% (2021). A third of picks lose money; winners average +1,701.7% while losers average -44.5%.
A service’s published record belongs to the picks; your record belongs to your entries, your exits, and your temperament. The distance between those two numbers is where almost all subscriber disappointment lives. The published record is time-weighted and pick-weighted; your results will be entry-weighted and behavior-weighted. And any winning number travels with its whole book—loser share, average loss, and the counting method—stated in the same sentence. A highlight without its denominator is marketing, not evidence.
The full book matters, too. Even a perfect follower gets the returns of the year they started, not the lifetime average. The 2021 vintage averaged -13% with a 32% win rate; 2008’s bear-market vintage averaged +1,195% with an 89% win rate. Judge any long record by its starting cohorts—different start years effectively bought different products.
What You Get
- 2 stock picks per month — One from Tom Gardner’s team, one from the Stock Advisor team
- Foundational Stocks — 10 highest-conviction core holdings to build your portfolio around
- Moneyball Database — 340+ companies with 12+ scoring dimensions
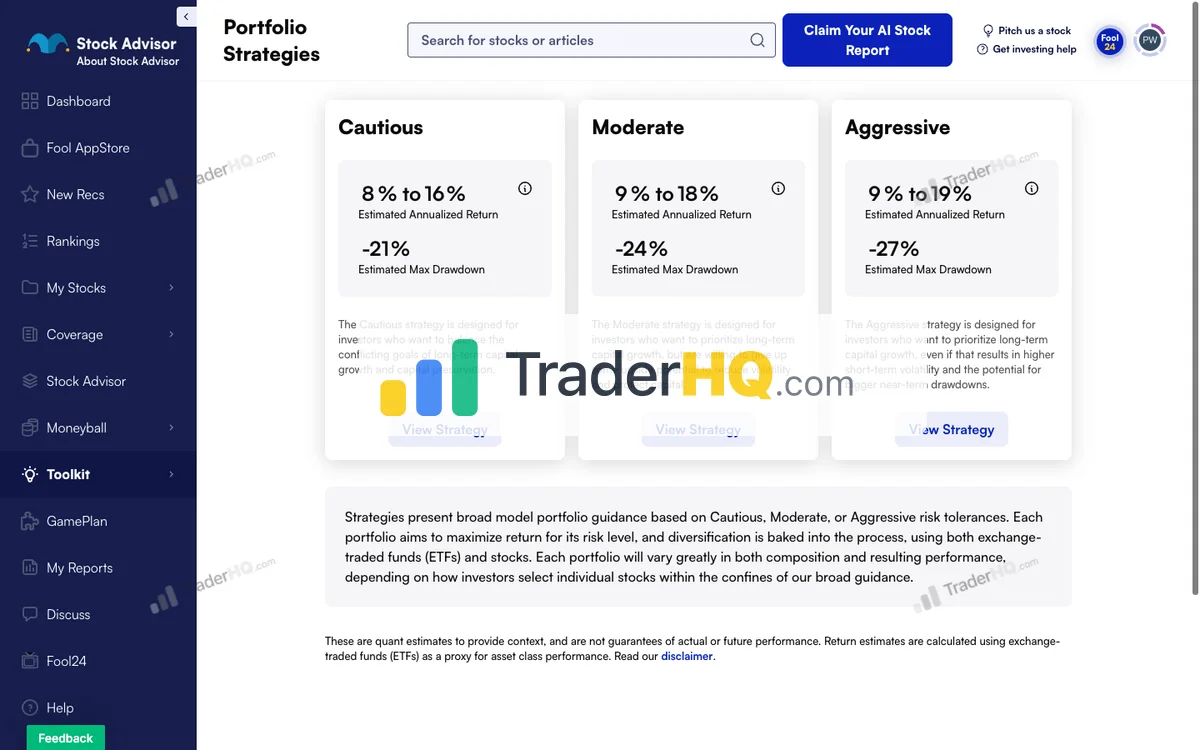
- Portfolio Strategies — Cautious, Moderate, and Aggressive frameworks based on your risk tolerance
- Fool IQ Access — Financial data and quant projections
The Pricing
- New Member Price: $99/year (50% off)
- Regular Price: $199/year
- Refund Policy: 30-day money-back guarantee, no questions asked
At $99/year, you’re paying roughly $1.90 per week. If just ONE pick outperforms the S&P 500 by 4% on a $5,000 position, that’s $200 in excess returns—you’ve paid for the service for two years.
Try Stock Advisor — 30-Day Guarantee
Epic: The Bundle Tier
Motley Fool Epic is where things get interesting—and where the upselling begins in earnest. It bundles four services that would cost significantly more separately.
No screenshots available for motley-fool-epic
What’s Included
- Stock Advisor — 2 picks/month (the flagship)
- Rule Breakers — 1 pick/month (high-growth disruptors)
- Hidden Gems — 1 pick/month (Tom Gardner’s small-cap hunting ground)
- Dividend Investor — 1 pick/month (income focus)
- Full Fool IQ Access — Financial data, quant projections
- GamePlan+ — Retirement planning, tax strategies
The Track Record by Scorecard
Stock Advisor and Rule Breakers figures are TraderHQ analysis of the published trade log (data as of Aug 31 and Aug 19, 2026, respectively); Hidden Gems and Dividend Investor are publisher scorecard figures.
| Service | Total Return | vs S&P 500 |
|---|---|---|
| Stock Advisor | +978.9% | +765% |
| Rule Breakers | +311.9% | +126.2% |
| Hidden Gems | +46.74% | -17% |
| Dividend Investor | +16.83% | -40% |
The honest take: Stock Advisor and Rule Breakers carry the performance. Hidden Gems adds genuinely differentiated small-cap exposure. Dividend Investor has significantly underperformed the market—if income is your goal, you might be better served elsewhere.
The Pricing
- New Member Price: $299/year ($200 off — auto-applied)
- Regular Price: $499/year
- Refund Policy: 30-day money-back guarantee
Who Should Choose Epic Over Stock Advisor?
Epic makes sense if you:
- Have $50,000+ to invest
- Want exposure to small-caps (Hidden Gems)
- Like having more picks to choose from (5/month vs 2)
- Value the diversified strategy approach
Stock Advisor is enough if you:
- Have under $50K to invest
- Prefer simplicity (2 picks/month)
- Don’t need income-focused recommendations
Try Epic — Save $200 (Auto-Applied)
The Premium Tiers: Epic Plus, Fool Portfolios, and Fool One
This is where The Motley Fool’s pricing—and refund policies—change dramatically.
Epic Plus ($1,999/year)
What it adds over Epic:
- Daily Moneyball recommendations (up to 250/year)
- AI Playbook Portfolio
- 5 Moneymakers Portfolios backed by Motley Fool capital
- Options trading strategies
- Expanded Moneyball database (3,500+ vs 340+ companies)
Target portfolio: $100,000+
Critical difference: No cash refund. You get a credit swap to Epic ($499 value) if you want out. That’s a $1,500 loss.
Fool Portfolios ($3,999/year)
What it adds over Epic Plus:
- Tom Gardner’s Everlasting Portfolio (the only stocks he personally owns)
- 35 total real-money portfolios
- Cryptoball database (800+ cryptocurrencies)
- White-glove support with Investor Solutions
Target portfolio: $250,000+
Critical difference: Credit swap to Epic Plus means you lose $2,000.
Fool One ($13,999/year)
What it adds:
- Complete all-access to every Motley Fool service
- One Portfolio with quarterly rebalancing
- Microball database (2,500+ microcap companies)
- Exclusive events and early access to new tools
Target portfolio: $500,000+
Critical difference: Credit swap to Fool Portfolios means you lose $10,000.
Warning: The premium tiers have no cash refunds. Before committing $2,000+, make sure you’ve used Stock Advisor or Epic long enough to know the Foolish philosophy works for your temperament.
The Upselling Reality
Let’s address the elephant in the room: The Motley Fool will try to upsell you constantly.
Once you subscribe to Stock Advisor, you’ll receive emails promoting Epic. Subscribe to Epic, and you’ll hear about Epic Plus. This is relentless and, frankly, annoying.
How to handle it:
- Start with Stock Advisor ($99). Use it for at least a year.
- If you’re following the picks and building conviction, consider Epic.
- Only upgrade to premium tiers when your portfolio actually justifies it.
- Ignore the urgency tactics. The deals come back.
The services themselves are good. The marketing pressure is not. Separate the two in your mind.
Which Motley Fool Service Is Right for You?
Start with Stock Advisor if:
- You’re new to stock picking services
- Your portfolio is under $50,000
- You want the simplest possible approach (2 picks/month)
- You’re not sure if you can hold through volatility (test yourself first)
Upgrade to Epic if:
- You’ve used Stock Advisor for 6+ months and want more
- Your portfolio is $50,000+
- You want small-cap exposure (Hidden Gems)
- You value having diversified strategies in one place
Consider Premium Tiers if:
- Your portfolio is $100,000+ (Epic Plus), $250,000+ (Portfolios), or $500,000+ (One)
- You want daily recommendations and AI-driven insights
- You specifically want access to Tom Gardner’s real-money portfolios
- You understand and accept the credit-swap-only refund policy
Who Should NOT Use The Motley Fool
The Motley Fool’s philosophy requires specific behaviors. If you can’t commit to these, the services won’t work for you—regardless of their track record.
Don’t subscribe if:
-
You can’t hold through a 40% drawdown. Not “you think you can”—you’ve actually done it. Stock Advisor’s best performers have all crashed at some point.
-
You want to trade actively. These services recommend buying and holding for years. If you get bored without action, you’ll overtrade and destroy your returns.
-
You need the money in 3 years. This is a 5+ year strategy. Volatility can hurt you in shorter timeframes.
-
You’re income-focused. Dividend Investor has underperformed. If income is your primary goal, look at dedicated dividend services or dividend ETFs.
-
You have under $10,000 to invest. The diversification required (25+ positions) doesn’t work with small portfolios.
If any of these describe you: Consider Morningstar Investor for research without picks, or explore our guide to best stock research websites for alternatives. There’s no shame in indexing—it beats most active investors anyway. See our Morningstar Investor review for details.
The Motley Fool vs. Alternatives
| Service | Price | Track Record | Best For |
|---|---|---|---|
| Stock Advisor | $99-199/yr | +978.9% (24.5 yrs) | Long-term growth investors |
| Alpha Picks | $449/yr | +347.9% (4.1 yrs) | Data-driven investors |
| Morningstar Investor | $249/yr | N/A (research) | Self-directed researchers |
| Index Fund (VOO) | ~0.03% ER | +214% (24.5 yrs) | Passive investors |
Stock Advisor vs. Alpha Picks: Stock Advisor has a 24.5-year track record with +978.9% total returns and 46 ten-baggers (TraderHQ analysis of the published trade log, data as of Aug 31, 2026); Alpha Picks has 4.1 years but an impressive +347.9% total return and a 66% win rate across 104 positions (TraderHQ analysis of the published trade log, data as of Sep 1, 2026). Stock Advisor focuses on quality growth (GARP); Alpha Picks uses quantitative scoring. If you want proven longevity and through-cycle resilience, Stock Advisor wins. If you prefer quant-driven value investing with shorter holding periods, Alpha Picks is worth considering. See our Stock Advisor vs Alpha Picks comparison for the full breakdown.
Stock Advisor vs. Indexing: The honest answer is that most investors should probably just index. Stock Advisor has beaten the market, but only for those who actually held through the volatility. If you’ll panic-sell during crashes, indexing will serve you better.
The Bottom Line
The Motley Fool is legitimate. The track records are real. The philosophy—buy great companies, hold for years, let winners run—is sound.
But the experience includes relentless upselling, and the returns only materialize for investors who can actually follow the process through brutal drawdowns.
My recommendation:
-
Start with Stock Advisor at $99/year. It’s low-risk with a 30-day guarantee, and it gives you everything you need to test the Foolish philosophy. Read our Stock Advisor review for the complete analysis.
-
Use it for at least a year before upgrading. See if you can actually hold when positions drop 30-40%.
-
Only upgrade when your portfolio justifies it. Epic at $50K+, Epic Plus at $100K+, and so on.
-
Ignore the marketing pressure. The services are good. The sales tactics are not. Separate them.
If you can commit to the philosophy—5+ year holds, adding regularly, holding through volatility—The Motley Fool’s track record suggests you’ll do well. If you can’t, save your money and buy an index fund.
Explore all your options in our best stock advisors guide.
Frequently Asked Questions
Is Motley Fool worth the money?
Yes, for long-term investors who can hold 5+ years. Stock Advisor has returned +978.9% since 2002 compared to the S&P 500’s +214% (TraderHQ analysis of the published trade log, data as of Aug 31, 2026)—with 46 ten-baggers, 191 doublers, and a 92.2% win rate for 10+ year holds. At $99/year for new members, the math works if you follow the strategy. The catch: 34% of picks lose money, and the winners require holding through significant volatility. If you’ll panic-sell during drawdowns, the service won’t work for you regardless of its track record.
What is the best Motley Fool service?
Stock Advisor is the best starting point for most investors. It has the longest track record (24+ years), the lowest price ($99/year for new members), and delivers everything most investors need: 2 picks per month, foundational stock recommendations, and portfolio construction guidance. Only upgrade to Epic or premium tiers when your portfolio size justifies it ($50K+ for Epic, $100K+ for Epic Plus).
Is Motley Fool legit or a scam?
The Motley Fool is a legitimate 30-year-old investment research company founded by Tom and David Gardner in 1993. Their performance is verified and publicly displayed on their scorecards—including both winners and losers. The company is not a scam. However, the marketing is aggressive, the upselling is relentless, and the advertised returns required holding through drawdowns that most subscribers didn’t survive. The returns are real; capturing them requires discipline.
How do I cancel Motley Fool?
For Stock Advisor and Epic: You can cancel within 30 days for a full refund, no questions asked. Contact member services at 1-888-665-3665 or through your account dashboard. For Epic Plus, Fool Portfolios, and Fool One: There are no cash refunds. You can only swap your membership credit to a lower tier—which means losing significant value ($1,500 to $10,000 depending on your tier). Understand this before subscribing to premium services.
Should I get Stock Advisor or Epic?
Start with Stock Advisor unless you have $50,000+ to invest. Stock Advisor at $99/year gives you 2 picks per month and the complete portfolio-building framework. Epic at $299/year adds 3 more picks (from Rule Breakers, Hidden Gems, and Dividend Investor) but requires a larger portfolio to properly diversify across all recommendations. Use Stock Advisor for at least 6 months before considering an upgrade.
Does David Gardner still pick stocks?
No. David Gardner stepped back from active stock picking in May 2021. He now focuses on education through his Rule Breaker Investing podcast (Wednesdays at 4pm ET) and chairs The Motley Fool Foundation. The services that carry his philosophy—including Rule Breakers—are now managed by analyst teams using his criteria. Tom Gardner remains actively involved in stock selection for Hidden Gems, Moneyball Portfolio, and his personal Everlasting Portfolio.
How do Motley Fool services perform in today’s sector rotation?
The sector bifurcation is exactly why the Motley Fool has multiple services — each one serves a different piece of this divided market.
The numbers tell the story: Energy leads at +38.4% YTD (refiners MPC +130%, VLO +120%) and memory/storage is on fire (SNDK +560%, MU +236%, STX +201%), while ad-tech and software collapse (TTD -63.9%, APP -53.7%, INTU -45.8%). The Fed may hike in September—odds went from ~35% to ~60–65% after Jackson Hole—and CPI runs at 3.4% with the war premium in the energy data. With a 210-point dispersion between the top 20 stocks (+168.7% average) and the bottom 20 (-41.6% average), being in the right stocks matters more than being in the market.
Here’s how each service maps to the rotation:
- Stock Advisor (EXCEPTIONAL fit): Quality GARP methodology owns the hardware winners and treats software names down 25–50% as thesis calls, not stop-loss candidates. Its +978.9% total return, 46 ten-baggers, and 191 doublers across 526 positions (TraderHQ analysis of the published trade log, data as of Aug 31, 2026) prove the approach works — thriving through 2008, 2020, and 2022 alike
- Rule Breakers (STRONG fit): The memory/HBM sold-out cycle and Moderna’s mRNA oncology breakthrough (+376% YTD) are exactly the innovation themes this service hunts. The 37 ten-baggers and 98.6% win rate for 10+ year holds were built by buying during exactly these transitional moments (official-computed, data as of Aug 19, 2026)
- Epic (GOOD fit): Multi-strategy diversification captures the winning themes alongside quality exposure, while Hidden Gems benefits from manufacturing expansion (ISM 55.6, highest since May 2022)
The Fed holding at 3.50–3.75% with a hike ~65% priced, CAPE near 40–42, and credit spreads at a calm 2.60% all point to an environment where the ecosystem approach (quality + growth + small-cap + income) is more valuable than any single strategy.
Is The Motley Fool worth it at all-time market highs?
The S&P 500 closed August at 7,686, up +13.1% YTD and less than 1% from its all-time high — but the headline number hides extreme stock-level bifurcation. The underlying reality is deeply divided:
- Winners: Energy +38.4%, memory/storage (SNDK +560%, MU +236%), cybersecurity (FTNT +115%, PANW +107%), and Moderna +376%
- Losers: Ad-tech (TTD -63.9%, APP -53.7%), software (INTU -45.8%), medtech (BSX -49.3%)
- 210-point dispersion between top 20 (+168.7%) and bottom 20 (-41.6%)
CAPE near 40–42 — the highest since September 2000 — compresses forward index returns to an estimated 5–8% CAGR over the next decade. But disciplined stock pickers are capturing the rotation — top 20 performers averaged +168.7% while the index gained 13%. Stock Advisor’s +978.9% total return and 46 ten-baggers were built across multiple cycles (TraderHQ analysis of the published trade log, data as of Aug 31, 2026), including periods with similarly elevated valuations. With core CPI at 2.5%, the underlying disinflation picture still supports quality businesses with pricing power.
Is The Motley Fool worth it in 2026’s volatile market?
Yes — the current market validates their multi-service ecosystem from both sides. The VIX sits at 14.92 — calm at the index level — while individual stocks split by 210 points between winners and losers. Bearish sentiment sits at 44.4%, the highest since March’s war panic — yet manufacturing (ISM 55.6) and credit spreads at 2.60% confirm no systemic stress. The real risk is the Fed: a September hike is ~65% priced after Jackson Hole. This transitional environment is where multiple analytical frameworks pay off:
- Stock Advisor’s GARP methodology captures quality stocks through the rate uncertainty. Its +978.9% total return was built by holding through exactly these fear-and-recovery cycles — bear-market vintages historically average +1,094% with a 64% win rate (TraderHQ analysis of the published trade log, data as of Aug 31, 2026)
- Rule Breakers’ growth thesis maps onto the innovation cycle that’s accelerating — memory/HBM demand sold out and the mRNA oncology platform validated. Its 37 ten-baggers were built by buying during moments of fear that turned out to be temporary
- Hidden Gems benefits from manufacturing expansion (ISM 55.6) and the broadening leadership beyond mega-cap tech
Services with 20+ year track records have navigated worse — the 2008 crisis, 2020 COVID crash, and 2022 bear market. Current conditions are transitional, not catastrophic.