

You’ve narrowed it down to two: Motley Fool Stock Advisor and Alpha Picks by Seeking Alpha. One has 24.5 years of documented outperformance and a philosophy built on human judgment. The other is a pure algorithm that’s crushed the market in its 4.2-year existence.
Both deliver 2 picks per month. Both have transparent track records. Both claim to beat the S&P 500.
So which one actually deserves your money?
Quick Answer
Stock Advisor wins for most investors.
The reasons: a 24.5-year track record (+978.9% vs the S&P 500’s +214% per its per-position benchmark, TraderHQ analysis, data as of Aug 31, 2026), a promo price 4.5x lower ($99 vs $449), and a 30-day money-back guarantee.
Alpha Picks is the better pick if you trust algorithms over analysts and target 1-3 year holding periods, where its win rate climbs to 77.6% (TraderHQ analysis, as of Sep 1, 2026).
Full comparison in one line: veteran conviction (24.5 years, +978.9% TraderHQ analysis total return, 10.2% CAGR) vs quantitative momentum (4.2 years, +347.9% TraderHQ analysis total return, 43.3% CAGR) — complementary strengths, not competitors.
The market’s internal bifurcation illustrates the debate perfectly. Stock Advisor’s human analysts evaluate why — through-cycle judgment that reads sector leadership shifts and identifies durable quality. Alpha Picks’ quant model reads what — factor signals regardless of narrative.
Current conditions sharpen the stakes: with the S&P 500 up 13.1% year-to-date (total return, Slickcharts, Aug 31, 2026) and a 210-point spread between its average top-20 and bottom-20 names, the methodology you choose matters more than the market you’re in.
The case for human conviction (Stock Advisor):
- 46 ten-baggers and 191 doublers across 526 positions and multiple market cycles — including 2008, 2020, and 2022
- +978.9% total return (TraderHQ analysis, as of Aug 31, 2026) with a 66% win rate — quality GARP that has thrived through dot-com, financial crisis, and pandemic
- Stock Advisor’s analyst team evaluates management quality, competitive positioning, and the disconnect between sentiment and fundamentals — the qualitative factors algorithms miss
The case for quant discipline (Alpha Picks):
- +347.9% total return and a 66% win rate across 104 positions (TraderHQ analysis, as of Sep 1, 2026), with a 43.3% CAGR and a small/mid-cap tilt
- Its edge is time-dependent: positions held 1-3 years show a 77.6% win rate and +94.5% average return, versus roughly a coin flip under one year — precisely the pattern factor-driven systematic exits are built around
- The algorithm doesn’t care about sentiment — it reads Value, Growth, Profitability, Momentum, and EPS Revisions signals mechanically
Both services earn strong fit ratings — for different reasons. Stock Advisor thrives on through-cycle quality selection. Alpha Picks thrives on tactical rotation capture with systematic exits. The real question: which approach matches your investing philosophy?
Let me show you exactly why.
How We Compared Them
A note on method before the numbers: every performance figure in this comparison comes from TraderHQ analysis of each publisher’s published trade log (Stock Advisor: 526 positions, data as of Aug 31, 2026; Alpha Picks: 104 positions, data as of Sep 1, 2026). We computed both ourselves using the same benchmark method — the S&P 500 averaged over each pick’s individual holding period — applied identically to both services, so the comparison is apples-to-apples.
Known gaps, disclosed: Stock Advisor has sector data for only ~4% of positions and 23 positions without computed returns. Alpha Picks has no sector data at all, and its 2026 vintage is only months old. Neither dataset is a third-party audit.
Quick Comparison: Motley Fool Stock Advisor vs Alpha Picks
| Dimension | Stock Advisor | Alpha Picks | Edge |
|---|---|---|---|
| Track Record | +978.9% since 2002 (TraderHQ analysis, Aug 31 2026) | +347.9% since July 2022 (TraderHQ analysis, Sep 1 2026) | Stock Advisor |
| vs S&P 500 | +764.9% alpha (S&P +214%, per-position) | +244.1% alpha (S&P +103.8%, per-position) | Stock Advisor |
| Price | $99/year promo ($199 list) | $449/year promo ($499 list) | Stock Advisor |
| Refund Policy | 30-day money-back | No refunds | Stock Advisor |
| Methodology | Human analysts + quant tools | Pure algorithm (5 factors) | Tie |
| CAGR | 10.2% | 43.3% | Alpha Picks |
| Win Rate | 66% overall (69.9% at 3+ years) | 66% overall (77.6% at 1-3 years) | Depends on horizon |
| Ten-Baggers | 46 ten-baggers, 191 doublers | 3 ten-baggers, 21 doublers | Stock Advisor |
| Median Pick Return | 42.4% | 20.8% | Stock Advisor |
| Optimal Holding Period | 5+ years | 1-3 years | Depends |
| Educational Value | High (builds investor capability) | Low (just delivers picks) | Stock Advisor |
| Overall Winner | — | — | Stock Advisor |
The numbers tell a clear story. Stock Advisor costs less, has more proof, and comes with a guarantee. Alpha Picks has a higher annualized return (43.3% CAGR vs 10.2%)—but 4.2 years of data isn’t the same as 24.5 years of market cycles.
Important caveat: Alpha Picks launched in July 2022, giving it only 4.2 years of track record. Its 2026 vintage is underwater so far (-6% average, 38% win rate — TraderHQ analysis, as of Sep 1, 2026).
For investors with 5+ year horizons, Stock Advisor’s data is more relevant. For those seeking 1-3 year opportunities, Alpha Picks’ 77.6% win rate in that window is compelling—but we recommend capping ratings for longer horizons until more data accumulates.
Try Stock Advisor — 30-Day Guarantee
Motley Fool Stock Advisor: The 24.5-Year Track Record
Motley Fool Stock Advisor is the original Motley Fool subscription—the service that built their reputation. Founded in 2002, it’s survived the dot-com hangover, the 2008 financial crisis, the 2020 pandemic crash, and the 2022 growth stock massacre.

Motley Fool Stock Advisor Performance
The Motley Fool · 526 picks · 25 years · Updated Aug 31, 2026
| SA Return | S&P 500 | Alpha | Win Rate |
|---|---|---|---|
| +979% | +214% | +765% | 66% |
S&P 500 shows what you'd have earned buying the index on each pick date instead. Same timing, fair comparison.
| SA Multi-Baggers | 10x+ | 5x+ | 3x+ | 2x+ |
|---|---|---|---|---|
| Count | 46 | 91 | 128 | 191 |
| SA Asymmetry | Avg Winner | Avg Loser | Ratio |
|---|---|---|---|
| Return | +1.7K% | -44% | ~38:1 |
Best Performers (All-Time)
| SA Pick | Return |
|---|---|
 SHOP Shopify | +4.6K% |
 AAPL Apple | +6.5K% |
 TSLA Tesla | +16K% |
 CTAS CTAS | +4.6K% |
 NFLX Netflix | +44K% |
 BKNG Booking Holdings | +22K% |
 DIS Disney | +6.1K% |
 AMZN Amazon | +35K% |
 MME.DL MME.DL | +4.3K% |
 NVDA NVIDIA | +133K% |
46 ten-baggers. These 1,000%+ winners—NVDA, NFLX, AMZN—are what drive the portfolio. You don't need to pick all winners; you need a few massive ones.
See All Stock Advisor Recommendations →Latest Stock Advisor Picks
Tickers masked to protect subscriber value. Recent picks need 3-5+ years to demonstrate thesis.
| SA Pick | Return |
|---|---|
**** Cloud Monitoring | +97% |
**** Chip Manufacturer | +85% |
**** Infrastructure Construction | +63% |
**** Growth Company | +51% |
**** Growth Company | +41% |
**** E-commerce & Cloud Giant | +28% |
**** Growth Company | +23% |
**** Convenience Stores | +19% |
**** Growth Company | +18% |
**** Growth Company | +16% |
Early results mislead. < 1 year: 57.1% win rate. 10+ years: 92.2%. That 35-point gap explains why judging picks early leads to selling future winners.
Stock Advisor Win Rate by Holding Period
| Hold Time | SA Win Rate | Avg Return |
|---|---|---|
| < 1 Year | 57.1% | +16% |
| 1-3 Years | 55.7% | +11% |
| 3-5 Years | 48.8% | +23% |
| 5-10 Years | 62.9% | +206% |
| 10+ Years | 92.2% | +4.1K% |
Time is the strategy. 10+ year picks show 92.2% win rate with +4.1K% average returns. Same methodology, same picks—time transforms the results.
Stock Advisor Performance by Year
| Year | SA Picks | Avg Return | Win Rate | |
|---|---|---|---|---|
| 2026 | 31 | +10% | 57% | DDOG+97% |
| 2025 | 26 | +7% | 48% | ASML+133% |
| 2024 | 25 | +25% | 67% | AMD+186% |
| 2023 | 25 | +78% | 73% | CRWD+607% |
| 2022 | 23 | +58% | 59% | NET+495% |
| 2021 | 22 | -13% | 32% | LRCX+491% |
| 2020 | 24 | +146% | 46% | TSLA+1.1K% |
| 2019 | 23 | +56% | 70% | SNPS+259% |
| 2018 | 19 | +228% | 68% | SHOP+1.1K% |
| 2017 | 22 | +700% | 86% | NVDA+8.4K% |
| 2016 | 20 | +446% | 80% | SHOP+4.6K% |
| 2015 | 22 | +208% | 68% | CASY+839% |
| 2014 | 20 | +354% | 80% | ATVI+2.8K% |
| 2013 | 17 | +386% | 65% | NFLX+2.5K% |
| 2012 | 23 | +1.2K% | 74% | TSLA+16K% |
| 2011 | 19 | +561% | 63% | AAPL+3.2K% |
| 2010 | 18 | +459% | 83% | AMZN+2.9K% |
| 2009 | 20 | +3.3K% | 90% | NVDA+56K% |
| 2008 | 18 | +1.2K% | 89% | AAPL+6.5K% |
| 2007 | 19 | +1.5K% | 37% | NFLX+29K% |
| 2006 | 20 | +2.5K% | 65% | NFLX+25K% |
| 2005 | 16 | +8.4K% | 63% | NVDA+133K% |
| 2004 | 17 | +6.0K% | 59% | NFLX+44K% |
| 2003 | 17 | +229% | 65% | PHIN+1.4K% |
| 2002 | 16 | +3.2K% | 81% | AMZN+35K% |
Inside Stock Advisor
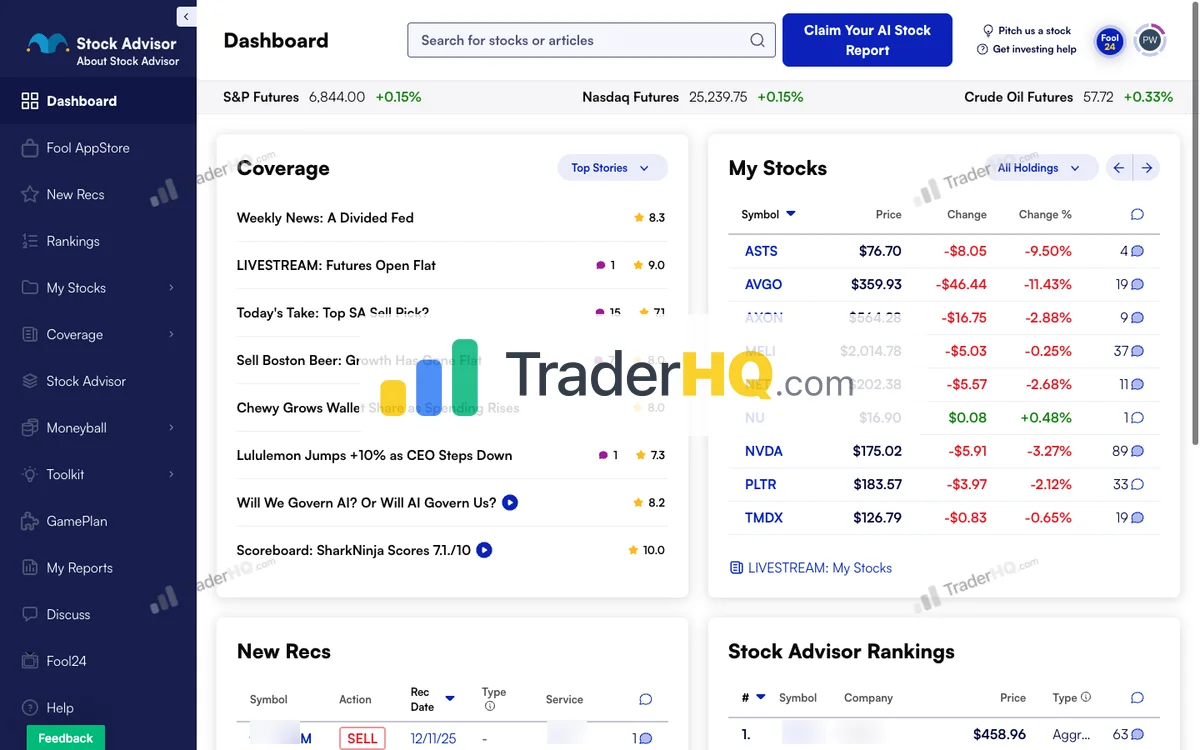
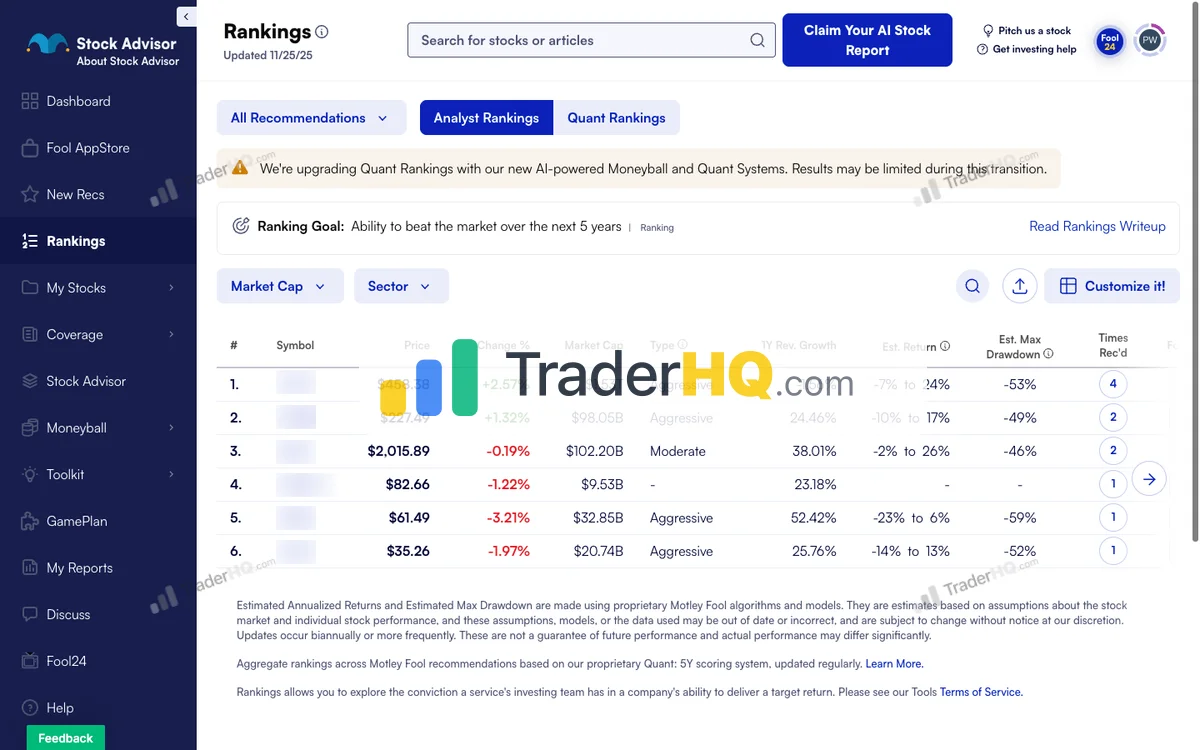
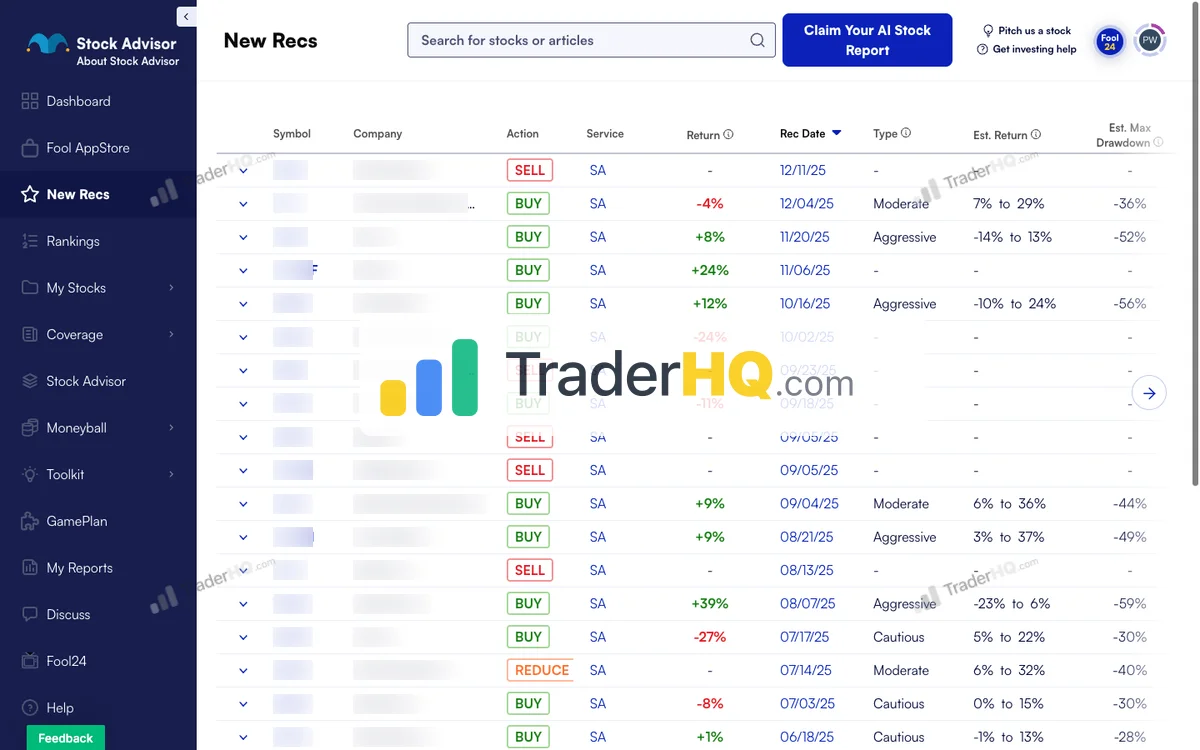
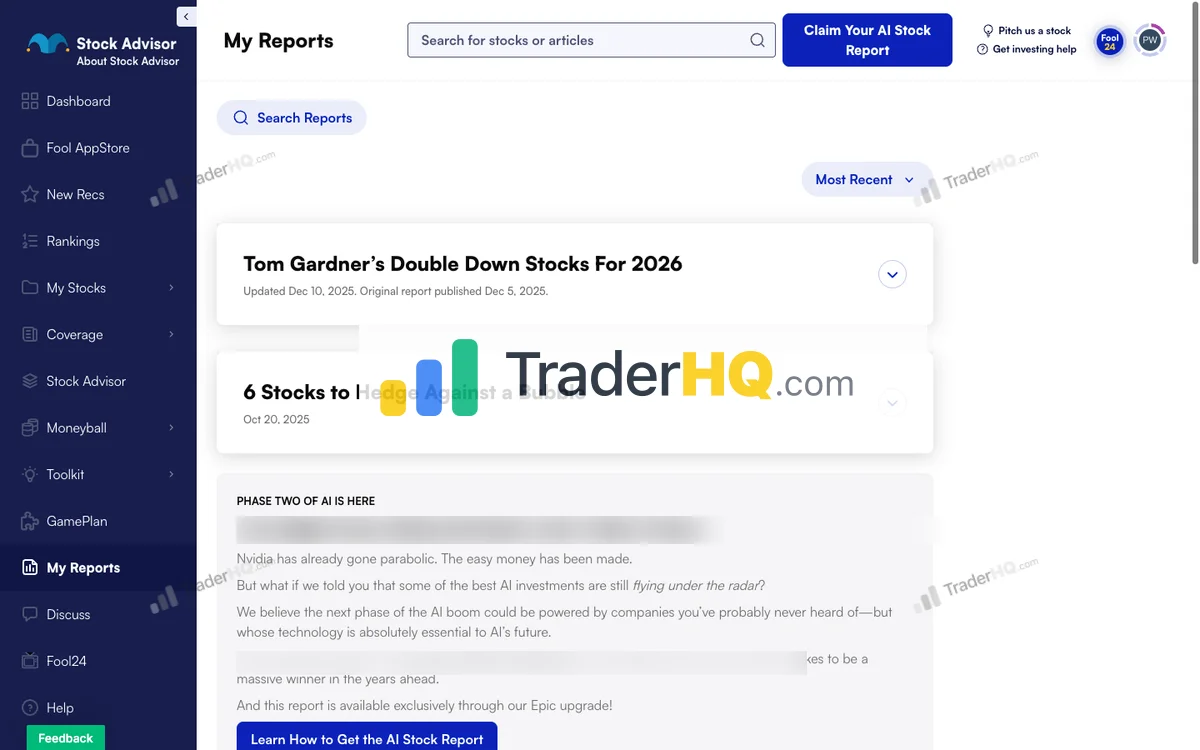
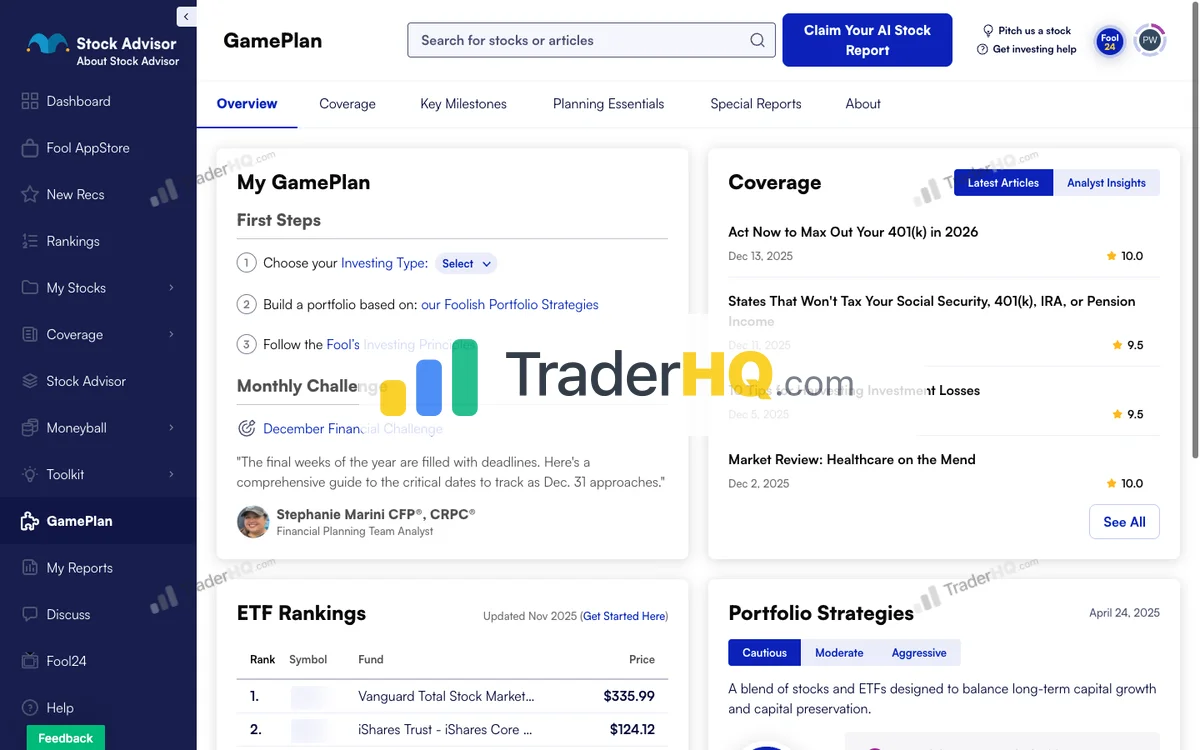
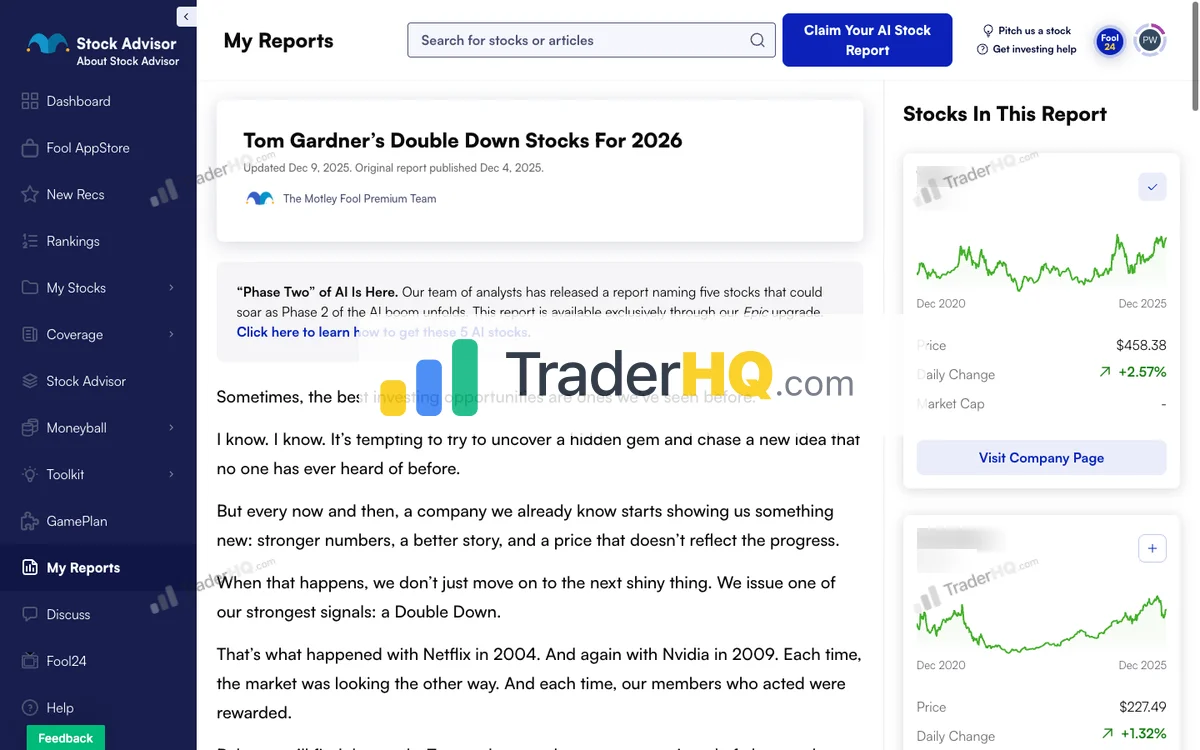
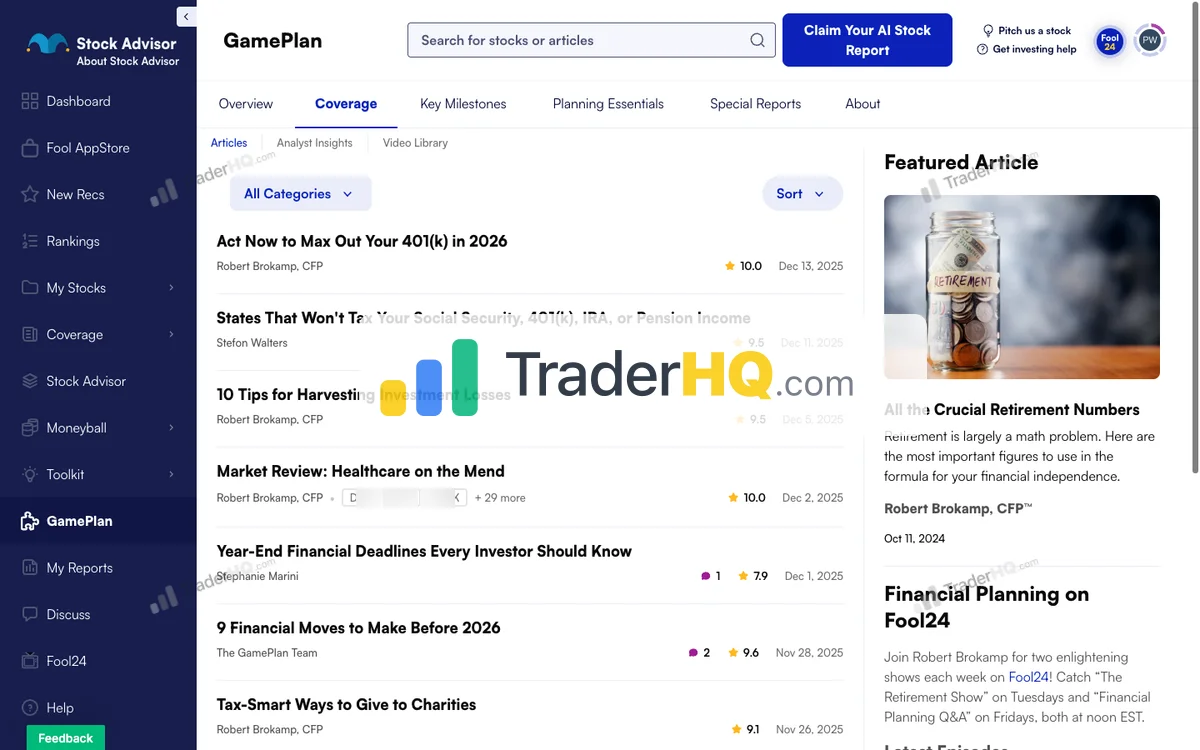
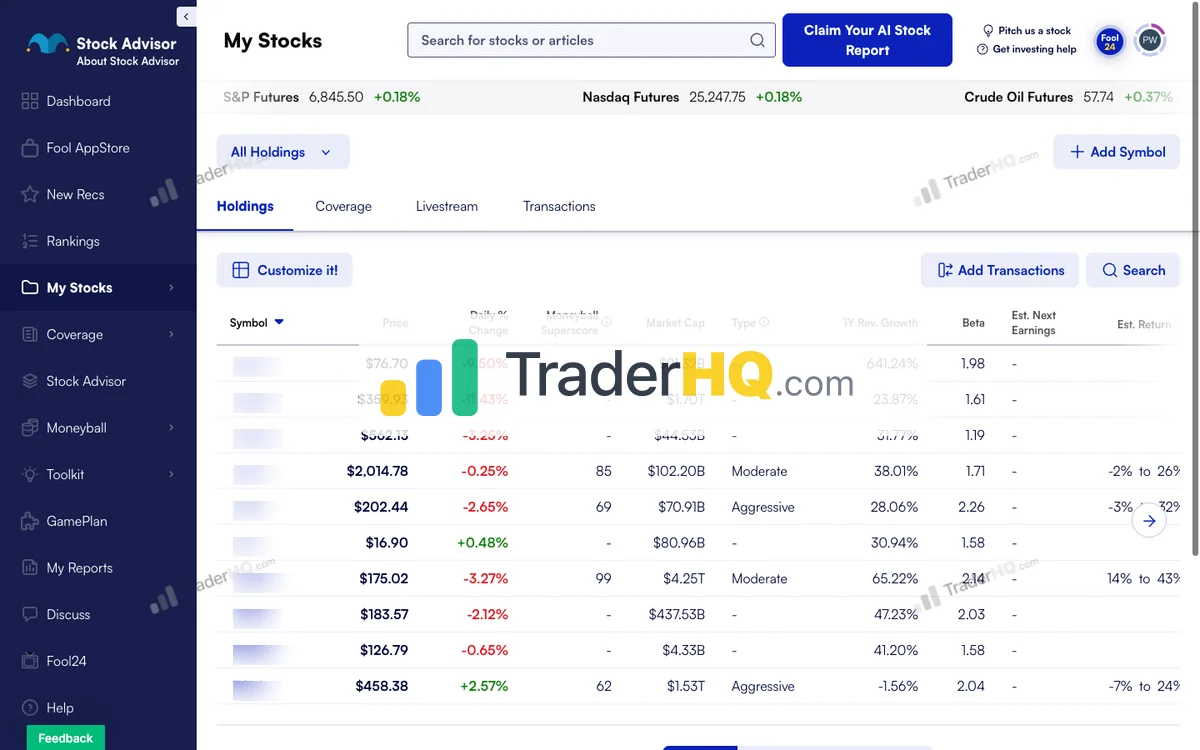
9 screenshots · Click to expand
The philosophy is straightforward: find companies with durable competitive advantages, buy them, and hold for years while the market catches up to their value.
The Numbers
Since February 2002, Stock Advisor picks have returned +978.9% (TraderHQ analysis, data as of Aug 31, 2026) compared to the S&P 500’s +214% measured as the average per-position holding-period return. That’s +764.9 percentage points of alpha over more than two decades.
The Fool’s own official scorecard showed +969% (vs S&P +215%) as of Aug 18, 2026 — we treat the two as separate sources and never mix them in one number.
Put another way: $10,000 invested following all picks equally since inception would be worth approximately $107,886 today (10.8x). The same amount against the per-position S&P 500 benchmark would be around $31,400.
The track record is exceptional for patient investors: 66% overall win rate across 526 positions, with picks held 3+ years averaging +1,518.5% at a 69.9% win rate. They’ve generated 46 ten-baggers and 191 doublers—the asymmetric wins that make long-term holding worthwhile.
But the typical (median) pick returned 42.4%. The headline is tail-driven, carried by NVDA, NFLX, AMZN, BKNG, and TSLA, and only accessible to subscribers who let winners run.
And those numbers hide real volatility. Stock Advisor’s portfolio dropped 40%+ in 2022 while the S&P fell 18%. Their biggest winners—Netflix, Amazon, Nvidia—have all seen 50%+ drawdowns at various points. The strategy works if you can hold through the pain.
Why It Works
Stock Advisor is analyst-driven and narrative-heavy. Andy Cross leads the investment team (David Gardner stepped back in May 2021), and each recommendation comes with a detailed thesis explaining why this company can compound for decades.
That narrative is what gives you conviction to hold when prices drop 40%.
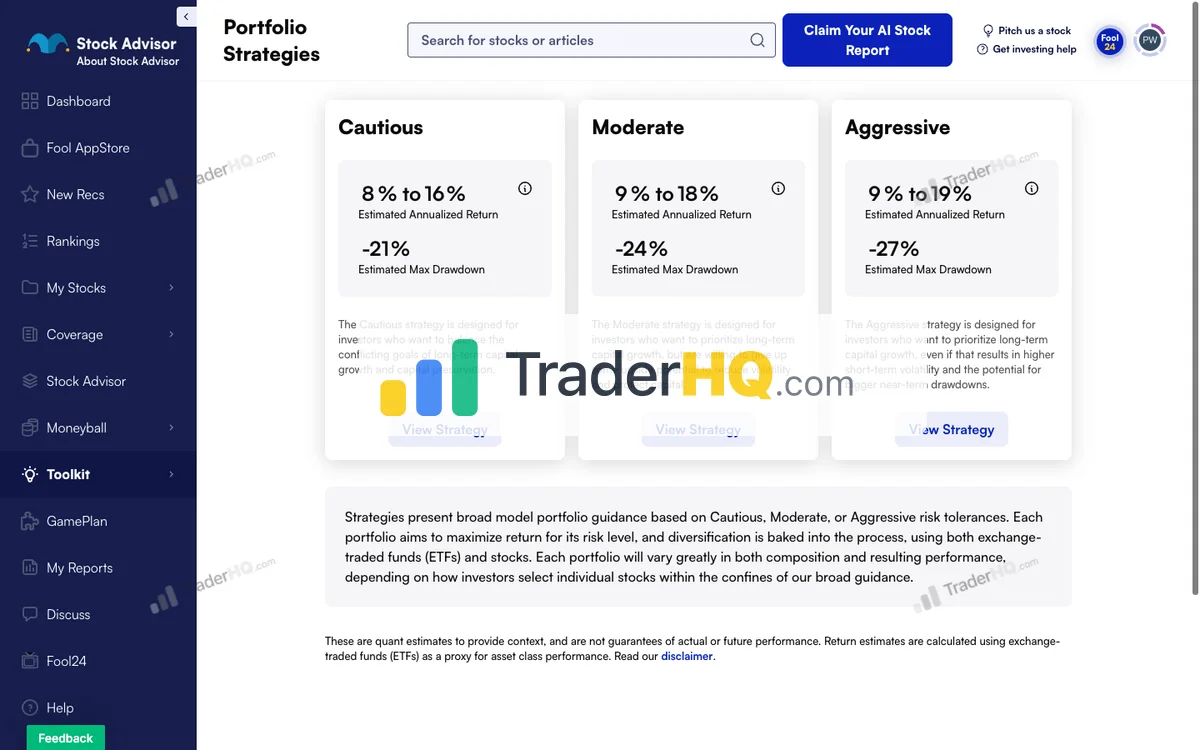
You also get three portfolio strategies calibrated to different risk tolerances (Cautious, Moderate, Aggressive), a Foundational Stocks list of their 10 highest-conviction holdings, and the Moneyball database with 344 companies scored across 12 dimensions for independent research.
This isn’t just stock tips—it’s a complete framework for building wealth.
For the complete breakdown of features, pricing, and performance, see our Stock Advisor review.
Best For
Patient investors with 5+ year horizons, $25,000+ portfolios, and the stomach for volatility. If you need hand-holding during crashes or want quick trades, this will frustrate you.
The Catch
Relentless upsell pressure. Expect emails pushing Epic, Epic Plus, and other premium tiers. The service itself is excellent—the marketing is aggressive.
Try Stock Advisor — 30-Day Guarantee
Alpha Picks: The Pure Quant Approach
Alpha Picks by Seeking Alpha represents something genuinely different: a pure quant system with no human discretion. The algorithm selects stocks based on five factors (Value, Growth, Profitability, Momentum, EPS Revisions), and analysts can’t override it.

Alpha Picks by Seeking Alpha Performance
Seeking Alpha · 104 picks · 4 years · Updated 2026-09-01
| AP Return | S&P 500 | Alpha | Win Rate |
|---|---|---|---|
| +348% | +104% | +244% | 66% |
S&P 500 shows what you'd have earned buying the index on each pick date instead. Same timing, fair comparison.
| AP Multi-Baggers | 10x+ | 5x+ | 3x+ | 2x+ |
|---|---|---|---|---|
| Count | 1 | 4 | 12 | 19 |
| AP Asymmetry | Avg Winner | Avg Loser | Ratio |
|---|---|---|---|
| Return | +122% | -22% | ~6:1 |
Best Performers (All-Time)
| AP Pick | Return |
|---|---|
**** Thermal Management | +348% |
**** Memory Chips | +403% |
**** Casual Dining | +346% |
**** Power Plant Construction | +357% |
**** Homebuilder | +228% |
 POWL Powell Industries | +887% |
 CLS Celestica | +1.2K% |
 APP AppLovin | +1.6K% |
 STRL Sterling Construction | +653% |
 SMCI Super Micro Computer | +969% |
Latest Alpha Picks Picks
Tickers masked to protect subscriber value. Recent picks need 3-5+ years to demonstrate thesis.
| AP Pick | Return |
|---|---|
**** Memory Chips | +403% |
**** Circuit Board Manufacturing | +102% |
**** Growth Company | +75% |
**** Growth Company | +74% |
**** Gold Mining | +44% |
**** Growth Company | +42% |
**** Growth Company | +26% |
**** Growth Company | +26% |
**** Connectivity Chips | +26% |
**** Growth Company | +11% |
Alpha Picks Win Rate by Holding Period
| Hold Time | AP Win Rate | Avg Return |
|---|---|---|
| < 1 Year | 47.6% | +10% |
| 1-3 Years | 77.6% | +95% |
| 3-5 Years | 100% | +437% |
| 5-10 Years | N/A% | N/A |
| 10+ Years | N/A% | N/A |
Alpha Picks Performance by Year
| Year | AP Picks | Avg Return | Win Rate | |
|---|---|---|---|---|
| 2026 | 16 | -6% | 38% | LITE+42% |
| 2025 | 24 | +59% | 75% | MU+403% |
| 2024 | 24 | +65% | 67% | EAT+346% |
| 2023 | 24 | +155% | 71% | CLS+997% |
| 2022 | 16 | +65% | 75% | MOD+348% |
Inside Alpha Picks
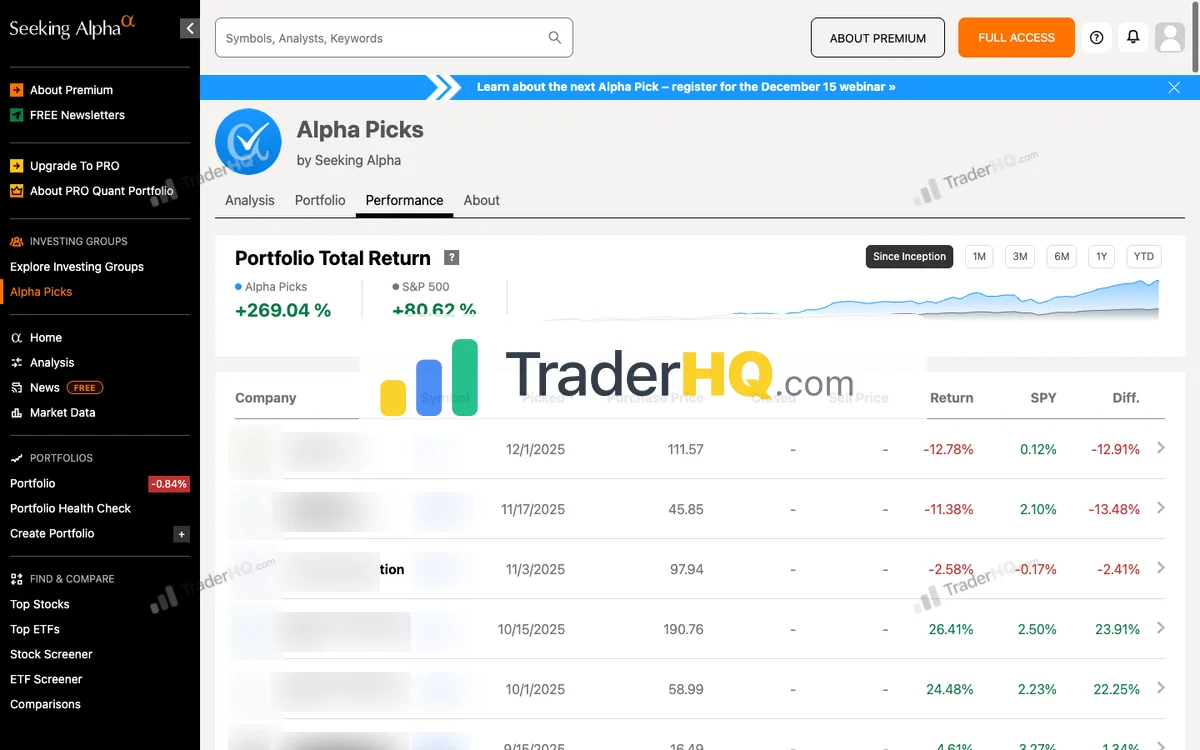
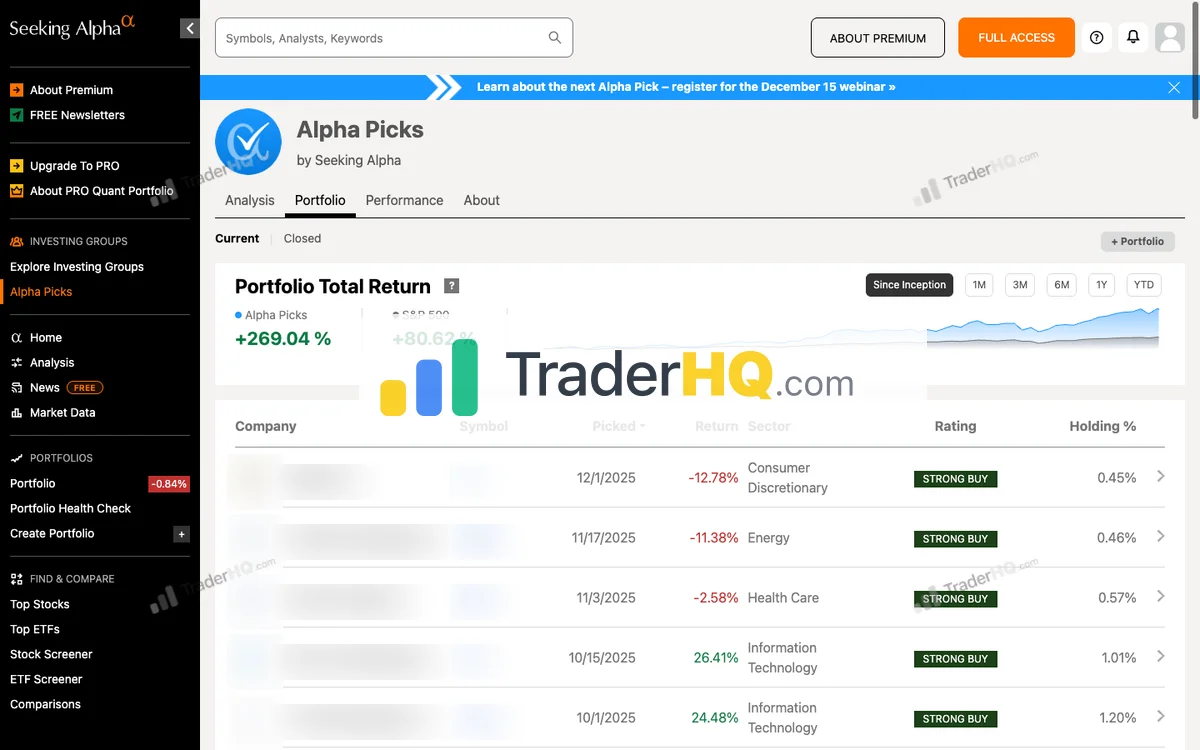
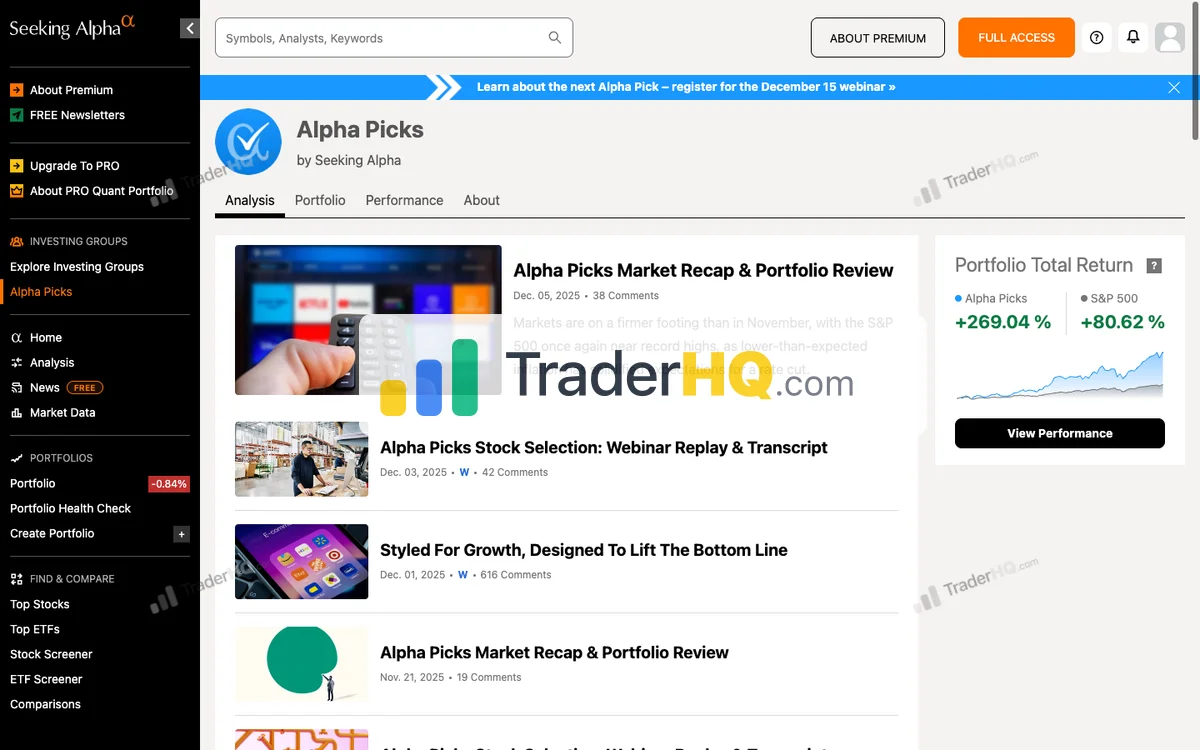
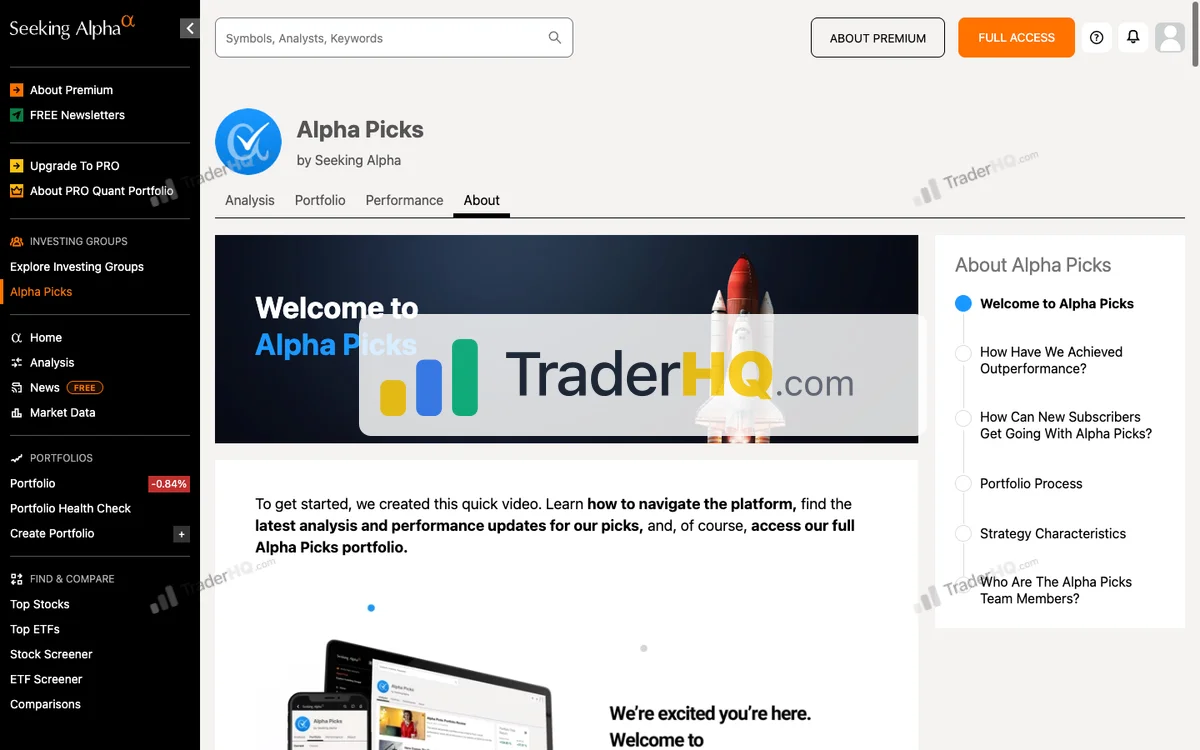

6 screenshots · Click to expand
Launched in July 2022, it’s newer—but its performance is impossible to ignore.
The Numbers
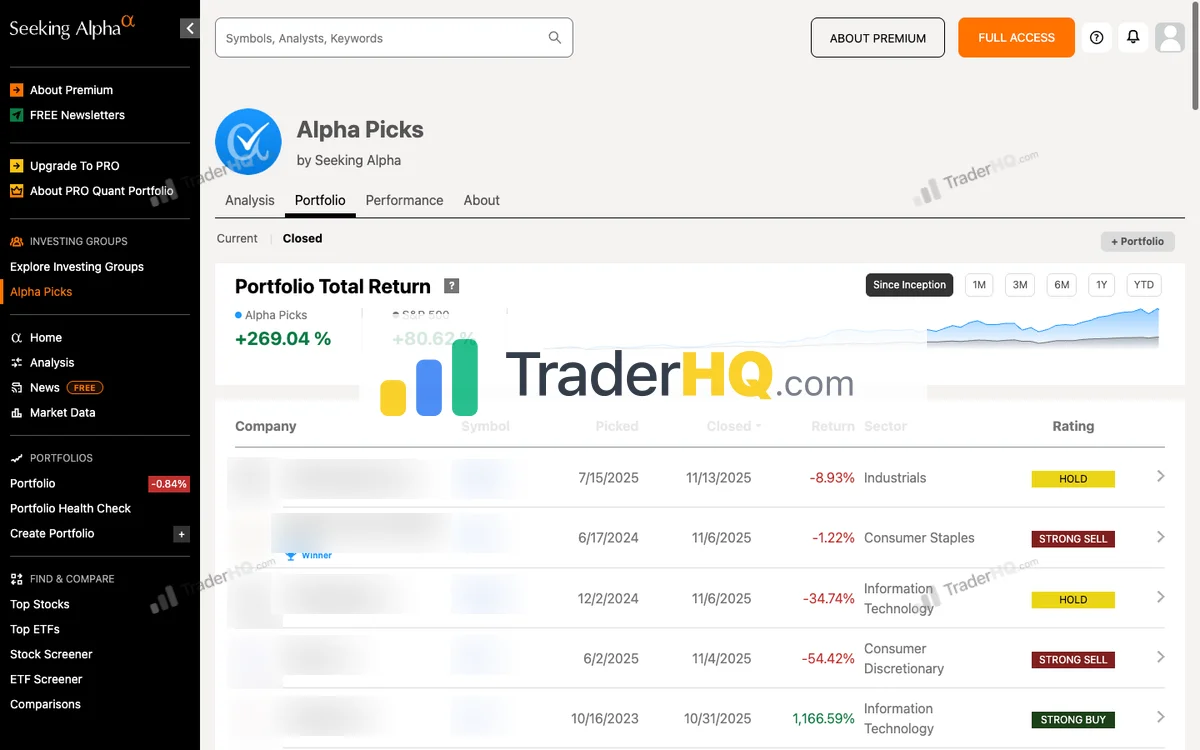
Since launch, Alpha Picks has returned +347.9% (TraderHQ analysis, data as of Sep 1, 2026) compared to the S&P 500’s +103.8% measured as the average per-position holding-period return. That’s +244.1 percentage points of alpha in 4.2 years — a 43.3% CAGR.
The transparency is exceptional. You can see all positions with every entry date, exit date, and return. Winners and losers displayed side by side. Nothing hidden.
Win rate: 66% overall across 104 positions. But here’s what matters for time horizon: positions held 1-3 years have a 77.6% win rate with a +94.5% average return, while picks under a year old sit near a coin flip.
This is Alpha Picks’ sweet spot—the data-driven approach excels in medium-term holds, and it punishes impatience. Time is the variable that separates mediocre from exceptional.
The concentration lesson: APP is Alpha Picks’ star performer at +1,571% (recommended Nov 2023, TraderHQ analysis, as of Sep 1, 2026)—and CLS doubled as a genuine ten-bagger from two separate recommendations (+996.7% on the 2023 entry). The same concentration that produces ten-baggers means one position can swing your year.
The 2026 vintage is the honest warning label: 16 picks averaging -6% with a 38% win rate so far—possibly just “too early to judge,” possibly edge eroding. The data can’t yet distinguish the two.
Why It Works
Alpha Picks removes human bias entirely. No analyst can fall in love with a stock or hold too long for emotional reasons. The algorithm buys when the numbers say buy and sells when the rating drops—systematic, unemotional, consistent.
Re-recommendations are particularly powerful. When the model picks a stock twice, returns increase significantly—re-recommended names average +251.2% vs +36.3% for single recommendations (TraderHQ analysis, as of Sep 1, 2026).
The Important Caveat
With only 4.2 years of track record, Alpha Picks hasn’t been tested through a full market cycle. It launched near the 2022 bottom and has operated primarily in recovery and bull market conditions. We recommend treating its ratings for 5+ year horizons with appropriate skepticism until more data accumulates. For 1-3 year investment horizons, the data is more robust.
Best For
Data-driven investors who trust algorithms over human opinion, can commit to 1-3+ year holds, have capital to deploy across 51 active positions, and want diversification beyond mega-cap tech.
The Catch
It’s a black box. You know the five factors conceptually, but specific weightings are proprietary. If you need to understand why you own something, this will frustrate you.
No refund policy either. You’re committing to a full year at $449 with no way out.
For the full analysis of Alpha Picks’ methodology and performance, read our Alpha Picks review.
The Real Differences That Matter
Forget the feature checklists. Here are the three differences that should drive your decision:
1. Human Judgment vs Pure Algorithm
Stock Advisor’s picks come from experienced analysts who can weigh qualitative factors—management quality, competitive dynamics, industry shifts—that don’t fit neatly into quantitative models.
Alpha Picks trusts the numbers exclusively. No human can override the algorithm, for better or worse.
The question: Do you believe the best investments require human insight, or that human bias is the enemy of returns?
2. Track Record Length and Time Horizon
Stock Advisor has survived multiple market cycles. The 2008 crash. The 2020 pandemic. The 2022 growth stock massacre. We know how their picks perform when everything falls apart.
For investors with 5+ year horizons, this matters enormously—Stock Advisor’s 3+ year holds average +1,518.5% at a 69.9% win rate (TraderHQ analysis, as of Aug 31, 2026), and its edge compounds with patience.
Alpha Picks launched in July 2022—near the market bottom. Its 4.2-year track record exists primarily in recovery and bull market conditions. We don’t know how the algorithm performs in a prolonged bear market.
The question: Is 4.2 years of exceptional performance enough proof for your time horizon? For 1-3 year investments, Alpha Picks’ data is increasingly robust (77.6% win rate in that window). For 5+ year investments, Stock Advisor’s multi-cycle track record provides more confidence.
3. Investor Development
Stock Advisor teaches you why to own companies. The detailed theses, the Moneyball database, the portfolio strategies—these build your capability as an investor. After a few years, you’re better at analyzing companies yourself.
Alpha Picks just tells you what to buy. You follow the algorithm, capture the returns, but learn nothing about investing. You’re dependent on the service forever.
The question: Do you want to become a better investor, or just get better returns?
How to Decide: Time Horizon Is Everything
Choose Stock Advisor if:
- You’re investing for 5+ years and won’t touch the money
- You want the time-compounded edge that comes with patience (3+ year holds average +1,518.5%, TraderHQ analysis, as of Aug 31, 2026)
- You have $25,000+ to allocate (the fee becomes trivial relative to returns)
- You want a proven track record across multiple market cycles (24.5 years, 526 positions)
- You value understanding why you own something (46 ten-baggers didn’t happen by accident)
- You want a money-back guarantee to test it risk-free
- You want to avoid single-pick concentration risk: a third of all picks still lose, but 191 have doubled
Choose Alpha Picks if:
- You’re targeting 1-3 year investment horizons (where Alpha Picks’ 77.6% win rate shines)
- You trust algorithms over human judgment
- You want pure quant diversification beyond your core holdings
- You’re comfortable with a black-box methodology
- You don’t need to understand the “why” behind each pick
- You acknowledge the shorter track record (4.2 years, 104 positions) and its limitations for longer-term projections — including a 2026 vintage currently averaging -6%
Either works if:
- You’ll actually follow the recommendations (the biggest variable is you, not the service)
- You understand that roughly a third of picks from any service will lose money
- You’re adding this as one input to your process, not your entire strategy
The tiebreaker: Ask yourself, “Would I hold through a 40% drop?” If yes, Stock Advisor’s volatility won’t bother you. If that makes you queasy, Alpha Picks’ shorter holds and systematic exits might suit you better.
Try Stock Advisor — 30-Day Guarantee
Can You Use Both?
Yes—and they’re actually complementary.
Stock Advisor for your core long-term holdings. The analyst-driven picks with detailed theses give you conviction to hold for decades. These are the compounders you build wealth on.
Alpha Picks for quant-driven diversification. The algorithm finds opportunities human analysts might miss, and the systematic exits remove emotional decision-making.
The methodologies are different enough that you’re not just doubling up on the same stocks. Stock Advisor leans toward growth narratives; Alpha Picks follows the numbers wherever they lead.
If you have the budget for both ($548/year combined), this is a legitimate strategy. Start with Stock Advisor if you can only pick one.
The Bottom Line
Stock Advisor wins for most investors—especially those with 5+ year horizons.
The evidence: a 24.5-year track record (+978.9% per TraderHQ analysis vs S&P +214% per-position benchmark, as of Aug 31, 2026; +969% per the Fool’s official scorecard, Aug 18, 2026), a 66% win rate, a median pick at +42.4%, a promo price 4.5x lower, a money-back guarantee, and genuine educational value.
When you’re building wealth over decades, 24.5 years of proof across multiple market cycles provides confidence that 4.2 years of data simply cannot match.
But Alpha Picks is a compelling complement, not a competitor. Its +347.9% total return (TraderHQ analysis, as of Sep 1, 2026) across 104 positions and its 43.3% CAGR speak for themselves.
Alpha Picks is the smarter choice if you’re targeting 1-3 year investment windows, want pure quant with no human bias, and don’t care about understanding the methodology. The 77.6% win rate in that holding period is compelling, and the +347.9% return with a 66% overall win rate demonstrates the algorithm works.
Just understand you’re betting on a shorter track record with no refund if it doesn’t work for you — and a 2026 vintage currently underwater (-6% average).
The time horizon matters more than you think. Stock Advisor’s edge grows with patience (66% overall, 69.9% at 3+ years). Alpha Picks’ edge is concentrated in medium-term holds (66% overall, 77.6% at 1-3 years). Match the service to your actual investment timeline.
If I had to pick one for a friend who’s never subscribed to a stock-picking service? Stock Advisor, because the training wheels of a 24-year track record make it easier to trust the process when it hurts.
Explore all your options in our guide to the best stock advisors. You can also compare Stock Advisor against Seeking Alpha Premium, IBD Leaderboard, or Rule Breakers.
Try Stock Advisor — 30-Day Guarantee
Frequently Asked Questions
Stock Advisor vs Alpha Picks: which is better?
Stock Advisor is better for most investors, especially those with 5+ year horizons.
It has a 24.5-year track record (+978.9% vs S&P’s +214% per-position benchmark, TraderHQ analysis, as of Aug 31, 2026), a 66% win rate with a 42.4% median pick return, 46 ten-baggers across 526 positions, a promo price 4.5x lower ($99/year vs $449/year), a 30-day money-back guarantee, and it builds your capability as an investor.
Alpha Picks has a higher annualized return (+347.9% since July 2022, 43.3% CAGR, TraderHQ analysis, as of Sep 1, 2026) and a 66% win rate overall across 104 positions (77.6% for 1-3 year holds) — but only 4.2 years of data, no refund policy, and a 2026 vintage currently averaging -6%. Concentration and recency risk are real.
Is Stock Advisor worth it?
Yes, for long-term investors who can hold 5+ years.
At $99/year (promo, $199 list), Stock Advisor has returned +978.9% since 2002 (TraderHQ analysis, as of Aug 31, 2026) compared to the S&P 500’s +214% per-position benchmark. The 66% overall win rate includes 46 ten-baggers and 191 doublers across 526 positions, and picks held 3+ years averaged +1,518.5%.
The math works if you follow the strategy—but expect 30-50% drawdowns on individual positions, and the median pick returned a more modest 42.4%. Patience is mandatory. See our full Stock Advisor analysis for detailed performance metrics.
Is Alpha Picks worth it?
Yes, for data-driven investors targeting 1-3 year holds.
At $449/year (promo, $499 list) with no refund, it’s a bigger commitment—but +347.9% returns since July 2022 (vs S&P’s +103.8% per-position benchmark, TraderHQ analysis, as of Sep 1, 2026) and a 66% overall win rate across 104 positions (77.6% for 1-3 year holds) are hard to argue with.
The caveats: the 2026 vintage averages -6% so far, and with only 4.2 years of track record—for 5+ year horizons, the data is less conclusive. Check our Alpha Picks deep dive for the complete performance breakdown.
Can I use both Stock Advisor and Alpha Picks?
Yes, and they complement each other well.
Stock Advisor provides analyst-driven picks with detailed theses for core long-term holdings. Alpha Picks adds quant-driven diversification with systematic exits. The methodologies are different enough that you’re not just doubling up on the same stocks. Combined cost is $548/year.
Which service has better returns?
It depends on timeframe and time horizon.
Stock Advisor has returned +978.9% since 2002 (24.5 years, 10.2% CAGR) with 46 ten-baggers across 526 positions (TraderHQ analysis, as of Aug 31, 2026). Alpha Picks has returned +347.9% since July 2022 (4.2 years, 43.3% CAGR) across 104 positions (TraderHQ analysis, as of Sep 1, 2026).
Alpha Picks’ annualized returns are far higher, but Stock Advisor’s track record spans multiple market cycles including the 2008 crash and 2022 bear market. Concentration cuts both ways: APP (+1,571%) powers Alpha Picks’ headline, just as NVDA (+133,425% on its 2005 recommendation) powers Stock Advisor’s.
For 5+ year horizons, Stock Advisor’s through-cycle record is more relevant. For 1-3 year horizons, Alpha Picks’ 77.6% win rate is compelling.
Which is better in 2026’s market: Stock Advisor or Alpha Picks?
Both fit 2026’s market, but for different reasons.
Stock Advisor’s GARP quality approach has navigated every kind of regime—dot-com bust, financial crisis, pandemic, 2022 bear market. Its record shows bear-market vintages historically matching or beating bull-market vintages on win rate, so elevated index levels are a poor reason to skip it. Its 978.9% total return and 46 ten-baggers (TraderHQ analysis, as of Aug 31, 2026) prove through-cycle conviction works.
Alpha Picks’ quant factors capture rotation mechanically—its 347.9% total return and 66% win rate across 104 positions (TraderHQ analysis, as of Sep 1, 2026) show the algorithm adapts, and its 2022 bear-market picks won 82% of the time.
The honest 2026 warning: Alpha Picks’ newest vintage is averaging -6%, and Stock Advisor’s recent vintages have been modest too—both are normal for young picks, but neither service’s edge is guaranteed to persist. The key difference: Stock Advisor has been tested through prolonged downturns at scale. Alpha Picks hasn’t.
Can I use both Stock Advisor and Alpha Picks together?
Yes — and they’re genuinely complementary.
Stock Advisor provides analyst-driven conviction picks with detailed theses for core long-term holdings (5+ years). Alpha Picks adds quant-driven diversification with systematic entries and exits for medium-term holds (1-3 years).
The methodologies are different enough that you’re not doubling up on the same stocks—Stock Advisor leans toward growth narratives; Alpha Picks follows the factor signals wherever they lead. Having both a conviction-based and a factor-based approach captures different segments of the opportunity set.
Combined cost is $548/year at promo prices — reasonable if you’re deploying $50K+ across both strategies.
What’s the main difference between Stock Advisor and Alpha Picks?
Human judgment vs pure algorithm.
Stock Advisor’s picks come from experienced analysts who write detailed theses explaining why each company can compound for decades. Alpha Picks uses a quantitative model based on five factors with no human discretion—the algorithm decides everything.
Choose based on whether you trust human insight or prefer removing human bias.