

You’re staring at two Motley Fool options and doing the math in your head: $99 for 2 picks a month, or $299 for 5 picks a month. Triple the price for 2.5x the picks. Is that worth it?
Here’s the straight answer: Stock Advisor is the better choice for most investors. Epic only makes sense if you have $50,000+ to deploy and specifically want access to Hidden Gems’ small-cap picks. Otherwise, you’re paying $200 more for complexity you don’t need.
Why This Decision Matters Now (September 2026): This comes down to experience vs. volume — Stock Advisor’s proven 24.5-year track record (978.9% total returns) versus Epic’s broader approach with more frequent picks across four strategies.
The S&P 500 closed August at 7,686, up 13.1% year-to-date on a total-return basis (Slickcharts, Aug 31, 2026) — but the surface calm disguises violent rotation beneath. A 210-point gap separates the average top-20 S&P name (+168.7%) from the average bottom-20 (−41.6%), making this decisively a stock-picker’s market. SanDisk is up +560% and Western Digital +162% while the Trade Desk is down −63.9% and Intuit −45.8%. The VIX sits at 14.92, the Fed holds at 3.50–3.75% with hike odds near 65% for the September FOMC after Jackson Hole, and CAPE near 40 — highest since 2000 — compresses forward index returns and makes alpha essential.
Stock Advisor rates EXCEPTIONAL — its 46 ten-baggers, 66% win rate, and 24.5-year track record shine when 210-point dispersion makes quality GARP the dominant strategy. Epic rates GOOD — Hidden Gems adds diversification across market caps, and the bundle’s same core DNA as Stock Advisor fits a market where multi-year holds are the return driver. The key question: does Epic’s multi-strategy diversification justify the $200 premium, or does Stock Advisor’s proven foundation provide enough exposure to capture this opportunity?
Let me show you exactly why—and when Epic actually becomes the smarter move.
Quick Comparison: Motley Fool Stock Advisor vs Epic
| Dimension | Stock Advisor | Epic | Edge |
|---|---|---|---|
| Price (New Member) | $99/year | $299/year | Stock Advisor |
| Regular Price | $199/year | $499/year (currently $299) | Stock Advisor |
| Monthly Picks | 2 | 5 | Epic |
| Core Track Record | +978.9% since 2002 | Same (includes Stock Advisor) | Tie |
| Small-Cap Access | No | Yes (Hidden Gems) | Epic |
| Moneyball Database | 190+ companies | 340+ companies | Epic |
| Simplicity | Very simple | More to manage | Stock Advisor |
| Target Portfolio | $25,000+ | $50,000+ | Depends on you |
| Overall Winner | — | — | Stock Advisor (for most) |
The table tells the story: Epic includes everything in Stock Advisor plus three additional services. But “more” isn’t automatically “better”—especially when the flagship track record is identical.
For the complete breakdown, see our Stock Advisor review.
Motley Fool Stock Advisor: The Foundation That Actually Matters
Motley Fool Stock Advisor is the original Motley Fool subscription—the one that built their reputation and the one that still drives most of the returns.

Motley Fool Stock Advisor Performance
The Motley Fool · 526 picks · 25 years · Updated Aug 31, 2026
| SA Return | S&P 500 | Alpha | Win Rate |
|---|---|---|---|
| +979% | +214% | +765% | 66% |
S&P 500 shows what you'd have earned buying the index on each pick date instead. Same timing, fair comparison.
| SA Multi-Baggers | 10x+ | 5x+ | 3x+ | 2x+ |
|---|---|---|---|---|
| Count | 46 | 91 | 128 | 191 |
| SA Asymmetry | Avg Winner | Avg Loser | Ratio |
|---|---|---|---|
| Return | +1.7K% | -44% | ~38:1 |
Best Performers (All-Time)
| SA Pick | Return |
|---|---|
 BKNG Booking Holdings | +22K% |
 MME.DL MME.DL | +4.3K% |
 NFLX Netflix | +44K% |
 AMZN Amazon | +35K% |
 AAPL Apple | +6.5K% |
 NVDA NVIDIA | +133K% |
 TSLA Tesla | +16K% |
 CTAS CTAS | +4.6K% |
 SHOP Shopify | +4.6K% |
 DIS Disney | +6.1K% |
The multi-bagger pipeline. 191 doublers → 91 5-baggers → 46 10-baggers. About 24% of doublers become 10-baggers with enough time.
See All Stock Advisor Recommendations →Latest Stock Advisor Picks
Tickers masked to protect subscriber value. Recent picks need 3-5+ years to demonstrate thesis.
| SA Pick | Return |
|---|---|
**** Cloud Monitoring | +97% |
**** Chip Manufacturer | +85% |
**** Infrastructure Construction | +63% |
**** Growth Company | +51% |
**** Growth Company | +41% |
**** E-commerce & Cloud Giant | +28% |
**** Growth Company | +23% |
**** Convenience Stores | +19% |
**** Growth Company | +18% |
**** Growth Company | +16% |
Early results mislead. < 1 year: 57.1% win rate. 10+ years: 92.2%. That 35-point gap explains why judging picks early leads to selling future winners.
Stock Advisor Win Rate by Holding Period
| Hold Time | SA Win Rate | Avg Return |
|---|---|---|
| < 1 Year | 57.1% | +16% |
| 1-3 Years | 55.7% | +11% |
| 3-5 Years | 48.8% | +23% |
| 5-10 Years | 62.9% | +206% |
| 10+ Years | 92.2% | +4.1K% |
526 data points over 25 years. The pattern repeats: early volatility, mid-term clarity, long-term outperformance. The data is the strategy.
Stock Advisor Performance by Year
| Year | SA Picks | Avg Return | Win Rate | |
|---|---|---|---|---|
| 2026 | 31 | +10% | 57% | DDOG+97% |
| 2025 | 26 | +7% | 48% | ASML+133% |
| 2024 | 25 | +25% | 67% | AMD+186% |
| 2023 | 25 | +78% | 73% | CRWD+607% |
| 2022 | 23 | +58% | 59% | NET+495% |
| 2021 | 22 | -13% | 32% | LRCX+491% |
| 2020 | 24 | +146% | 46% | TSLA+1.1K% |
| 2019 | 23 | +56% | 70% | SNPS+259% |
| 2018 | 19 | +228% | 68% | SHOP+1.1K% |
| 2017 | 22 | +700% | 86% | NVDA+8.4K% |
| 2016 | 20 | +446% | 80% | SHOP+4.6K% |
| 2015 | 22 | +208% | 68% | CASY+839% |
| 2014 | 20 | +354% | 80% | ATVI+2.8K% |
| 2013 | 17 | +386% | 65% | NFLX+2.5K% |
| 2012 | 23 | +1.2K% | 74% | TSLA+16K% |
| 2011 | 19 | +561% | 63% | AAPL+3.2K% |
| 2010 | 18 | +459% | 83% | AMZN+2.9K% |
| 2009 | 20 | +3.3K% | 90% | NVDA+56K% |
| 2008 | 18 | +1.2K% | 89% | AAPL+6.5K% |
| 2007 | 19 | +1.5K% | 37% | NFLX+29K% |
| 2006 | 20 | +2.5K% | 65% | NFLX+25K% |
| 2005 | 16 | +8.4K% | 63% | NVDA+133K% |
| 2004 | 17 | +6.0K% | 59% | NFLX+44K% |
| 2003 | 17 | +229% | 65% | PHIN+1.4K% |
| 2002 | 16 | +3.2K% | 81% | AMZN+35K% |
Inside Stock Advisor
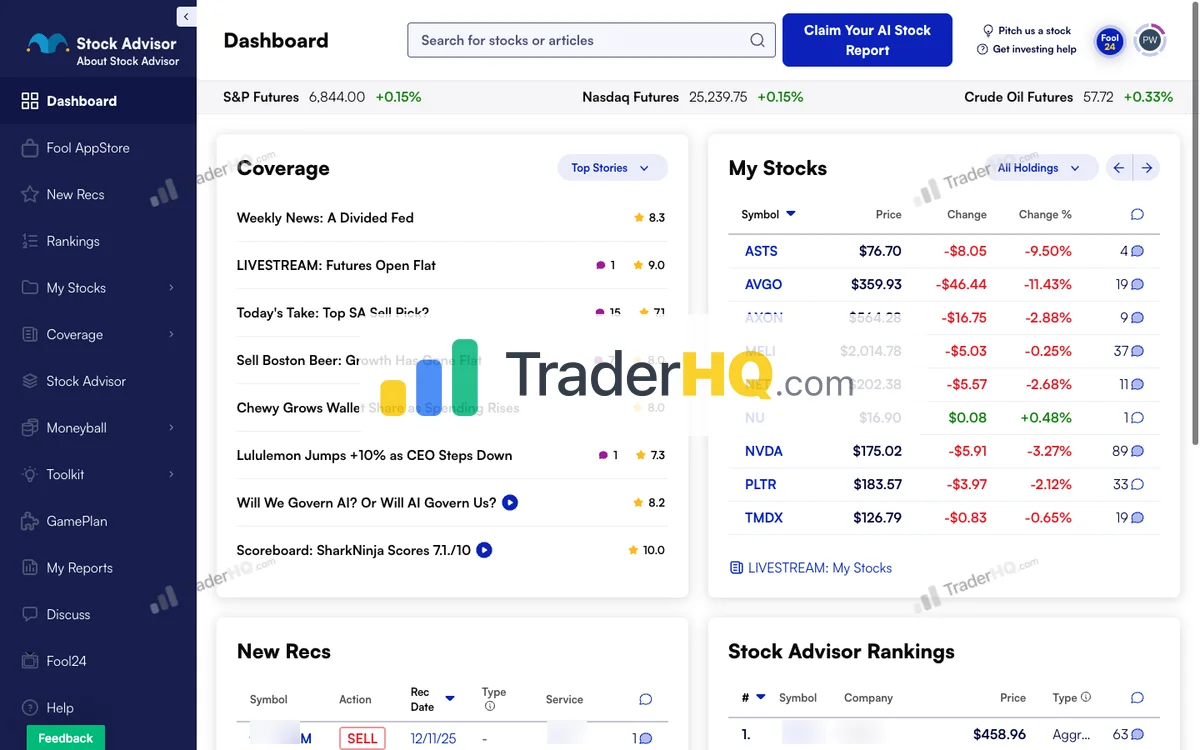
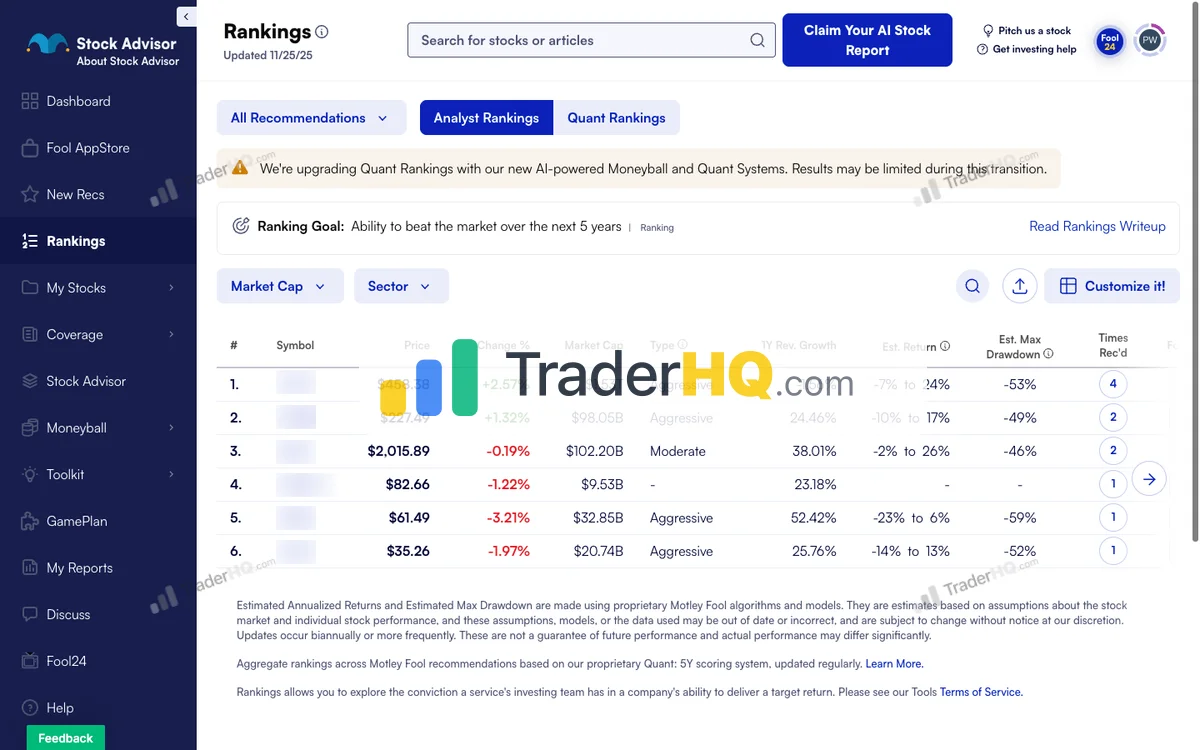
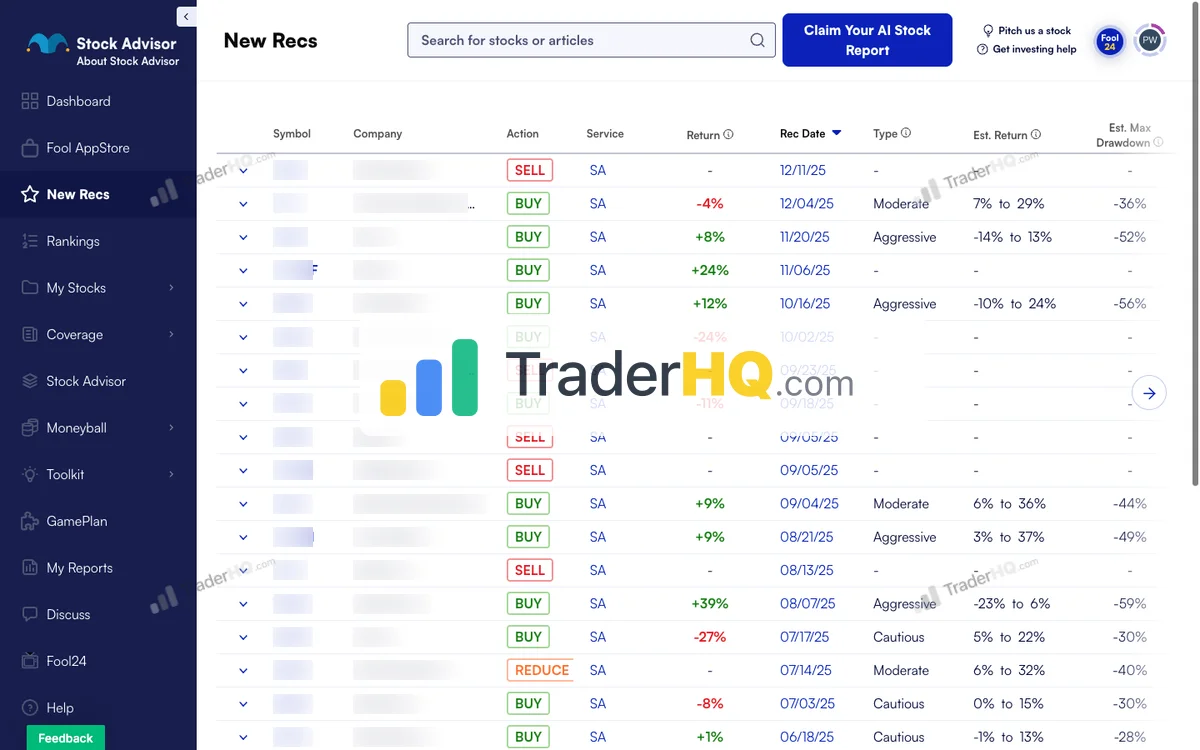
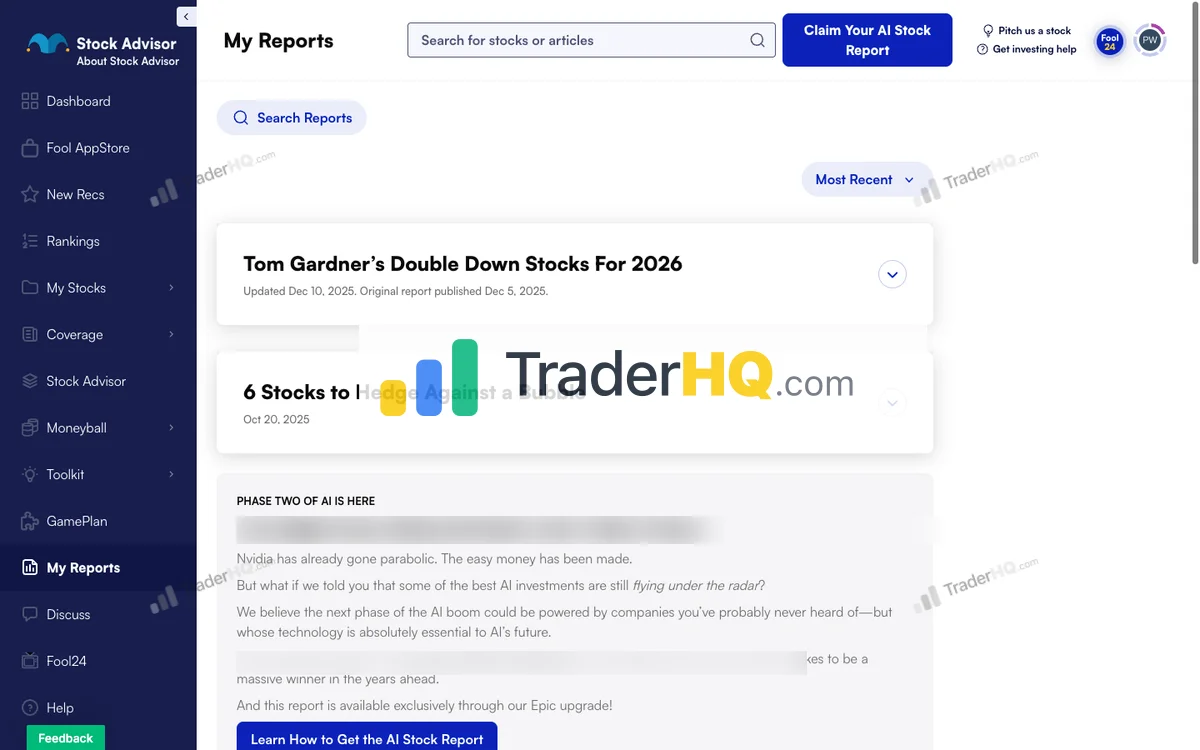
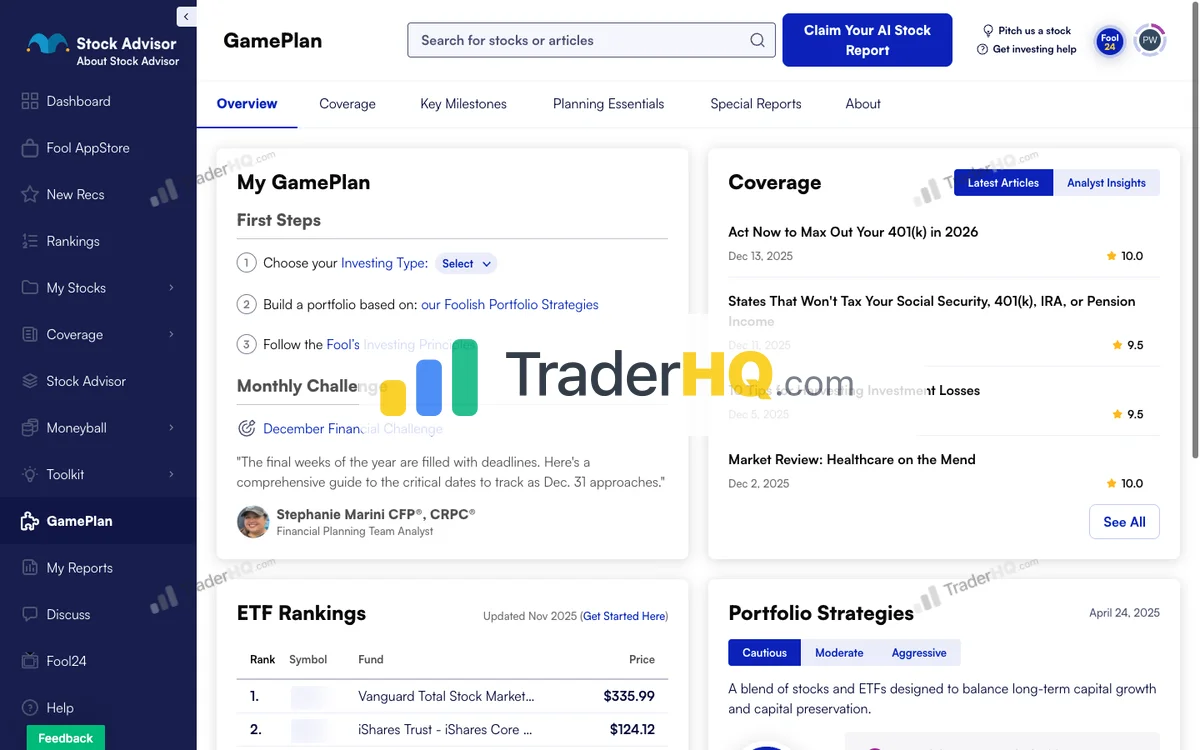
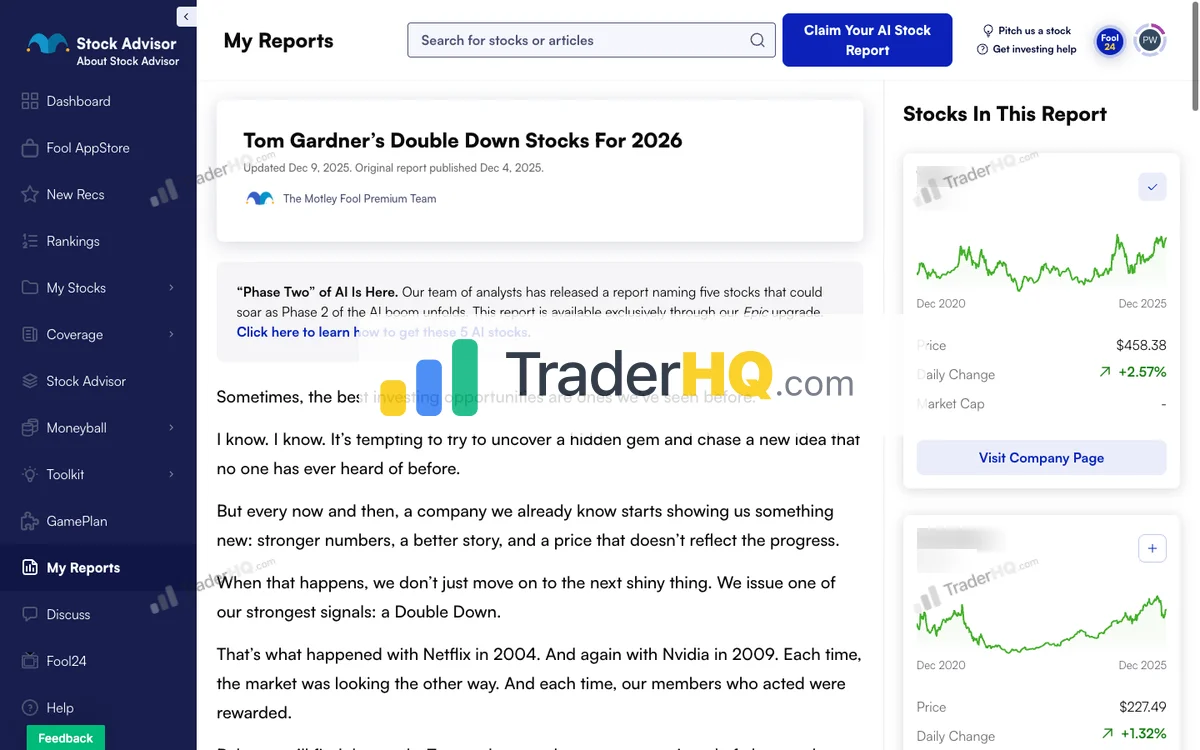
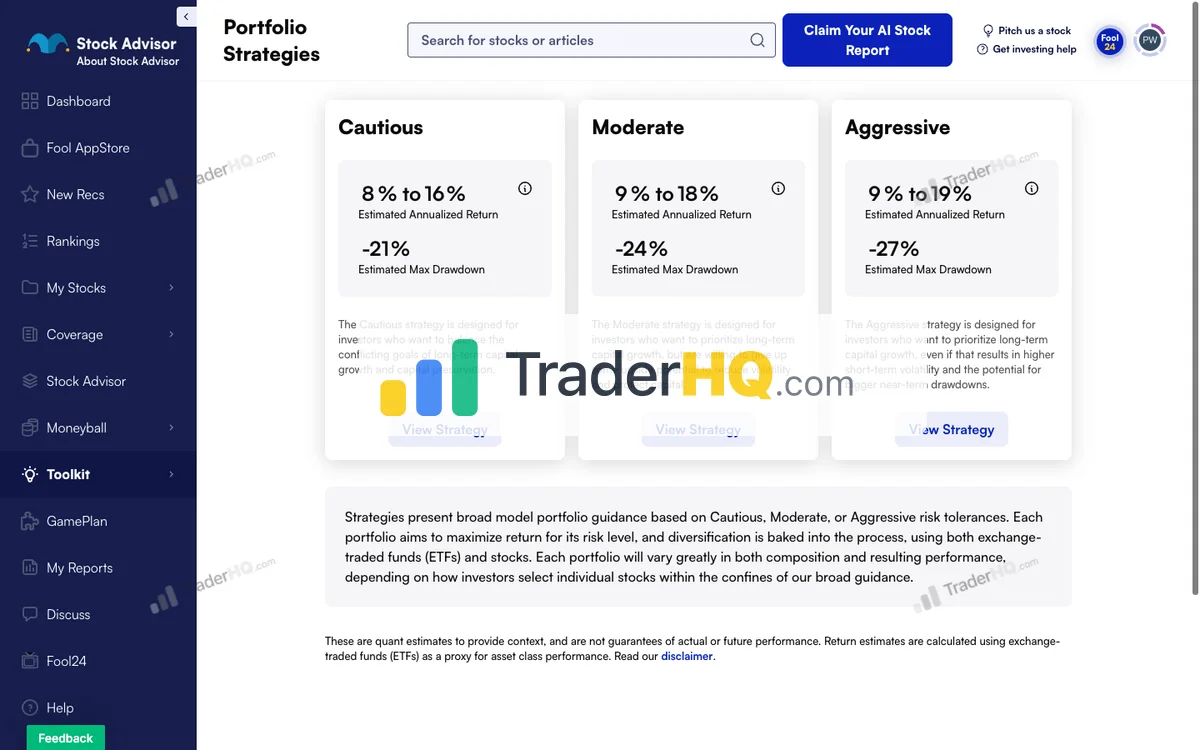
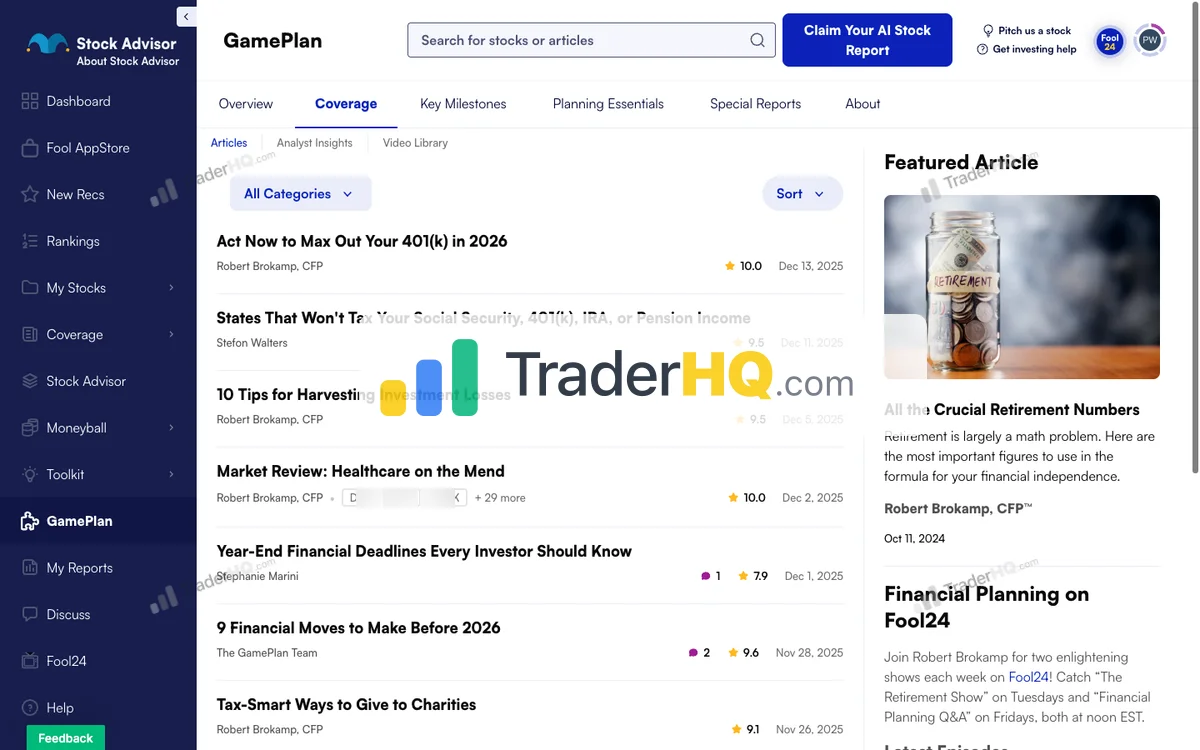
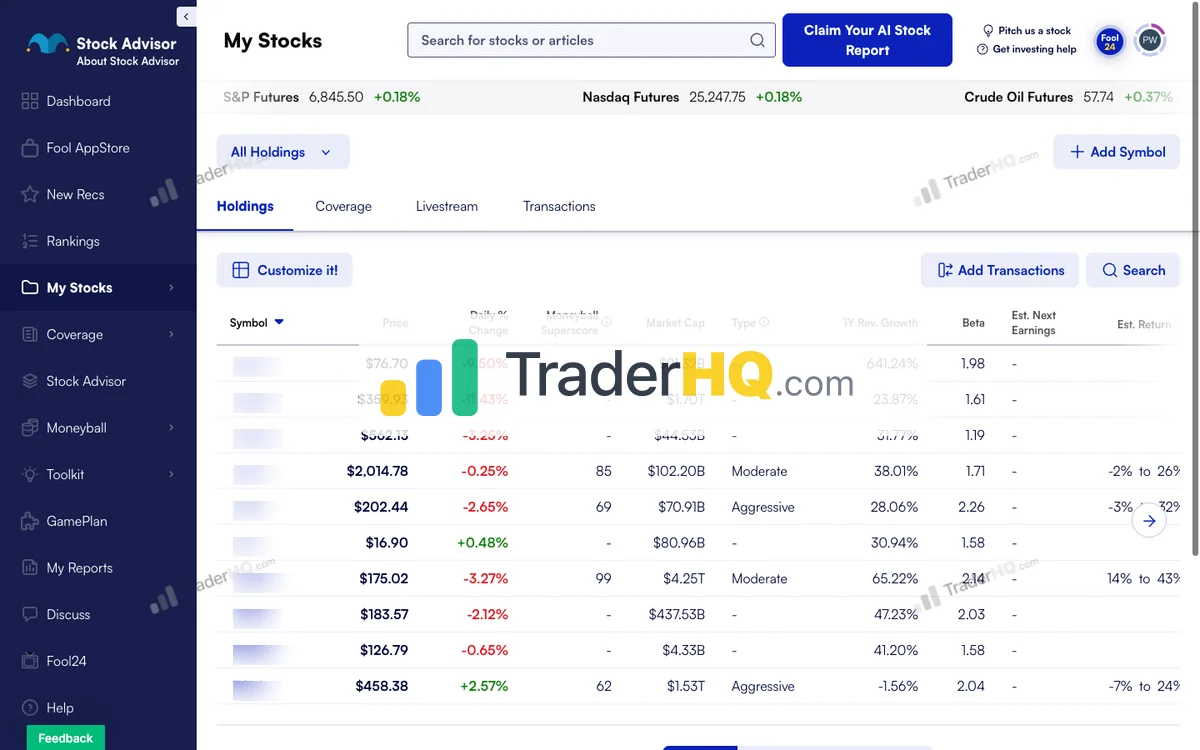
9 screenshots · Click to expand
The Philosophy: Find companies with durable competitive advantages, buy them, and hold for 5+ years while the market catches up to their value. Two picks per month. No noise, no complexity.
The Numbers: Since 2002, Stock Advisor picks have returned +978.9% compared to the S&P 500’s +214% (per-position holding-period average). That’s not a typo. $10,000 invested following their methodology would be worth roughly $107,886 today (TraderHQ analysis of the published trade log, data as of Aug 31, 2026). The same amount in the per-position index benchmark? About $31,400.
How We Did the Math (and where our data has gaps): We computed these figures from the publisher’s published trade log of 526 positions using recommendation-date closing prices, benchmarked against the S&P 500’s average return over each pick’s individual holding period. This is official-computed analysis of the publisher’s own published record — not a third-party audit. Known gaps: 4 positions lack entry dates, 23 have no computed return, and sector data covers only 4% of the book. The record is tail-driven: the median pick returned +42.4%, and even removing the top 5% of picks, the average is still +160.8%.
A service’s published record belongs to the picks; your record belongs to your entries, your exits, and your temperament. The distance between those two numbers is where almost all subscriber disappointment lives.
The texture behind the aggregates: NVDA, recommended April 2005, is up +133,425% after 21.5 years. NFLX (Dec 2004) is up +43,971%. On the other side, KLAR (Oct 2025) is down −65%, and SIVB.Q (2016) lost −99.3%. Winners and losers, named and dated — that’s the whole book (TraderHQ analysis of the published trade log, data as of Aug 31, 2026).
September 2026 Context: Stock Advisor’s 24.5-year track record is proving its worth in a market that punishes passivity. The S&P 500 closed August at 7,686 (+13.1% YTD total return), but 210-point dispersion means disciplined stock selection is everything — the average top-20 stock is up +168.7% while the average bottom-20 is down −41.6% (Slickcharts, Aug 31, 2026). The rotation is stark: SanDisk +560%, Micron +236%, and cybersecurity names like Fortinet +115% lead, while ad-tech (Trade Desk −63.9%) and enterprise software (Intuit −45.8%) bleed. The VIX sits at 14.92, manufacturing PMI at 55.6 signals strong expansion, but CPI at 3.4% and a ~65% probability of a September Fed hike keep the macro picture genuinely mixed. The Fed holds at 3.50–3.75% (core CPI 2.5%), and CAPE near 40 — highest since 2000 — caps index upside. Stock Advisor’s 66% overall win rate improves dramatically with patience — 92.2% for positions held 10+ years. They’ve generated 46 ten-baggers and 191 doublers across 526 positions through every crisis. That through-cycle proof matters most when a hike decision is the single biggest regime variable (TraderHQ analysis of the published trade log, data as of Aug 31, 2026).
But those numbers come with volatility. Stock Advisor’s portfolio dropped 40%+ in 2022 while the S&P fell 18%. Their biggest winners—Netflix, Amazon, Nvidia—have all seen 50%+ drawdowns at various points. The strategy works if you can hold through the pain.
What You Get:
- 2 new stock picks per month
- Foundational Stocks list (10 highest-conviction core holdings)
- Three portfolio strategies (Cautious, Moderate, Aggressive)
- Moneyball database with 190+ companies
- Quantitative projections for every recommendation
Best For: Investors with 5+ year horizons, portfolios of $25,000+, and the stomach for volatility. If you need hand-holding during crashes or want constant activity, this will frustrate you.
The Reality Check: About 66% of Stock Advisor picks are winners overall — improving to 92.2% for 10+ year holds (TraderHQ analysis of the published trade log, data as of Aug 31, 2026). Any winning number travels with its whole book: loser share, average loss, and the counting method — closed trades or open — stated in the same sentence. A highlight without its denominator is marketing, not evidence. Here it is: 34% of picks lose, the average loss is −44.5%, and the counting method includes open winners across all 526 positions. The strategy works because the winners dramatically outperform the losers — but only if you hold long enough to let them compound.
Epic: The Bundle That Adds Three Services
Motley Fool Epic is the next tier up—a bundle that includes Stock Advisor plus three additional services: Rule Breakers, Hidden Gems, and Dividend Investor.
No screenshots available for motley-fool-epic
The Philosophy: Same long-term holding approach as Stock Advisor, but with diversified exposure across growth, small-cap, and income strategies. Five picks per month instead of two.
What’s Actually Inside:
| Service | Focus | Track Record |
|---|---|---|
| Stock Advisor | Large-cap growth | +978.9% since 2002 |
| Rule Breakers | Aggressive growth | +312% since 2004 (official publisher scorecard, Aug 18, 2026) |
| Hidden Gems | Small/mid-cap | Per-scorecard track record not publicly disclosed |
| Dividend Investor | Income focus | Per-scorecard track record not publicly disclosed |
The Honest Assessment: Stock Advisor and Rule Breakers have significant overlap—both target growth companies, and many picks appear in both services. If you’re curious about Rule Breakers specifically, we break down the comparison in our Stock Advisor vs Rule Breakers analysis. The real differentiation in Epic is Hidden Gems, led by co-founder Tom Gardner, which focuses on under-the-radar small and mid-caps that larger services overlook.
Dividend Investor’s per-scorecard track record is not publicly disclosed, so we won’t quote one. Its role is income stability and defensive positioning — dividend stocks and REITs that balance the growth picks from the other three scorecards.
A note on Epic’s own numbers: Epic the bundle launched in 2020, but its marketed track record blends picks inherited from the older Motley Fool services going back to 2002. TraderHQ analysis of the published trade log (data as of Aug 18, 2026) shows the combined log at +969% across 711 positions — but 266 of those picks (37%) predate the bundle, and all 711 are still open, meaning every return is an unrealized mark. Even a perfect follower gets the returns of the year they started, not the lifetime average. Judge any long record by its starting cohorts — different start years effectively bought different products. The Epic-era vintages tell the honest story: a 40% win rate in 2021, and 11% average returns in both 2021 and 2025.
What You Get Beyond Stock Advisor:
- 3 additional picks per month (5 total)
- Hidden Gems small-cap access
- Full Fool IQ with Quant projections
- Expanded Moneyball database (340+ companies)
- GamePlan+ financial planning content
Best For: Investors with $50,000+ portfolios who want diversified exposure across multiple strategies and have the capital to deploy 5 picks per month without overconcentrating.
For the full analysis, see our Epic bundle review.
Head-to-Head: The Three Differences That Actually Matter
Forget the feature checklists. Here’s what really separates these services:
1. Capital Deployment Capacity
This is the crux of the decision.
With Stock Advisor’s 2 picks per month, you’re adding 24 positions per year. If you’re investing $1,000 per pick, that’s $24,000 deployed annually. For a $25,000 portfolio, that’s nearly your entire capital in year one.
Epic’s 5 picks per month means 60 positions per year. Same $1,000 per pick equals $60,000 deployed. For a $50,000 portfolio, you’d be fully deployed in 10 months.
The Math: If your portfolio is under $50,000, you likely can’t deploy 5 picks per month without overconcentrating in newer, unproven positions. Stock Advisor’s 2 picks give you room to build positions gradually.
If you have $100,000+, Stock Advisor’s 2 picks might feel limiting. You have capital sitting idle while waiting for the next recommendation.
2. Hidden Gems Access
This is Epic’s genuine differentiation.
Hidden Gems targets small and mid-cap companies that fly under Wall Street’s radar. These are the stocks with higher growth potential—and higher risk—that Stock Advisor’s large-cap focus doesn’t cover. Led by co-founder Tom Gardner, its mandate is finding quality companies before they become household names. One honest limitation: Motley Fool does not publish an independently verifiable per-scorecard track record for Hidden Gems, so we can’t quote a standalone win rate or return figure — judge it as part of the Epic bundle’s record rather than on numbers we can’t verify.
The Question: Do you want small-cap exposure? If yes, Epic is the only way to get it within the Motley Fool ecosystem. If you’re comfortable with large-cap growth stocks, Stock Advisor covers that territory.
3. Complexity vs. Simplicity
Stock Advisor is clean. Two picks per month. One portfolio strategy. Simple decisions.
Epic is busier. Five picks across four services. More decisions about what to buy, how much to allocate, and how to balance across strategies.
For some investors, more picks means more opportunities. For others, it means more noise, more second-guessing, and more chances to make mistakes.
The Self-Assessment: Are you the type who thrives with more options, or do you perform better with constraints? Your answer matters more than the feature comparison.
How to Decide: Stock Advisor vs Epic
Choose Stock Advisor if:
- Your portfolio is under $50,000
- You want simplicity over variety
- You’re new to stock-picking services
- You prioritize the proven flagship track record at the lowest cost
- You find 2 picks per month sufficient for your capital deployment
Choose Epic if:
- You have $50,000+ to deploy
- You specifically want Hidden Gems’ small-cap exposure
- You find yourself wanting more picks than Stock Advisor provides
- You can manage 5 positions per month without overcomplicating your portfolio
- The $200 price difference is trivial relative to your portfolio size
Either Works if:
- You’ll actually follow the recommendations (the biggest variable is you, not the service)
- You understand that 30-35% of picks from any service will lose money
- You can hold through 40-50% drawdowns without panic-selling
- You’re adding this as one input to your process, not your entire strategy
The Tiebreaker: If you’re still stuck, ask yourself: “Do I have capital sitting idle because Stock Advisor only gives me 2 picks per month?” If yes, Epic. If you’re still building positions from existing recommendations, Stock Advisor.
The Upgrade Path: When Stock Advisor Members Should Consider Epic
Here’s the scenario where Epic makes sense as an upgrade:
You’ve been a Stock Advisor member for 2+ years. You’ve built positions in most of the Foundational Stocks. You’re following the new picks each month. And you have fresh capital you want to deploy—but you’re waiting weeks for the next recommendation.
That’s when Epic’s additional 3 picks per month becomes valuable. Not because the picks are “better,” but because you have capital that needs a home.
The Wrong Reason to Upgrade: “I want better returns.” Epic won’t deliver better returns than Stock Advisor—it delivers more picks. The flagship Stock Advisor track record is identical in both packages. If you’re upgrading hoping for superior performance, you’ll be disappointed.
The Right Reason to Upgrade: “I have more capital to deploy than Stock Advisor can absorb.” That’s the legitimate use case for Epic.
The Bottom Line
Stock Advisor wins for most investors. The 24.5-year track record (+978.9%), the 66% win rate improving to 92.2% for decade-long holds, 46 ten-baggers, the simplicity of 2 picks per month, and the $99 price point make it the obvious starting point. You get the methodology that built Motley Fool’s reputation without the complexity of managing multiple services.
Epic earns a GOOD fit rating for investors with $50K+ portfolios who want broader exposure across market caps. With 210-point dispersion between winners and losers — the strongest stock-picker’s signal of 2026 — Hidden Gems’ small-cap focus adds genuine diversification. The rotation is stark: SanDisk +560% and Micron +236% lead while the Trade Desk is down −63.9% and Intuit −45.8% (Slickcharts, Aug 31, 2026). The VIX at 14.92 keeps the index calm, and the S&P 500 at 7,686 (+13.1% YTD) confirms this is a market that rewards selectivity. The $200 premium is justified if you have the capital to deploy five picks monthly and specifically want small-cap exposure — otherwise, Stock Advisor’s EXCEPTIONAL fit rating, 978.9% total return, and 24.5-year track record may better serve investors who value proven methodology over breadth.
The real question isn’t which service is “better.” It’s whether you have the capital and appetite for more picks. Stock Advisor is the foundation. Epic is the expansion. Start with the foundation unless you have a specific reason to expand.
If I had to pick one for a friend who’s never subscribed? Stock Advisor, because the training wheels of simplicity make it easier to follow the process that actually generates returns.
Want to compare these with other options? Explore our guide to the best stock advisors. See also: Stock Advisor vs Motley Fool One for the all-access tier, or Stock Advisor vs Alpha Picks for an outside-the-Fool-ecosystem alternative.
Frequently Asked Questions
Stock Advisor vs Epic: which is better?
Stock Advisor earns an EXCEPTIONAL fit rating for most investors — both include the same flagship picks with the +978.9% track record since 2002 (66% win rate, 92.2% for 10+ year holds, 46 ten-baggers, 191 doublers across 526 positions; TraderHQ analysis of the published trade log, data as of Aug 31, 2026). Epic earns a GOOD fit rating — Hidden Gems’ small-cap tilt adds market-cap diversification and 210-point dispersion creates selective opportunities across caps. Epic adds Rule Breakers, Hidden Gems, and Dividend Investor for $200 more per year, but only adds value if you have $50,000+ to deploy. For portfolios under $50K, Stock Advisor’s 2 picks per month is sufficient.
Is Motley Fool Stock Advisor worth it?
Yes, for long-term investors who can hold 5+ years. At $99/year (new member price), Stock Advisor has returned +978.9% since 2002 vs the S&P 500’s +214% (per-position benchmark; TraderHQ analysis of the published trade log, data as of Aug 31, 2026). The 66% overall win rate improves to 92.2% for 10+ year holds, with 46 ten-baggers generated across 526 positions. The math works if you follow the strategy—patience lets the winners compound. The 30-day money-back guarantee lets you test the service risk-free.
Is Motley Fool Epic worth it?
Yes, but only for investors with $50,000+ portfolios. Epic costs $299/year (new member price) and provides 5 picks per month across four services. The genuine value is Hidden Gems’ small-cap access—Stock Advisor and Rule Breakers have significant overlap. If you have the capital to deploy 5 picks monthly and want diversified exposure, Epic delivers. For smaller portfolios, Stock Advisor at $99 is the better starting point.
Can I use both Stock Advisor and Epic?
No—Epic includes Stock Advisor. Epic is a bundle that contains Stock Advisor plus Rule Breakers, Hidden Gems, and Dividend Investor. If you subscribe to Epic, you get all Stock Advisor picks automatically. There’s no reason to pay for both. The decision is whether to start with Stock Advisor alone or upgrade to the full Epic bundle.
What’s included in Epic that’s not in Stock Advisor?
Epic adds three services beyond Stock Advisor: Rule Breakers (aggressive growth, +312% since 2004 per the official publisher scorecard, Aug 18, 2026), Hidden Gems (small/mid-cap, no per-scorecard track record publicly disclosed), and Dividend Investor (income focus, no per-scorecard track record publicly disclosed). You also get an expanded Moneyball database (340+ vs 190+ companies), full Fool IQ access, and GamePlan+ financial planning content. The most valuable addition is Hidden Gems’ small-cap picks.
Should I start with Stock Advisor or Epic?
Start with Stock Advisor unless you have $50K+ to deploy. Stock Advisor’s 2 picks per month is sufficient for portfolios under $50,000. You can always upgrade to Epic later when your portfolio grows and you need more picks to deploy. Starting with Epic when you can’t fully utilize 5 picks per month means paying for features you won’t use.
Is Stock Advisor worth it in 2026?
Yes — the case for Stock Advisor is as strong as it’s ever been. With 978.9% total returns since 2002, 46 ten-baggers, and 191 doublers across 526 positions (TraderHQ analysis of the published trade log, data as of Aug 31, 2026), the track record speaks for itself. September 2026’s 210-point dispersion between winners (+168.7% average top-20) and losers (−41.6% average bottom-20) means stock selection dramatically outperforms passive indexing (S&P 500 at 7,686, +13.1% YTD total return; Slickcharts, Aug 31, 2026). The rotation tells the story: memory and storage names like SanDisk +560% are leading while ad-tech and enterprise software bleed — Stock Advisor’s quality GARP methodology naturally gravitates toward durable, profitable companies that can ride winners in any cap. The VIX at 14.92 signals index-level calm, but a ~65% probability of a September Fed hike and CAPE near 40 — highest since 2000 — mean company-level fundamentals remain the only reliable anchor. At $99/year for new members, the cost is trivial relative to the alpha opportunity.
Which Motley Fool service is best for the current market rotation?
Stock Advisor for proven methodology; Epic for broader coverage. The 2026 rotation continues: memory and storage (SanDisk +560%, Micron +236%), refiners (Marathon Petroleum +130%), and cybersecurity (Fortinet +115%) lead, while ad-tech (Trade Desk −63.9%) and enterprise software (Intuit −45.8%) lag (Slickcharts, Aug 31, 2026). The Fed holding at 3.50–3.75% with CPI at 3.4% (core 2.5%) and hike odds near 65% for the September FOMC favors quality GARP approaches. Stock Advisor’s methodology naturally gravitates toward durable companies. Epic adds Hidden Gems (small-cap exposure across market caps), Rule Breakers (innovation themes like memory and biotech), and Dividend Investor (defensive income). 210-point dispersion and manufacturing PMI at 55.6 reward selectivity at every cap level. Choose based on your capital: Stock Advisor for portfolios under $50K, Epic for $50K+.