

You’re choosing between Motley Fool’s two flagship growth services. Stock Advisor is the original—24 years of track record, the service that built the Fool’s reputation. Rule Breakers sounds more exciting—aggressive bets on disruptive innovators before they become obvious.
Both hunt growth stocks. Both come from the Gardner brothers. Both have outperformed the market. So which one actually deserves your money?
The straight answer: Stock Advisor wins for most investors. It has the longer track record (+978.9% vs +311.9%), the lower price ($99/year vs $299/year), and standalone availability. Rule Breakers is a powerful accelerator—but it’s designed to build on top of Stock Advisor, not replace it.
September 2026 Market Context: extreme dispersion favors Stock Advisor — but a possible Fed hike is the new risk for Rule Breakers.
The S&P 500 closed August at 7,686, up 13.1% year-to-date on a total-return basis (Slickcharts, Aug 31, 2026). But a 210-point spread between the average top-20 S&P name (+168.7%) and the average bottom-20 (-41.6%) tells you stock selection is the whole game. SanDisk is up 560% this year; the Trade Desk is down 64%. The index-level VIX reads a calm 14.92 — the split is underneath.
The macro wrinkle is the Fed. Chair Warsh used Jackson Hole (Aug 28) to push September hike odds to ~60-65% (CME FedWatch via CNBC), with July CPI at 3.4% (BLS) and the 10-year yield at a 19-month high of 4.76% (Aug 31). A possible first hike into a CAPE above 40 — the highest since September 2000 — is the drag on high-multiple growth. But bearish sentiment (44.4% of AAII respondents) and ISM manufacturing at 55.6 show an expansion still grinding through it.
Stock Advisor rates EXCEPTIONAL for this tape: quality GARP with recession proof from 2008, 2020, and 2022, built for a market where selection beats beta. Rule Breakers rates Strong — its innovation mandate maps directly onto memory chips and the mRNA oncology breakthrough, but a hike would compress volatile growth hardest. Rule Breakers’ own cohort data is the best argument for its patience requirement: picks held 10+ years show a 98.6% win rate and a +1,775.1% average return, while picks under a year average -7% (TraderHQ analysis of the published trade log, data as of Aug 19, 2026). The methodology works — if you can hold through the first five years and stomach the ride.
Try Stock Advisor risk-free for 30 days
Here’s exactly why, and when Rule Breakers might be the smarter choice.
Quick Comparison: Motley Fool Stock Advisor vs Rule Breakers
| Dimension | Stock Advisor | Rule Breakers | Edge |
|---|---|---|---|
| Track Record | +978.9% since 2002 | +311.9% since 2004 | Stock Advisor |
| vs S&P 500 | ~4.6x the benchmark | ~1.7x the benchmark | Stock Advisor |
| Price | $99/year (promo) | $299/year (Epic bundle) | Stock Advisor |
| Standalone Option | ✅ Yes | ❌ No (bundle only) | Stock Advisor |
| Volatility | 30-50% drawdowns | 50%+ drawdowns | Stock Advisor |
| Methodology | Balanced growth framework | Aggressive disruption hunting | Tie |
| 10-Bagger Potential | Strong compounders | Asymmetric moonshots | Rule Breakers |
| Picks Per Month | 2 | 2 (5 total in Epic) | Tie |
| Target Portfolio | $25,000+ | $50,000+ | Stock Advisor |
| Overall Winner | — | — | Stock Advisor |
The table tells the story: Stock Advisor leads on nearly every dimension that matters for most investors. But Rule Breakers isn’t trying to compete on the same terms—it’s hunting bigger game with bigger risks.
Motley Fool Stock Advisor: The 24-Year Foundation
Stock Advisor is The Motley Fool’s flagship service—the one that made their reputation. Launched in February 2002, it’s delivered +978.9% cumulative returns versus a per-position S&P 500 benchmark averaging +214%. That’s roughly 4.6x outperformance over more than two decades.

Motley Fool Stock Advisor Performance
The Motley Fool · 526 picks · 25 years · Updated Aug 31, 2026
| SA Return | S&P 500 | Alpha | Win Rate |
|---|---|---|---|
| +979% | +214% | +765% | 66% |
S&P 500 shows what you'd have earned buying the index on each pick date instead. Same timing, fair comparison.
| SA Multi-Baggers | 10x+ | 5x+ | 3x+ | 2x+ |
|---|---|---|---|---|
| Count | 46 | 91 | 128 | 191 |
| SA Asymmetry | Avg Winner | Avg Loser | Ratio |
|---|---|---|---|
| Return | +1.7K% | -44% | ~38:1 |
Best Performers (All-Time)
| SA Pick | Return |
|---|---|
 AMZN Amazon | +35K% |
 DIS Disney | +6.1K% |
 MME.DL MME.DL | +4.3K% |
 CTAS CTAS | +4.6K% |
 NFLX Netflix | +44K% |
 NVDA NVIDIA | +133K% |
 TSLA Tesla | +16K% |
 BKNG Booking Holdings | +22K% |
 SHOP Shopify | +4.6K% |
 AAPL Apple | +6.5K% |
38:1 asymmetry. Winners average +1.7K%, losers average -44%. One winner offsets 38 complete losses—this is why selling winners early is costly.
See All Stock Advisor Recommendations →Latest Stock Advisor Picks
Tickers masked to protect subscriber value. Recent picks need 3-5+ years to demonstrate thesis.
| SA Pick | Return |
|---|---|
**** Cloud Monitoring | +97% |
**** Chip Manufacturer | +85% |
**** Infrastructure Construction | +63% |
**** Growth Company | +51% |
**** Growth Company | +41% |
**** E-commerce & Cloud Giant | +28% |
**** Growth Company | +23% |
**** Convenience Stores | +19% |
**** Growth Company | +18% |
**** Growth Company | +16% |
Early results mislead. < 1 year: 57.1% win rate. 10+ years: 92.2%. That 35-point gap explains why judging picks early leads to selling future winners.
Stock Advisor Win Rate by Holding Period
| Hold Time | SA Win Rate | Avg Return |
|---|---|---|
| < 1 Year | 57.1% | +16% |
| 1-3 Years | 55.7% | +11% |
| 3-5 Years | 48.8% | +23% |
| 5-10 Years | 62.9% | +206% |
| 10+ Years | 92.2% | +4.1K% |
Time is the strategy. 10+ year picks show 92.2% win rate with +4.1K% average returns. Same methodology, same picks—time transforms the results.
Stock Advisor Performance by Year
| Year | SA Picks | Avg Return | Win Rate | |
|---|---|---|---|---|
| 2026 | 31 | +10% | 57% | DDOG+97% |
| 2025 | 26 | +7% | 48% | ASML+133% |
| 2024 | 25 | +25% | 67% | AMD+186% |
| 2023 | 25 | +78% | 73% | CRWD+607% |
| 2022 | 23 | +58% | 59% | NET+495% |
| 2021 | 22 | -13% | 32% | LRCX+491% |
| 2020 | 24 | +146% | 46% | TSLA+1.1K% |
| 2019 | 23 | +56% | 70% | SNPS+259% |
| 2018 | 19 | +228% | 68% | SHOP+1.1K% |
| 2017 | 22 | +700% | 86% | NVDA+8.4K% |
| 2016 | 20 | +446% | 80% | SHOP+4.6K% |
| 2015 | 22 | +208% | 68% | CASY+839% |
| 2014 | 20 | +354% | 80% | ATVI+2.8K% |
| 2013 | 17 | +386% | 65% | NFLX+2.5K% |
| 2012 | 23 | +1.2K% | 74% | TSLA+16K% |
| 2011 | 19 | +561% | 63% | AAPL+3.2K% |
| 2010 | 18 | +459% | 83% | AMZN+2.9K% |
| 2009 | 20 | +3.3K% | 90% | NVDA+56K% |
| 2008 | 18 | +1.2K% | 89% | AAPL+6.5K% |
| 2007 | 19 | +1.5K% | 37% | NFLX+29K% |
| 2006 | 20 | +2.5K% | 65% | NFLX+25K% |
| 2005 | 16 | +8.4K% | 63% | NVDA+133K% |
| 2004 | 17 | +6.0K% | 59% | NFLX+44K% |
| 2003 | 17 | +229% | 65% | PHIN+1.4K% |
| 2002 | 16 | +3.2K% | 81% | AMZN+35K% |
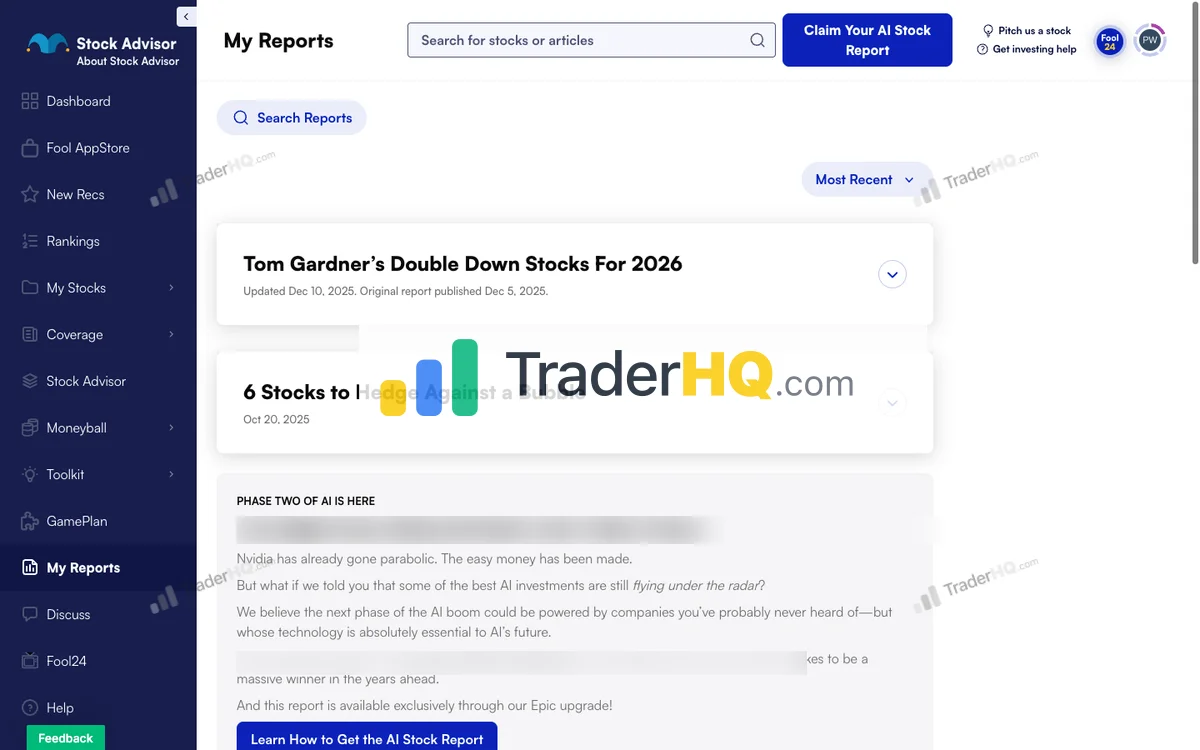
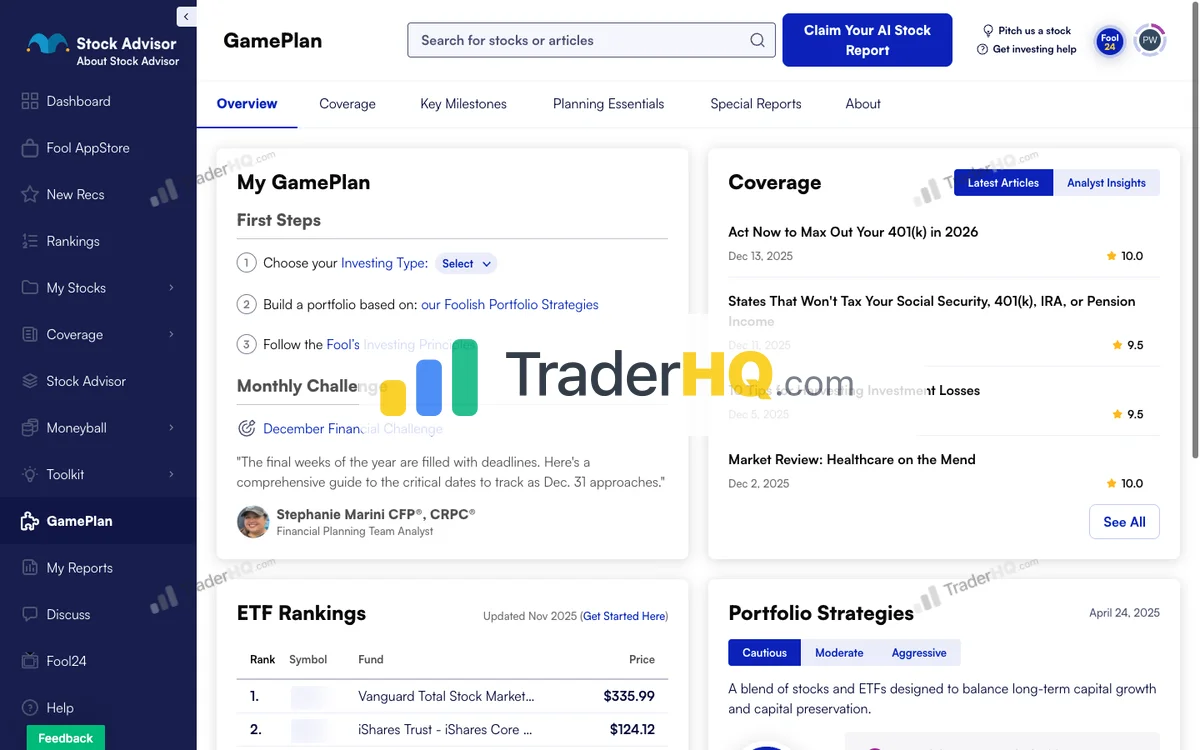
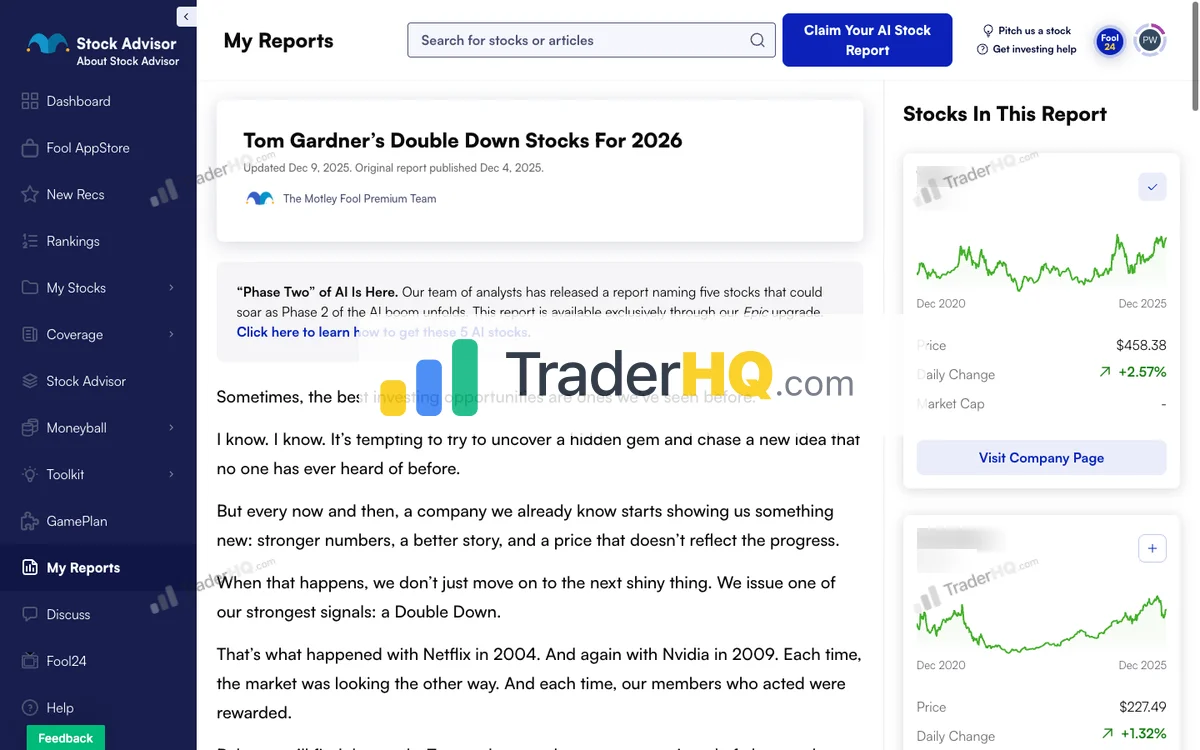
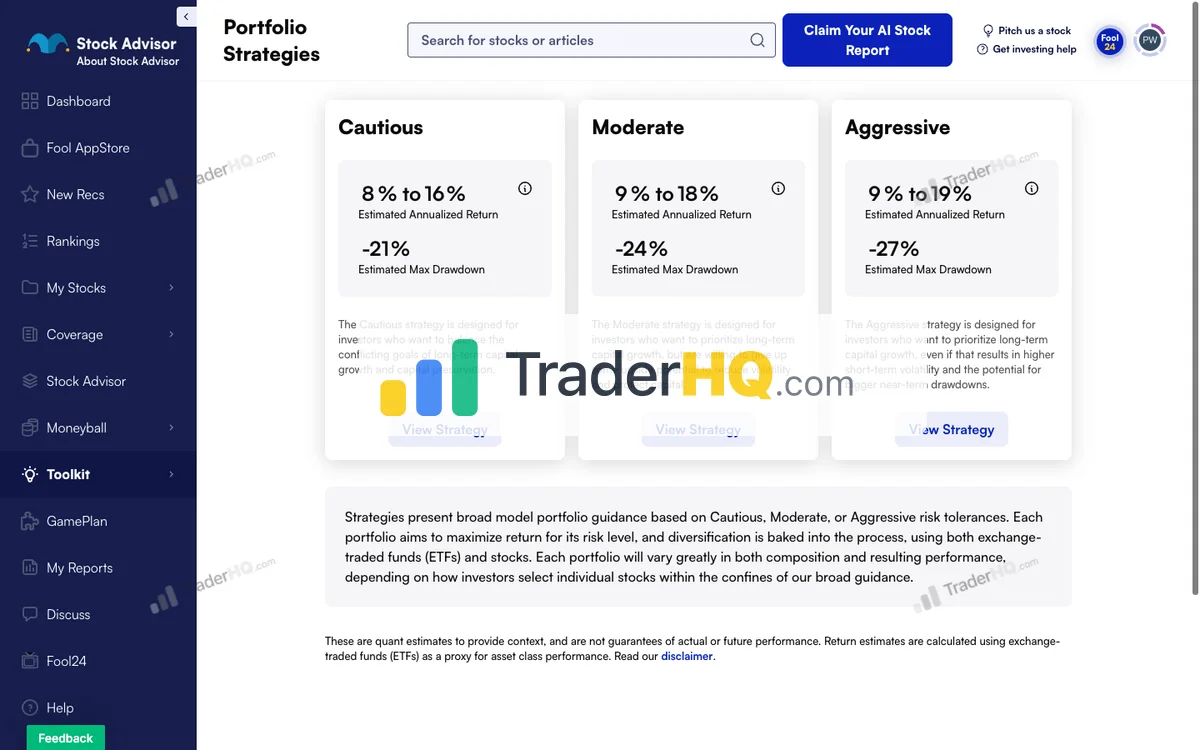
Inside Stock Advisor
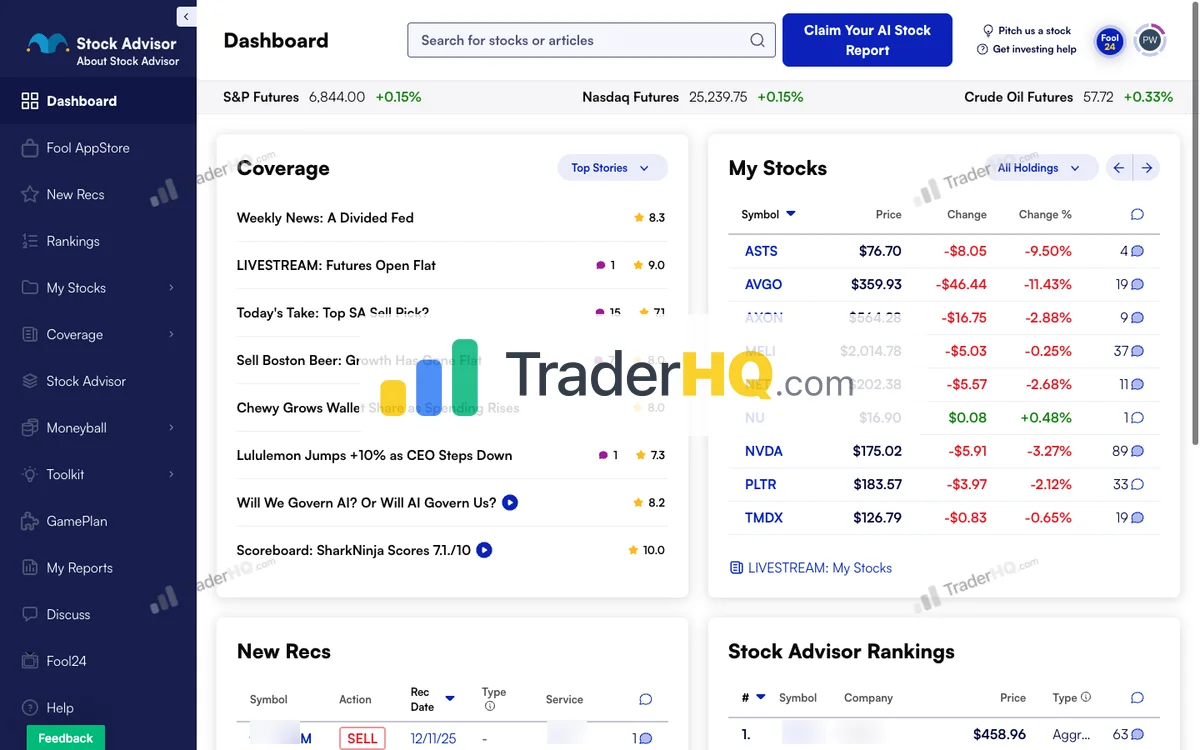
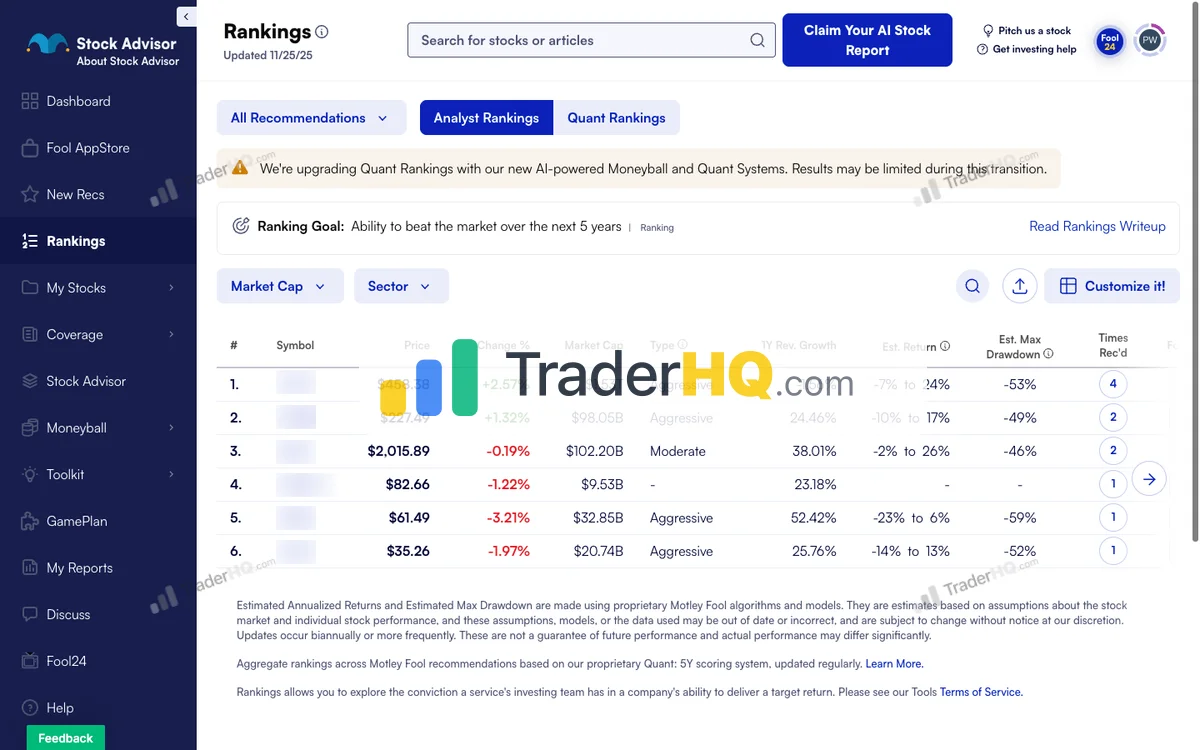
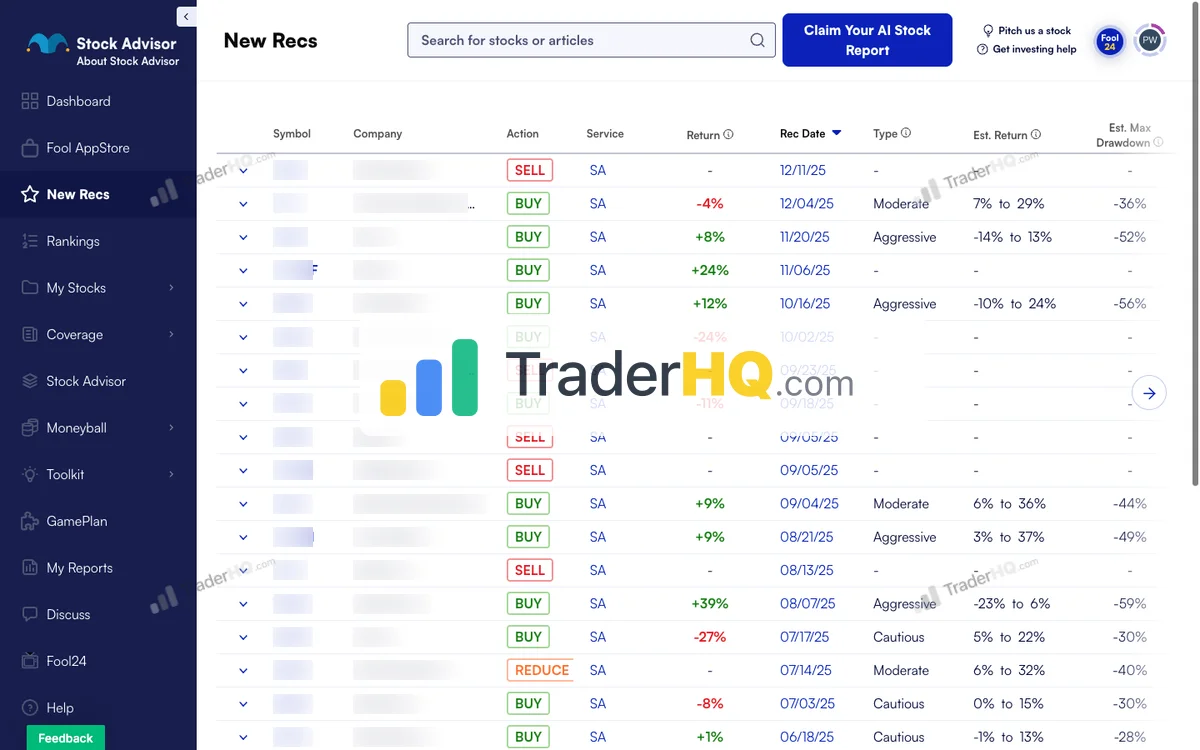
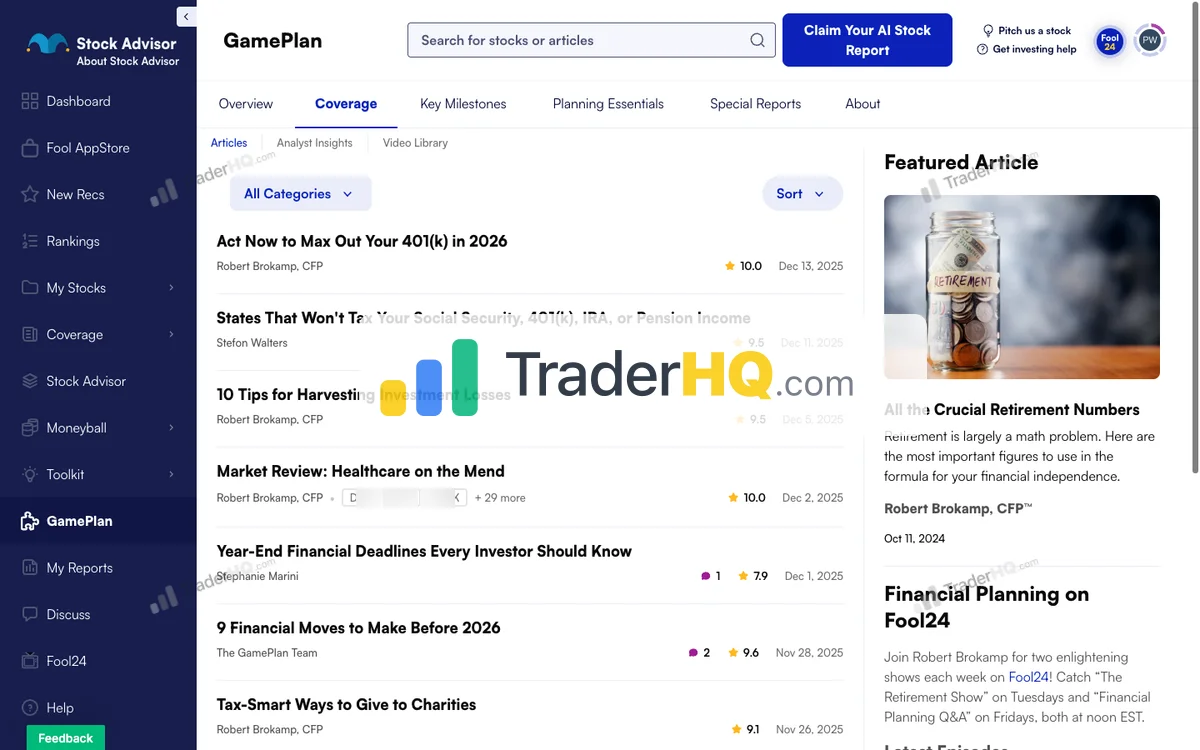
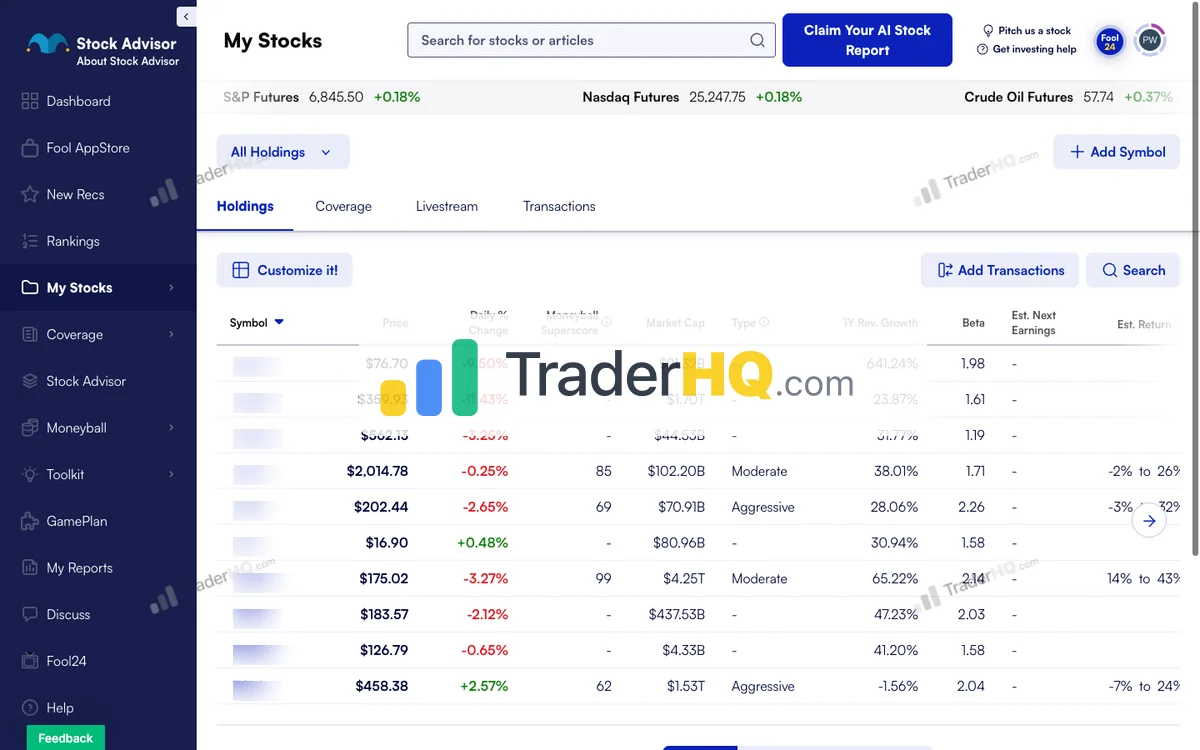
9 screenshots · Click to expand
How we compute this (and what it can’t tell you): Figures in this section are TraderHQ analysis of the published trade log (data as of Aug 31, 2026) — 526 positions computed from the publisher’s own recommendation prices. This is official-computed analysis, not a third-party audit; entry prices were not independently verified. Known gaps: 4 positions lack entry dates, 23 carry no computed return, and sector data covers only 4% of positions. The record is also tail-driven: NVDA, NFLX, AMZN, and a handful of repeat winners do the heavy lifting.
But the returns aren’t even the most valuable part.
What You Actually Get:
Stock Advisor isn’t just stock tips—it’s a complete portfolio-building framework. Three strategies calibrated to different risk tolerances (Cautious, Moderate, Aggressive). A Foundational Stocks list of the 10 highest-conviction core holdings. Quantitative projections for every recommendation. And the Moneyball database with 344 companies scored across 12 dimensions.
The philosophy is simple: find companies with durable competitive advantages, buy them, and hold for years while the market catches up to their value.
The Numbers:
$10,000 invested following Stock Advisor picks since 2002 would be worth $107,886 today, assuming all recommendations followed equally (TraderHQ analysis of the published trade log, data as of Aug 31, 2026). The per-position S&P 500 benchmark over the same holding periods averaged +214%.
The win rate demonstrates the power of patience: 66% overall, improving to 92.2% for positions held 10+ years. They’ve generated 46 ten-baggers and 191 doublers across 526 positions—the asymmetric wins that justify the long-term approach.
Any winning number travels with its whole book: loser share, average loss, and the counting method—closed trades or open—stated in the same sentence. A highlight without its denominator is marketing, not evidence. Here, the denominator is 526 positions: 34% of picks lose money, winners average +1,701.7%, and losers average -44.5%. The median pick returned +42.4%—the headline is earned by holding winners, not by never being wrong.
Those numbers hide real volatility. Stock Advisor’s aggressive strategy warns of -59% maximum drawdowns. Their 2021-vintage picks faced brutal pullbacks. The strategy works if you can hold through the pain—most can’t.
For the complete analysis of Stock Advisor’s methodology, track record, and full feature set, see our Stock Advisor review.
Best For:
Patient investors with 5+ year horizons, $25K+ portfolios, and the stomach for 30-50% drawdowns. You want a framework for building wealth, not just stock tips. You’re okay with 2 picks per month and doing your own position sizing.
Not For:
Short-term traders, income seekers, or anyone who’ll panic-sell during a 40% drawdown. Also not ideal if you’re frustrated by constant upsell pressure to Epic and higher tiers.
Try Stock Advisor — $99/Year with 30-Day Guarantee
Rule Breakers: The Aggressive Accelerator
Rule Breakers is the growth-hunting arm of the Motley Fool ecosystem. Launched in 2004 by David Gardner, it hunts disruptive innovators before they become household names. The track record: +311.9% versus a per-position S&P 500 benchmark averaging +185.7% over the same period, with a 74% win rate across 217 positions (TraderHQ analysis of the published trade log, data as of Aug 19, 2026).

Motley Fool Rule Breakers Performance
The Motley Fool · 217 picks · 22 years · Updated 2026-08-19
| RB Return | S&P 500 | Alpha | Win Rate |
|---|---|---|---|
| +312% | +186% | +126% | 74% |
S&P 500 shows what you'd have earned buying the index on each pick date instead. Same timing, fair comparison.
| RB Multi-Baggers | 10x+ | 5x+ | 3x+ | 2x+ |
|---|---|---|---|---|
| Count | 37 | 65 | 90 | 105 |
| RB Asymmetry | Avg Winner | Avg Loser | Ratio |
|---|---|---|---|
| Return | +918% | -36% | ~25:1 |
Best Performers (All-Time)
| RB Pick | Return |
|---|---|
 ANET Arista Networks | +4.3K% |
SHOP Shopify | +7.0K% |
 GOOGL Alphabet (Google) | +3.1K% |
TSLA Tesla | +16K% |
 MELI MercadoLibre | +13K% |
 VRTX Vertex Pharma | +4.8K% |
 AVGO Broadcom | +3.2K% |
 PANW Palo Alto Networks | +3.2K% |
 MNST MNST | +3.2K% |
 ISRG Intuitive Surgical | +7.9K% |
The multi-bagger pipeline. 105 doublers → 65 5-baggers → 37 10-baggers. About 35% of doublers become 10-baggers with enough time.
See All Rule Breakers Recommendations →Latest Rule Breakers Picks
Tickers masked to protect subscriber value. Recent picks need 3-5+ years to demonstrate thesis.
| RB Pick | Return |
|---|---|
**** Life Sciences Software | +42% |
**** Growth Company | +21% |
**** Growth Company | +17% |
**** Growth Company | +14% |
**** Growth Company | +6% |
**** Social Platform | -11% |
**** Growth Company | -12% |
**** RNA Therapeutics | -18% |
**** Growth Company | -34% |
**** Growth Company | -34% |
Lessons from 2011. 4 picks that year averaged +4.5K%. Best performers often come from buying during uncertainty—when conviction feels hardest.
Rule Breakers Win Rate by Holding Period
| Hold Time | RB Win Rate | Avg Return |
|---|---|---|
| < 1 Year | 41.7% | -7% |
| 1-3 Years | 61.3% | +47% |
| 3-5 Years | 55.3% | +60% |
| 5-10 Years | 69.8% | +212% |
| 10+ Years | 98.6% | +1.8K% |
Time is the strategy. 10+ year picks show 98.6% win rate with +1.8K% average returns. Same methodology, same picks—time transforms the results.
Rule Breakers Performance by Year
| Year | RB Picks | Avg Return | Win Rate | |
|---|---|---|---|---|
| 2026 | 9 | +2% | 63% | VEEV+42% |
| 2025 | 12 | +1% | 42% | BBIO+99% |
| 2024 | 16 | +63% | 69% | GH+430% |
| 2023 | 19 | +69% | 58% | CRWD+647% |
| 2022 | 19 | +75% | 63% | ANET+678% |
| 2021 | 16 | +39% | 44% | CRWD+210% |
| 2020 | 13 | -16% | 31% | ISRG+100% |
| 2019 | 14 | +118% | 64% | DDOG+661% |
| 2018 | 13 | +403% | 92% | AXON+1.3K% |
| 2017 | 9 | +387% | 89% | TWLO+687% |
| 2016 | 14 | +1.4K% | 100% | SHOP+7.0K% |
| 2015 | 5 | +652% | 80% | AXON+2.5K% |
| 2014 | 11 | +1.1K% | 100% | ANET+4.3K% |
| 2013 | 8 | +456% | 100% | AX+912% |
| 2012 | 8 | +1.4K% | 100% | META+2.4K% |
| 2011 | 4 | +4.5K% | 100% | TSLA+16K% |
| 2010 | 2 | +323% | 100% | OLED+423% |
| 2009 | 7 | +3.4K% | 100% | MELI+13K% |
| 2008 | 4 | +1.6K% | 100% | ISRG+2.8K% |
| 2007 | 7 | +1.1K% | 100% | CMG+2.7K% |
| 2006 | 1 | +3.3K% | 100% | ISRG+3.3K% |
| 2005 | 6 | +3.4K% | 100% | ISRG+7.9K% |
How we compute this (and what it can’t tell you): TraderHQ analysis of the published trade log (data as of Aug 19, 2026) — 217 positions, computed from the publisher’s own recommendation prices, not independently audited. Two gaps matter: all 217 positions are still open, so these are unrealized marks rather than realized gains, and the 10+ year cohort reflects a small, highly seasoned subset. The whole book: 74% win rate counting open winners, 26% of picks losing an average of -36%, and the median pick up +94.6%.
Lower absolute returns than Stock Advisor—but the pattern of returns tells you exactly what you’re signing up for.
The Asymmetric Math:
Rule Breakers’ winners average +917.5%. Losers average -36%. The asymmetry is massive. Even if you pick more losers than winners, the math works in your favor over time.
But the time horizon isn’t a suggestion—it’s the entire strategy:
| Holding Period | Win Rate | Avg Return |
|---|---|---|
| < 1 Year | 41.7% | -7% |
| 1-3 Years | 61.3% | +46.8% |
| 5-10 Years | 69.8% | +211.8% |
| 10+ Years | 98.6% | +1,775.1% |
First-year picks average -7% and historically trail the index. Hold for a decade, and the 10+ year cohort shows a 98.6% win rate with +1,775% average returns. The service is designed for patient capital that can survive the early volatility.
For a deeper dive into Rule Breakers’ philosophy and the Epic bundle, see our Motley Fool review.
What’s Changed:
David Gardner—the founder and original stock picker—stepped back from making recommendations in May 2021. The analyst team now makes all picks. The philosophy remains, but the personality is gone.
The Bundle Reality:
Rule Breakers is not available standalone. You must purchase the Epic bundle at $299/year (new members, $499 regular), which includes Stock Advisor, Hidden Gems, and Dividend Investor. If you want Rule Breakers, you’re getting Stock Advisor anyway.
When the product readers are searching for no longer exists, we name that out loud and rank what actually replaced it. A page pretending a dead product is still for sale is a doorway page with better manners. So: if you’re shopping for a “Rule Breakers subscription” in 2026, the product you’re picturing doesn’t exist—you’re shopping for Epic.
Best For:
Aggressive investors with 5-10+ year horizons, $50K+ portfolios, who can stomach 50%+ drawdowns on individual positions. You want exposure to disruptive innovators and understand that some positions will be down 80% while still marked “BUY.”
Not For:
Income investors, short-term traders, or anyone who subscribed in 2020-2021 and is frustrated by the brutal drawdowns on that vintage. Not for investors who can’t psychologically handle positions down 80-90%.
Try Rule Breakers via Epic Bundle — 30-Day Guarantee
Head-to-Head: The Key Differences
Philosophy: Framework vs. Moonshots
Stock Advisor builds a complete portfolio. Three risk-calibrated strategies, a core holdings list, quantitative scoring for every pick. It’s designed to be your primary investment framework—a system, not just tips.
Rule Breakers hunts asymmetric returns. The philosophy accepts that many picks will fail, but the winners will be so large they more than compensate. It’s designed to be an accelerator on top of a solid foundation—not the foundation itself.
The Practical Difference: Stock Advisor tells you how to build a portfolio. Rule Breakers tells you what to add for aggressive growth exposure.
Track Record: Length vs. Transparency
Stock Advisor has 24.5 years of data and higher absolute returns (+978.9% vs +311.9%—TraderHQ analysis of the published trade log, data as of Aug 31 and Aug 19, 2026).
Rule Breakers has 21.9 years of data with lower absolute returns—but publishes the more granular holding-period analysis, showing exactly how back-loaded its returns are. The -7% to +1,775% progression across cohorts is remarkably transparent. At 10+ years, Rule Breakers’ 98.6% win rate actually edges past Stock Advisor’s 92.2%.
The Practical Difference: Stock Advisor’s longer track record provides more confidence. Rule Breakers’ transparency helps you understand exactly what to expect.
Volatility: Uncomfortable vs. Brutal
Stock Advisor expects 30-50% drawdowns. Their aggressive strategy warns of -59% maximum drawdown. It’s uncomfortable, but survivable for most disciplined investors.
Rule Breakers expects 50%+ drawdowns on individual positions. Some stocks are down 80-90% and still rated “BUY.” The service explicitly tells you this is part of the strategy.
The Practical Difference: If a 40% drawdown would keep you up at night, stick with Stock Advisor. If you can watch a position lose 80% and add more, Rule Breakers might fit.
Pricing: Standalone vs. Bundle
Stock Advisor is available standalone at $99/year (new member promo) or $199/year (regular). You can try it without committing to the full Motley Fool ecosystem.
Rule Breakers requires the Epic bundle at $299/year (new members, $499 regular). But Epic includes Stock Advisor, Hidden Gems, and Dividend Investor—so you’re getting four services for three times the price of one.
The Practical Difference: If you only want one service, Stock Advisor is your only option. If you want Rule Breakers, you’re getting Stock Advisor included anyway.
How to Decide: Stock Advisor vs Rule Breakers
Choose Stock Advisor if:
- You’re new to Motley Fool and want to start with the flagship
- You prefer a complete portfolio-building framework, not just stock tips
- You want standalone pricing without committing to a bundle
- 30-50% drawdowns are your volatility limit
- Your portfolio is $25K+ and you have a 5+ year horizon
Choose Rule Breakers (via Epic) if:
- You already have Stock Advisor and want to add aggressive growth exposure
- You can stomach 50%+ drawdowns on individual positions
- You want access to all four Motley Fool scorecards (SA, RB, Hidden Gems, Dividend Investor)
- Your portfolio is $50K+ and you have a 10+ year horizon
- You understand that some positions will be down 80% while still rated “BUY”
Either Works if:
- You’re committed to the 5+ year holding period (the biggest variable is you, not the service)
- You understand that 30-40% of picks from any service will lose money
- You’re adding this as one input to your process, not your entire strategy
The Tiebreaker:
If you’re still stuck, ask yourself: “Do I want a foundation or an accelerator?”
Then run the drawdown rehearsal. Take the service’s worst documented stretch—Stock Advisor’s 2021 vintage averaged -13% with a 32% win rate (TraderHQ analysis of the published trade log, data as of Aug 31, 2026)—and write down what month four of that stretch would feel like, and what would still be your job: not selling the compounders. The service that supplies what you need in that week is the service.
Stock Advisor is the foundation—the service designed to be your primary investment framework. Rule Breakers is the accelerator—designed to add aggressive growth on top of a solid base.
Most investors should start with the foundation.
The Verdict: Stock Advisor Wins for Most Investors
Stock Advisor is the better choice for most investors. The 24.5-year track record (+978.9%), the 66% win rate improving to 92.2% for decade-long holds, the 46 ten-baggers, the complete portfolio framework, the lower price, and the standalone availability make it the obvious starting point (TraderHQ analysis of the published trade log, data as of Aug 31, 2026).
The tape backs that up. In a market with a 210-point spread between the average top-20 S&P name (+168.7%) and the average bottom-20 (-41.6%)—S&P 7,686, +13.1% YTD (Slickcharts, Aug 31, 2026)—quality selection is the whole game. Memory (SNDK +560%), refiners (MPC +130%), and cybersecurity are leading; ad-tech (TTD -63.9%) and enterprise software (INTU -45.8%) are bleeding. That split rewards Stock Advisor’s GARP discipline.
Rule Breakers’ conditions are mixed. VIX at 14.92 and ISM manufacturing at 55.6 help—but ~65% September hike odds after Jackson Hole and a 19-month-high 10-year yield (4.76%) pressure high-multiple growth hardest. Rule Breakers’ 37 ten-baggers, +311.9% total return, 74% win rate, and 91 doublers across 217 positions (data as of Aug 19, 2026) remind you: the best time to build positions in disruptive innovators has historically been when nobody wants them. AAII bears sit at 44.4% while the index is 0.7% from its high—fear is priced, not euphoria.
One caution that outlives every number above: a service’s published record belongs to the picks; your record belongs to your entries, your exits, and your temperament. The distance between those two numbers is where almost all subscriber disappointment lives.
But here’s the nuance: if you want Rule Breakers, you’re getting Stock Advisor anyway. The Epic bundle includes both. So the real question becomes: “Do I want just Stock Advisor at $99/year, or the full Epic bundle at $299/year?”
For new investors, start with Stock Advisor. Build the foundation. See if the Motley Fool approach fits your investing style. If it does, and you want more aggressive exposure, upgrade to Epic later.
For experienced investors who already know they want the full Motley Fool ecosystem, the Epic bundle is actually strong value—four services for roughly the price of two.
The worst choice? Subscribing to Rule Breakers for the excitement factor without understanding that 50%+ drawdowns are a feature, not a bug. That’s how you end up panic-selling at the bottom.
If neither service feels like the right fit, explore all available options in our guide to the best stock advisors. Also see: Stock Advisor vs Epic for the bundle comparison, or Stock Advisor vs Alpha Picks for an outside-the-Fool alternative.
Try Stock Advisor — $99/Year with 30-Day Guarantee
Frequently Asked Questions
Stock Advisor vs Rule Breakers: which is better?
Stock Advisor earns an EXCEPTIONAL fit rating for most investors. It has a longer track record (+978.9% vs +311.9%), a 66% win rate improving to 92.2% for 10+ year holds, 46 ten-baggers across 526 positions, a lower price ($99/year vs $299/year), standalone availability, and lower volatility (TraderHQ analysis of the published trade log, data as of Aug 31, 2026). In September 2026’s 210-point dispersion market (S&P 7,686, +13.1% YTD, Slickcharts Aug 31), Stock Advisor’s quality focus thrives—memory and cybersecurity are leading while ad-tech and enterprise software bleed. Rule Breakers’ conditions are mixed — VIX is calm at 14.92, but ~65% September hike odds after Jackson Hole pressure high-multiple growth. Rule Breakers’ 98.6% win rate for 10+ year holds edges past Stock Advisor’s 92.2%. Rule Breakers requires the Epic bundle, which includes Stock Advisor anyway.
Is Motley Fool Stock Advisor worth it?
Yes, for patient growth investors with 5+ year horizons. The +978.9% return since 2002 (versus a per-position S&P 500 benchmark averaging +214%) is real and verifiable, with 46 ten-baggers and 191 doublers across 526 positions (TraderHQ analysis of the published trade log, data as of Aug 31, 2026). The 66% overall win rate improves to 92.2% for 10+ year holds. The $99/year new member price is reasonable for the portfolio framework, Foundational Stocks list, and Moneyball database. The 30-day money-back guarantee means you can try it risk-free.
Is Motley Fool Rule Breakers worth it?
Yes, for aggressive investors who understand the volatility. The +311.9% return since 2004, 74% win rate across 217 positions, and massive winner-to-loser asymmetry (37 ten-baggers, 91 doublers; winners average +917.5% against a -36% average loss) demonstrate the strategy works—but only if you hold for 5-10+ years (TraderHQ analysis of the published trade log, data as of Aug 19, 2026). With ~65% September hike odds, entry conditions for high-multiple growth are choppier than they were a month ago. The catch: Rule Breakers isn’t available standalone. You must purchase the Epic bundle at $299/year, which includes Stock Advisor, Hidden Gems, and Dividend Investor.
Can I use both Stock Advisor and Rule Breakers?
Yes—and if you want Rule Breakers, you must use both. Rule Breakers is only available through the Epic bundle, which includes Stock Advisor. Many investors use Stock Advisor for core portfolio positions and Rule Breakers for aggressive growth exposure. The services are designed to complement each other: Stock Advisor provides the foundation, Rule Breakers adds the accelerator.
Why is Rule Breakers not available standalone?
Motley Fool restructured their offerings to bundle Rule Breakers into Epic membership alongside Stock Advisor, Hidden Gems, and Dividend Investor. The bundle approach provides access to multiple scorecards for different market conditions. At $299/year (promo), you’re effectively paying $75/year per service—less than Stock Advisor’s standalone price.
Which is better in 2026’s market: Stock Advisor or Rule Breakers?
Stock Advisor retains the edge; Rule Breakers’ fit is strong in the right growth, weak in a hike. The S&P 500 closed August at 7,686 (+13.1% YTD total return, Slickcharts Aug 31, 2026), and VIX sits at a calm 14.92. But the 210-point dispersion between winners (+168.7% average) and losers (-41.6% average) rewards Stock Advisor’s selection methodology. Energy (+38.4%) leads and Technology (+24.1%) is strong but internally split: memory/storage surging (SNDK +560%, MU +236%, WDC +162%) while ad-tech and software bleed (TTD -63.9%, APP -53.7%, INTU -45.8%). The Fed holds at 3.50-3.75%, but Chair Warsh’s Jackson Hole speech pushed September hike odds to ~60-65%, CPI runs at 3.4% (BLS, July), and the 10-year yield sits at a 19-month high of 4.76%. Rule Breakers’ innovation thesis is valid long-term (37 ten-baggers, +311.9% total return, and a 98.6% win rate at 10+ years prove it—data as of Aug 19, 2026). But a first hike of a new cycle is historically when high-multiple growth de-rates hardest. GARP still leads—and the hike risk widens that gap.
Can I use both Stock Advisor and Rule Breakers together?
Yes — and if you want Rule Breakers, you automatically get both. Rule Breakers is only available through the Epic bundle ($299/year), which includes Stock Advisor. The services complement each other: Stock Advisor provides the quality GARP foundation (46 ten-baggers, +978.9% total return, 92.2% win rate at 10+ years), while Rule Breakers adds aggressive growth exposure (37 ten-baggers, +311.9% total return, 98.6% win rate at 10+ years) (TraderHQ analysis of the published trade log, data as of Aug 31 and Aug 19, 2026). In 2026’s 210-point dispersion market with the VIX at 14.92, Stock Advisor picks provide stability while Rule Breakers positions offer asymmetric upside in memory, biotech, and chip equipment—with SNDK surging +560% while TTD drops -63.9%, selective opportunities exist within the tech bifurcation for patient holders.
Did David Gardner leave Rule Breakers?
David Gardner stepped back from making stock picks in May 2021, though he remains involved with The Motley Fool. The Rule Breakers analyst team now makes all recommendations. The investment philosophy remains the same—hunting disruptive innovators before they become obvious—but the personality of David’s individual picks is gone.