

You’re searching for Motley Fool alternatives, which means one of these is true:
You subscribed, and it didn’t work out. Maybe the 2021 picks are still underwater. Maybe you couldn’t stomach the volatility. Maybe the constant upsells to Epic Plus ($1,999/year) made you feel like a mark rather than a member.
Or you’re considering Motley Fool but want to compare before committing. Smart. The marketing pages all claim market-beating returns. You want to know what’s actually different.
Here’s what I’ve learned after 20+ years of investing and subscribing to most of these services with real money: the “best alternative” depends entirely on why you want an alternative.
Sometimes the answer is a different service entirely. Sometimes it’s a different Motley Fool product. And sometimes — this is the part no one wants to hear — the problem isn’t the service. It’s the investor.
Let me help you figure out which scenario is yours.
September 2026 Update: Hike Fear Meets a Hardware Melt-Up — Which Alternatives Survive Both?
The market narrative just shifted again. The S&P 500 closed August at 7,686 — up +13.1% YTD on a total-return basis (Slickcharts, Aug 31, 2026) — but the story underneath is a three-way split: memory and storage names up 75–560% (SanDisk +560%, Micron +236%, Seagate +201%), software and ad-tech down 20–64% (Trade Desk -63.9%, AppLovin -53.7%, Intuit -45.8%), and the mega-caps that carried 2023–24 treading water. Meanwhile the Fed turned hawkish: hike odds for the September 15–16 FOMC jumped from ~35% to ~60–65% after Chair Warsh’s Jackson Hole speech (CME FedWatch via CNBC).
Dispersion has reached 210 points — with the top 20 S&P stocks averaging +168.7% and the bottom 20 -41.6%. Moderna is up +376% YTD on a single Phase 3 readout. The Trade Desk has lost nearly two-thirds. Stock picking, not sector allocation, is driving 2026 returns.
Here’s the methodology scorecard:
- Quality GARP (growth at a reasonable price): Thriving. A possible September hike into a CAPE of ~40–42 (highest since September 2000) is exactly when recession-tested records stop being a slogan. Stock Advisor’s 978.9% total return across 526 positions with 46 ten-baggers and 191 doublers proves this methodology compounds through exactly this kind of tape (TraderHQ analysis of the published trade log, data as of Aug 31, 2026).
- Pure growth/momentum: Split down the middle. The right growth — memory, storage, AI servers, biotech — is soaring. The wrong growth — enterprise software, ad-tech — is down 20–64%. Growth as a bucket no longer exists in 2026.
- Quant/factor-based: Adapting, with a catch. Alpha Picks has reached 347.9% total return with a 66% win rate across 104 positions — but its 2026 vintage is running a 37.5% win rate as leadership rotated. Factor models catch both the rise and the fall.
- Moat/value: Finding opportunity. CAPE at ~40–42 means the broad market is expensive, but 210-point dispersion between winners (+168.7%) and losers (-41.6%) means pockets of value are hiding in plain sight.
The bond market confirms the setup: the 10-year Treasury hit 4.73% — a 19-month high of 4.76% on Aug 31 — as hike odds repriced, while credit spreads at 2.60% show zero systemic stress despite war and hike talk. Manufacturing (ISM 55.6, highest since May 2022) is booming into a possible hike — a genuinely unusual regime.
The question isn’t whether you need a stock-picking service — it’s whether your current service’s methodology survives both sides of this market: a hardware melt-up that rewards holding winners for years, and a hike decision that punishes anything priced for perfection. Alternatives with recession-tested, quality-focused discipline are thriving. Anything anchored to last year’s scoreboard is flying blind.
Time horizon matters more than ever:
- 1-3 year horizons: Alpha Picks (SITUATIONAL fit) with a 66% overall win rate and 347.9% total return across 104 positions — the 1-3-year cohort shows a 77.6% win rate, but the 2026 vintage (37.5% win rate) is the honest caveat
- 5+ year horizons: Stock Advisor (EXCEPTIONAL fit) with a 66% win rate, 92.2% for 10+ year holds, 46 ten-baggers, 191 doublers, and 978.9% total return across 526 positions (data as of Aug 31, 2026)
The Quick Answer: Best Motley Fool Alternatives Ranked
Alpha Picks is the best Motley Fool alternative for investors who want stock picks with 1-3 year horizons and prefer algorithms over analysts. The pure quant approach has delivered +347.9% total return since July 2022 across 104 positions with complete transparency on every pick (TraderHQ analysis of the published trade log, data as of Sep 1, 2026) — and its factor-based model catches whatever leadership the market offers, though 2026 has shown that rotation cuts both ways.
How We Did the Math
Every performance figure in this piece comes from our own computation over each publisher’s published trade log — entry-date closing prices, total returns including dividends, and a benchmark built as the average S&P 500 return over each pick’s individual holding period (not the index’s calendar-span return). This is official-computed analysis, not a third-party audit. The data has gaps, and we name them: Stock Advisor’s log covers 526 positions with 4 missing entry dates and thin sector classification; Alpha Picks’ log covers 104 positions with effectively no sector attribution and a handful of internally inconsistent figures we’ve flagged rather than silently reconciled. Where a figure comes from the publisher’s own scorecard instead, we say so and date it.
One frame governs all of it: A service’s published record belongs to the picks; your record belongs to your entries, your exits, and your temperament. The distance between those two numbers is where almost all subscriber disappointment lives.
| Rank | Service | Best For | Methodology | Price | Why It’s Different |
|---|---|---|---|---|---|
| 🥇 | Alpha Picks | 1-3 year horizons | Pure Algorithm | $449/yr | 66% win rate, 77.6% for 1-3 years |
| 🥈 | Morningstar Investor | DIY analysts | 40+ years recession-tested | $199/yr | Build capability, not dependency |
| 🥉 | TipRanks | Budget-conscious | Expert Tracking | $99/yr | Know which analysts are actually right |
| 4 | Zacks Premium | Earnings-focused | Earnings Quant | $249/yr | 37-year methodology |
| 5 | SA Premium | Research junkies | Crowd-Sourced | $269/yr | 18,000+ contributor perspectives |
| 6 | Rule Breakers | Aggressive MF fans | Analyst-Led | $299/yr | More volatility, more upside |
The Scenario Cheat Sheet
Why do you want an alternative?
- “MF is too expensive” → Stock Advisor is $99/yr. That’s not expensive. If you mean Epic ($299 new members, $499 renewal) or Epic Plus ($1,999), try TipRanks ($99) or stick with base Stock Advisor.
- “The volatility is killing me” → Morningstar’s Fair Value approach is more conservative. But honestly? You might need index funds, not a different stock-picking service.
- “I don’t trust human analysts” → Alpha Picks is pure quant. No analyst discretion. The algorithm picks, you follow.
- “I want to pick my own stocks” → Morningstar, TipRanks, or SA Premium give you tools, not picks. Different product category entirely.
- “The 2021 picks are still down” → So are everyone’s 2021 growth picks. That’s not a Motley Fool problem; that’s a market problem.
- “I want MORE aggressive picks” → Rule Breakers (via Epic) is MF’s growth-hunting arm. +311.9% since 2004, 37 ten-baggers (data as of Aug 19, 2026).
Wait — Before You Switch
Here’s the uncomfortable question: Is Motley Fool actually the problem?
I’ve seen this pattern hundreds of times. Someone subscribes to Stock Advisor. The first pick drops 20%. They panic-sell. Then they blame the service and search for alternatives. They subscribe to something else. Same thing happens. Repeat.
The service isn’t the problem. The investor behavior is. There’s a name for this: Buying after gains and selling after losses is the largest expense most portfolios carry — bigger than any fee we’ve ever put next to it. Every product we recommend is, at best, a partial defense against it.
Stock Advisor’s track record is real: +978.9% since 2002 across 526 positions (TraderHQ analysis of the published trade log, data as of Aug 31, 2026). But that return required holding through Netflix dropping 80%, Amazon dropping 90%, and dozens of picks that went to zero. And the record only works with its whole book attached: Any winning number travels with its whole book: loser share, average loss, and the counting method — closed trades or open — stated in the same sentence. A highlight without its denominator is marketing, not evidence. So here’s the whole book: 34% of picks lose, the average loss is -44.5%, and the 92.2% win rate on 10+ year holds becomes a 52.2% win rate for picks under a year old. NVDA (April 2005) is up +133,425%. SKLZ (March 2021) lost 99%. Both are in the same book.
The key insight: Stock Advisor is optimized for 5+ year horizons. If your time horizon is 1-3 years, Alpha Picks’ 77.6% win rate in that window across 104 positions may be a better fit.
If you can’t hold through drawdowns, no stock-picking service will work for you. Not Motley Fool. Not Alpha Picks. Not Zacks. The alternative you need is a low-cost index fund and the discipline to stop checking your portfolio.
But if you’ve genuinely given MF a fair shot (5+ years, held through volatility, followed the framework) and it’s not working for your style — then yes, let’s find you a real alternative.
Understanding the Alternatives Landscape
Before diving into rankings, understand what you’re choosing between. These aren’t all the same type of product:
Stock-Picking Services tell you exactly what to buy. They provide specific recommendations with conviction rankings. You follow their picks.
- Examples: Alpha Picks, Stock Advisor, Rule Breakers
Research Platforms give you tools to make your own decisions. They provide data, ratings, and analysis, but you do the picking.
- Examples: Morningstar Investor, TipRanks, Seeking Alpha Premium, Zacks Premium
The key question: Do you want someone to tell you what to buy? Or do you want to become a better stock picker yourself?
If you want picks, Alpha Picks is your alternative. If you want capability, Morningstar or TipRanks is your path.
1. Alpha Picks — The Quant Alternative

Data-driven investors who trust algorithms over human opinion
If you’re leaving Motley Fool because you don’t trust human analysts, Alpha Picks is the answer. Pure quantitative stock selection. No analyst discretion. No narrative. Just math.
This is genuinely different from Motley Fool. Stock Advisor is analyst-led — humans read 10-Ks, visit companies, and make judgment calls. Alpha Picks is algorithm-led — a quantitative model screens for factors and spits out two picks per month. No human touches the selection.
The Track Record
The numbers are impressive — and fully transparent (TraderHQ analysis of the published trade log, data as of Sep 1, 2026):
- +347.9% cumulative return since July 2022 across 104 positions
- 66% overall win rate
- 77.6% win rate for 1-3 year holds — the sweet spot for this service
Every pick, every return, winners AND losers — all visible on their performance page. That transparency is rare.
The position-level reality, winners and losers alike: MU (October 2025) is up +402.58% in 11 months. CLS (October 2023) is up +996.7%. And ICHR (July 2026) is down -51.36% after two months. The 2026 vintage as a whole is underwater — a -6% average with a 37.5% win rate — which is either the normal ugliness of young picks or a warning; the data can’t yet tell you which.
But here’s the honest part: 4.2 years is not 24.5 years. Stock Advisor has survived multiple market cycles. Alpha Picks has survived one. We don’t know how the model performs in a prolonged downturn.
This is why time horizon matters: Alpha Picks excels for 1-3 year horizons (77.6% win rate). For 5+ year horizons, Stock Advisor’s 92.2% win rate on 10+ year holds with 46 ten-baggers and 191 doublers remains compelling.
How It Works
Two new picks per month, selected by Seeking Alpha’s quantitative model. The algorithm screens for value, growth, momentum, profitability, and earnings revisions. You get a ticker and a brief thesis. No deep-dive analyst reports.
The model also issues “re-recommendations” — signals to add to existing positions. These have averaged +251.2% returns vs. +36.3% for single picks (data as of Sep 1, 2026). The algorithm knows when to double down.
Pricing
$449/year (promotional) or $499/year regular. No money-back guarantee — all sales final. That’s a real commitment compared to MF’s 30-day refund policy.
Best For
Investors with 1-3 year horizons who trust algorithms over human judgment. The 77.6% win rate in that window is exceptional. If you believe emotions and narratives bias stock selection, and you want a systematic, data-driven approach, this is your service.
The Trade-Off
You won’t understand why specific stocks are picked. The methodology is a black box. If you need conviction to hold through drawdowns, the lack of narrative might hurt you. Alpha Picks doesn’t teach you to become a better investor — it just tells you what to buy.
Also: no portfolio construction guidance. You get picks, not a framework for how to allocate. And only 4.2 years of data vs. Stock Advisor’s 24.5 years — with the 2026 vintage underwater and the model untested in a rate-hike cycle.
For a deeper analysis of how Alpha Picks compares to Stock Advisor, see our Alpha Picks review.
2. Morningstar Investor — The Capability Builder

Morningstar Investor isn’t a Motley Fool alternative in the traditional sense. It’s a completely different product category. MF tells you what to buy. Morningstar gives you the tools to decide for yourself.
If you’re frustrated with following someone else’s picks and want to develop your own investment capability, this is the path.
What You Get
Fair Value Estimates — Morningstar’s analysts calculate intrinsic value for thousands of stocks. You can screen for stocks trading below fair value — the ones the market is underpricing.
Economic Moat Ratings — Assessment of competitive advantages. Wide moat, narrow moat, no moat. This helps you identify businesses with durable edges that can compound for decades.
40+ Years Recession-Tested — Morningstar’s methodology has been trusted through multiple market cycles. The quality/moat focus is the industry standard for fundamental analysis.
Portfolio X-Ray — Upload your holdings and see your true allocation, performance, fees, and stock overlaps across all accounts. Understand what you actually own.
200+ Screening Criteria — Build custom screens based on valuation, growth, quality, and moat metrics.
How It’s Different From MF
Stock Advisor says “buy Netflix.” Morningstar says “Netflix is trading 15% below our $650 fair value estimate, has a narrow economic moat, and scores 4/5 on capital allocation.” You decide whether to buy.
This requires more work. You’re not following a system — you’re building one. But the result is capability, not dependency. After a year with Stock Advisor, you can follow picks. After a year with Morningstar, you can analyze stocks.
Pricing
$199/year (promotional) or $249/year regular. 7-day free trial to test the platform.
Best For
DIY researchers and value investors who want professional-grade research tools with 40+ years of recession-tested methodology. You have the time and interest to do your own analysis. You want to understand why a stock is attractive, not just which stock to buy.
The Trade-Off
This is not a stock-picking service. There are no “buy this” recommendations. If you want someone to tell you what to do, Morningstar will frustrate you. You must do the work.
Also: the learning curve is real. Fair Value methodology, moat analysis, portfolio construction — it takes time to use these tools effectively.
See our complete Morningstar Investor review for detailed feature analysis and user experience insights.
See Morningstar’s Fair Value Ratings
3. TipRanks — The Value Play

TipRanks answers a question most investors never think to ask: Which analysts are actually accurate?
Wall Street produces thousands of stock ratings. Buy, sell, hold. But nobody tracks which analysts are right. TipRanks does. They’ve built a database of 96,000+ financial experts — analysts, bloggers, hedge funds, insiders — ranked by their actual historical performance.
At $99/year for Premium, it’s the most affordable research tool on this list.
What You Get
Expert Performance Tracking — See any analyst’s track record before following their recommendation. That Goldman Sachs analyst upgrading a stock? TipRanks shows their historical success rate and average return.
Smart Score — AI-powered 1-10 rating that combines analyst ratings, insider trading, hedge fund activity, blogger sentiment, and more. High Smart Scores have historically outperformed.
Broker Integration — Connect your brokerage accounts for automatic portfolio analysis.
How It’s Different From MF
Motley Fool gives you their analysts’ picks. TipRanks helps you evaluate any analyst’s picks. It’s meta-level — a tool for assessing the people who make recommendations, not a recommendation service itself.
This is useful if you’re already getting stock ideas from multiple sources (CNBC, newsletters, Reddit) and want to filter signal from noise. Which of these sources has actually been right?
Pricing
$99/year for Premium (basic features) or $299/year for Ultimate (full access). 30-day money-back guarantee.
Best For
Budget-conscious investors who want research tools without paying $200+. Also useful for investors who consume stock ideas from multiple sources and want to verify credibility.
The Trade-Off
TipRanks doesn’t tell you what to buy. It helps you evaluate other people’s recommendations. If you want picks, this isn’t it.
Also: the Smart Score methodology isn’t fully disclosed. You’re trusting their algorithm without understanding exactly how it works.
Read our TipRanks Premium review for a complete breakdown of features and performance tracking capabilities.
See TipRanks’ Top-Rated Analysts
4. Zacks Premium — The Earnings Quant

Zacks is built on one core insight: earnings estimate revisions predict stock performance.
When analysts raise their earnings estimates for a company, the stock tends to outperform. When they lower estimates, it tends to underperform. This isn’t theory — it’s backed by academic research dating to the 1970s.
The Zacks Rank (1-5 scale) rates every stock based on earnings estimate revisions, magnitude of changes, analyst agreement, and earnings surprise history. It’s been in continuous use since 1988 — 37 years of methodology refinement.
How It Works
Zacks Rank updates daily based on new earnings estimate data. A #1 “Strong Buy” means analysts are aggressively raising estimates. A #5 “Strong Sell” means they’re cutting.
You can screen for #1-ranked stocks, filter by sector, and build portfolios around the methodology. It’s a quant approach, but focused specifically on earnings rather than the multi-factor model Alpha Picks uses.
How It’s Different From MF
Stock Advisor’s analysts read annual reports and visit companies. Zacks’ algorithm reads earnings estimates and calculates revisions. It’s a completely different input.
If you believe earnings ultimately drive stock prices (they do, over time), Zacks’ approach has theoretical merit. The question is whether their implementation captures the edge.
Pricing
$249/year with a 30-day money-back guarantee.
Best For
Earnings-focused investors who believe estimate revisions predict returns. If you follow earnings season religiously and want a systematic way to act on that data, Zacks fits.
The Trade-Off
The platform is overwhelming. Zacks throws an enormous amount of content at you — articles, ratings, portfolios, webinars. It’s hard to know where to focus.
Also: aggressive upselling. Zacks will constantly push you toward higher-tier products. The marketing is relentless.
For a detailed analysis of Zacks’ earnings-focused methodology, see our Zacks Premium review.
5. Seeking Alpha Premium — The Opinion Buffet
Seeking Alpha Premium gives you access to 18,000+ contributing analysts and their research. It’s crowd-sourced investment analysis — the opposite of Motley Fool’s curated, institutional approach.
This is for investors who want diverse perspectives, not a single source of truth.
What You Get
Unlimited Contributor Articles — Deep dives on individual stocks from investors who actually own them. Some are professional analysts. Some are retail investors with domain expertise. Quality varies wildly.
Quant Ratings — Proprietary factor grades for 10,000+ stocks. Value, Growth, Profitability, Momentum, EPS Revisions — each stock gets letter grades.
Earnings Call Transcripts — Full transcripts with analyst questions and management responses.
Broker Linking — Connect accounts for automatic portfolio updates.
How It’s Different From MF
Stock Advisor gives you two picks per month from a hired analyst team. SA Premium gives you thousands of opinions from a crowd of contributors. You’re trading curation for volume.
Some SA contributors are excellent. Some are terrible. Learning to filter is part of the value — and part of the work.
Pricing
$269/year (promotional) or $299/year regular. 7-day free trial.
Best For
Research junkies who want diverse opinions. If you enjoy reading multiple perspectives on a stock before making a decision, SA Premium delivers volume.
The Trade-Off
This is not a stock-picking service. If you want specific “buy this” recommendations, you need Alpha Picks (separate subscription). SA Premium is research, not picks.
Also: quality control is minimal. Anyone can become a contributor. You must develop your own filter for what’s worth reading.
Learn more in our Seeking Alpha Premium review covering the full platform ecosystem.
See Seeking Alpha’s Latest Research
6. Rule Breakers (via Epic) — The Internal Alternative

Aggressive investors comfortable with high volatility in disruptive sectors
Here’s the scenario I see often: Someone subscribes to Stock Advisor, finds the picks too conservative, and searches for alternatives. They want more aggressive growth exposure.
The alternative they’re looking for isn’t a competitor. It’s Rule Breakers.
Rule Breakers is Motley Fool’s growth-hunting arm. While Stock Advisor focuses on quality compounders, Rule Breakers targets disruptive innovators — the companies rewriting industry rules. Higher risk, higher potential reward.
Motley Fool Rule Breakers Performance
The Motley Fool · 217 picks · 22 years · Updated 2026-08-19
| RB Return | S&P 500 | Alpha | Win Rate |
|---|---|---|---|
| +312% | +186% | +126% | 74% |
S&P 500 shows what you'd have earned buying the index on each pick date instead. Same timing, fair comparison.
| RB Multi-Baggers | 10x+ | 5x+ | 3x+ | 2x+ |
|---|---|---|---|---|
| Count | 37 | 65 | 90 | 105 |
| RB Asymmetry | Avg Winner | Avg Loser | Ratio |
|---|---|---|---|
| Return | +918% | -36% | ~25:1 |
Best Performers (All-Time)
| RB Pick | Return |
|---|---|
 MNST MNST | +3.2K% |
 VRTX Vertex Pharma | +4.8K% |
 TSLA Tesla | +16K% |
 MELI MercadoLibre | +13K% |
 GOOGL Alphabet (Google) | +3.1K% |
 PANW Palo Alto Networks | +3.2K% |
 ANET Arista Networks | +4.3K% |
 ISRG Intuitive Surgical | +7.9K% |
 SHOP Shopify | +7.0K% |
 AVGO Broadcom | +3.2K% |
37 ten-baggers. These 1,000%+ winners—NVDA, NFLX, AMZN—are what drive the portfolio. You don't need to pick all winners; you need a few massive ones.
See All Rule Breakers Recommendations →Latest Rule Breakers Picks
Tickers masked to protect subscriber value. Recent picks need 3-5+ years to demonstrate thesis.
| RB Pick | Return |
|---|---|
**** Life Sciences Software | +42% |
**** Growth Company | +21% |
**** Growth Company | +17% |
**** Growth Company | +14% |
**** Growth Company | +6% |
**** Social Platform | -11% |
**** Growth Company | -12% |
**** RNA Therapeutics | -18% |
**** Growth Company | -34% |
**** Growth Company | -34% |
Early results mislead. < 1 year: 41.7% win rate. 10+ years: 98.6%. That 57-point gap explains why judging picks early leads to selling future winners.
Rule Breakers Win Rate by Holding Period
| Hold Time | RB Win Rate | Avg Return |
|---|---|---|
| < 1 Year | 41.7% | -7% |
| 1-3 Years | 61.3% | +47% |
| 3-5 Years | 55.3% | +60% |
| 5-10 Years | 69.8% | +212% |
| 10+ Years | 98.6% | +1.8K% |
Time is the strategy. 10+ year picks show 98.6% win rate with +1.8K% average returns. Same methodology, same picks—time transforms the results.
Rule Breakers Performance by Year
| Year | RB Picks | Avg Return | Win Rate | |
|---|---|---|---|---|
| 2026 | 9 | +2% | 63% | VEEV+42% |
| 2025 | 12 | +1% | 42% | BBIO+99% |
| 2024 | 16 | +63% | 69% | GH+430% |
| 2023 | 19 | +69% | 58% | CRWD+647% |
| 2022 | 19 | +75% | 63% | ANET+678% |
| 2021 | 16 | +39% | 44% | CRWD+210% |
| 2020 | 13 | -16% | 31% | ISRG+100% |
| 2019 | 14 | +118% | 64% | DDOG+661% |
| 2018 | 13 | +403% | 92% | AXON+1.3K% |
| 2017 | 9 | +387% | 89% | TWLO+687% |
| 2016 | 14 | +1.4K% | 100% | SHOP+7.0K% |
| 2015 | 5 | +652% | 80% | AXON+2.5K% |
| 2014 | 11 | +1.1K% | 100% | ANET+4.3K% |
| 2013 | 8 | +456% | 100% | AX+912% |
| 2012 | 8 | +1.4K% | 100% | META+2.4K% |
| 2011 | 4 | +4.5K% | 100% | TSLA+16K% |
| 2010 | 2 | +323% | 100% | OLED+423% |
| 2009 | 7 | +3.4K% | 100% | MELI+13K% |
| 2008 | 4 | +1.6K% | 100% | ISRG+2.8K% |
| 2007 | 7 | +1.1K% | 100% | CMG+2.7K% |
| 2006 | 1 | +3.3K% | 100% | ISRG+3.3K% |
| 2005 | 6 | +3.4K% | 100% | ISRG+7.9K% |
The Track Record
- +311.9% cumulative return since 2004 across 217 positions (TraderHQ analysis of the published trade log, data as of Aug 19, 2026)
- 21.9 years of documented performance
- 105 picks doubled, 37 ten-baggers, 74% win rate
The asymmetric math is explicit: winners average +917.5%, losers average -36%. The massive asymmetry builds wealth even when you have more losers than winners.
But the volatility is brutal. The 2020 vintage averaged -16% with a 31% win rate — RKT fell 77% and UPST (2021) fell 91%. If Stock Advisor’s volatility bothered you, Rule Breakers will be worse.
How to Access
Rule Breakers is no longer available standalone. You get it through Epic ($299/year), which bundles:
- Stock Advisor (2 picks/month)
- Rule Breakers (2 picks/month)
- Hidden Gems (1 pick/month)
- Dividend Investor (periodic picks)
That’s 5 picks per month across different strategies for $299/year — $100 more than Stock Advisor alone.
Best For
Aggressive investors who want to stay in the Motley Fool ecosystem but want more growth exposure. You have a genuine 5+ year horizon and can stomach 50%+ drawdowns on individual positions.
The Trade-Off
If you couldn’t handle Stock Advisor’s volatility, Rule Breakers will be worse. This is not for the faint of heart. Also: David Gardner (the founder) stepped back from active picking in May 2021. The analyst team now manages recommendations.
For a detailed comparison of Rule Breakers vs Stock Advisor, see our Rule Breakers vs Stock Advisor comparison.
The Allocation Reality
Here’s the framework I use — and recommend to anyone asking about stock-picking services:
90% Core: Low-cost index funds. Total market, international, maybe some bonds depending on your age. This is your foundation. It doesn’t require a subscription, and it beats most active managers over time.
10% Explore: Stock-picking services. This is where you try to generate alpha. If it works, great. If it doesn’t, you haven’t blown up your portfolio.
Why 10%? Because even the best stock-picking services have drawdowns. Stock Advisor’s 2021 vintage averaged -13%. Alpha Picks’ 2026 vintage is underwater (-6% average). If your entire portfolio is in individual stocks, you’ll feel every bump.
The math on subscription costs:
| Portfolio Size | 10% Explore | Stock Advisor ($99) as % | Alpha Picks ($449) as % |
|---|---|---|---|
| $25,000 | $2,500 | 4.0% | 18.0% |
| $50,000 | $5,000 | 2.0% | 9.0% |
| $100,000 | $10,000 | 1.0% | 4.5% |
| $250,000 | $25,000 | 0.4% | 1.8% |
If your explore bucket is $50,000, Stock Advisor’s $99 fee is 2% of that allocation annually. That’s reasonable. Alpha Picks at $449 is 9% — you need to generate serious alpha to justify that cost.
If your explore bucket is $5,000, even Stock Advisor’s $99 fee is 2% of your total portfolio. Consider waiting until you’ve built a larger base.
The Decision Matrix
Still stuck? Use this:
| If you… | Choose… | Because… |
|---|---|---|
| Trust algorithms over analysts | Alpha Picks | Pure quant, no human discretion |
| Want to pick your own stocks | Morningstar Investor | Tools and data, not picks |
| Are budget-conscious ($99/yr max) | TipRanks | Best value research platform |
| Follow earnings estimates religiously | Zacks Premium | 37-year earnings-focused methodology |
| Want diverse opinions | SA Premium | 18,000+ contributor perspectives |
| Want more aggressive MF picks | Rule Breakers (Epic) | Stay in ecosystem, more growth focus |
| Are happy with MF but want cheaper | Stock Advisor | It’s $99/yr. That’s already cheap. |
| Can’t handle any volatility | Index funds | No stock-picking service will help |
FAQ: Motley Fool Alternatives
What’s the best Motley Fool alternative overall?
It depends on your time horizon:
- 1-3 year horizons: Alpha Picks (SITUATIONAL fit) with a +347.9% total return since July 2022 across 104 positions, a 66% win rate, and a 77.6% win rate for 1-3 year holds — but the 2026 vintage (37.5% win rate) is the honest caveat (TraderHQ analysis of the published trade log, data as of Sep 1, 2026).
- DIY researchers: Morningstar Investor (EXCEPTIONAL fit in Sept 2026) with 40+ years of recession-tested methodology. Fair value discipline at CAPE ~40-42 — the highest since September 2000 — has never been more relevant. The 10-year yield at 4.73% (a 19-month high) and CPI at 3.4% with a ~65% September hike probability validate their independent fundamental analysis approach.
- 5+ year horizons: Honestly, Stock Advisor (EXCEPTIONAL fit) may still be your best option with 978.9% total return across 526 positions, a 92.2% win rate on 10+ year holds, 46 ten-baggers, and 191 doublers (data as of Aug 31, 2026).
See our Alpha Picks vs Motley Fool comparison for a detailed breakdown.
Is Alpha Picks better than Motley Fool?
It depends on your time horizon:
- 1-3 year horizons: Alpha Picks excels with a 77.6% win rate and +347.9% returns across 104 positions.
- 5+ year horizons: Stock Advisor dominates with a 92.2% win rate on 10+ year holds, 46 ten-baggers, and 191 doublers across 526 positions.
Alpha Picks has 4.2 years of data; Stock Advisor has 24.5 years. Alpha Picks removes human bias; Stock Advisor builds conviction through detailed theses. Neither is objectively “better” — they’re optimized for different time horizons. We’ve detailed this in our Stock Advisor vs Alpha Picks comparison.
What’s the cheapest Motley Fool alternative?
TipRanks Premium at $99/year is the most affordable research tool. However, Stock Advisor itself is $99/year for new members — if you want stock picks specifically, MF is already competitively priced. The “expensive” perception comes from Epic ($299 new members, $499 renewal) and Epic Plus ($1,999) upsells.
Are Motley Fool alternatives worth it?
Yes, if you’ve genuinely tried MF for 3-5 years and the methodology doesn’t fit your style. No, if you’re switching because of short-term losses — every service has drawdowns. The question isn’t “is this alternative better?” but “is this alternative better for me?”
Stock Advisor vs Alpha Picks — which should I choose?
Match your time horizon:
- 5+ year horizons: Stock Advisor — 24.5-year track record (+978.9%) across 526 positions, 92.2% win rate on 10+ year holds, 46 ten-baggers, 191 doublers, detailed theses that build conviction
- 1-3 year horizons: Alpha Picks — 77.6% win rate for 1-3 year holds, +347.9% since 2022 across 104 positions, pure quant approach
Stock Advisor uses human analysts with narrative reasoning; Alpha Picks is pure quant with no human discretion. Alpha Picks has only 4.2 years of data — a legitimate caveat for long-term investors. Read our Stock Advisor vs Alpha Picks comparison for the full analysis.
Can I use multiple stock-picking services?
Yes, but be careful of overlap. Stock Advisor and Alpha Picks will occasionally recommend the same stocks. If you’re using multiple services, track your overall portfolio allocation — you don’t want 40% in one stock because three services all recommended it.
What if I just want to do my own research?
Then you don’t want a stock-picking service at all. Morningstar Investor ($199/yr) gives you 40+ years of recession-tested methodology with Fair Value estimates and Moat ratings — best for DIY researchers and value investors. TipRanks ($99/yr) helps you verify analyst credibility. SA Premium ($269/yr) provides diverse contributor perspectives. These are research tools, not recommendation services. See our Morningstar Investor review for a detailed breakdown of research capabilities.
Why do Motley Fool picks lose money?
Because stock picking is hard. Even Stock Advisor’s 24.5-year track record across 526 positions includes losers. The 52.2% first-year win rate means roughly half of picks are underwater after 12 months. The service works because the 92.2% win rate on 10+ year holds with 46 ten-baggers vastly outweighs short-term losses. If you’re judging by first-year performance, you’re measuring wrong. Stock Advisor is optimized for 5+ year horizons.
Should I cancel Motley Fool?
Not if you’ve been a member for less than 5 years. Stock Advisor’s track record requires long holding periods — the 92.2% win rate on 10+ year holds with 46 ten-baggers becomes 52.2% in year one. If you’ve given it 5+ years and the methodology genuinely doesn’t fit your style, then yes, consider alternatives. But if you’re leaving because of 2021-2022 losses, you’re likely to repeat the same pattern elsewhere. If your issue is time horizon (you want 1-3 year results), Alpha Picks’ 77.6% win rate in that window across 104 positions may be a better fit.
How do Motley Fool alternatives compare in 2026’s stock picker’s market?
The 2026 market strongly favors quality-focused and recession-tested approaches. With 210-point dispersion between winners (+168.7%) and losers (-41.6%), stock selection drives everything. The S&P 500 closed August at 7,686, up 13.1% YTD on a total-return basis (Slickcharts, Aug 31, 2026), but the gains are brutally split — memory/storage (SNDK +560%, MU +236%), refiners (MPC +130%), and cybersecurity are soaring while software and ad-tech are down 20–64% (INTU -45.8%, TTD -63.9%). Here’s how the alternatives stack up:
- Stock Advisor (EXCEPTIONAL fit): 978.9% total return across 526 positions with 46 ten-baggers (data as of Aug 31, 2026). Quality GARP methodology plus 2008/2020/2022 proof is exactly what a ~65% September hike probability demands.
- Morningstar (EXCEPTIONAL fit): Fair value discipline at CAPE 40–42 — the highest since September 2000 — identifies what’s actually cheap while the VIX sits at 14.92 and bearish sentiment runs 44.4%. The bond market (10-year at 4.73%, a 19-month high) is pricing the hike risk in.
- Zacks (GOOD fit): Manufacturing expansion (ISM 55.6, highest since May 2022) supports the earnings momentum approach in a trending hardware cycle (Energy +38.4%, Technology +24.1%).
- Alpha Picks (SITUATIONAL fit): 347.9% total return, 66% win rate across 104 positions — but the 2026 vintage is running a 37.5% win rate as leadership rotated. Quant factors catch both the rise and the fall.
- TipRanks (GOOD fit): Analyst tracking helps filter signal from noise in a market this split.
Which stock picking service is best for the current market?
For the split tape dominating 2026, Stock Advisor and Morningstar lead. Memory/storage (SNDK +560%, MU +236%), refiners (MPC +130%), and cybersecurity are leading while enterprise software (INTU -45.8%) and ad-tech (TTD -63.9%) crater. The S&P 500 closed August at 7,686 (+13.1% YTD total return), as the VIX sits calm at 14.92 — but ~60-65% hike odds for the September FOMC make the Fed the regime decision. Manufacturing ISM at 55.6 (highest since May 2022) shows the real economy booming into a possible hike. Credit spreads at 2.60% confirm no systemic stress. Stock Advisor’s GARP methodology naturally favors quality companies with durable advantages — exactly the profile that survives a hike. Its 978.9% total return across 526 positions validates through-cycle discipline (data as of Aug 31, 2026). Morningstar’s fair value estimates help identify undervalued opportunities at CAPE 40–42, where downside names need a thesis, not a stop-loss. For a quant-driven approach, Alpha Picks’ factor model has delivered (347.9% total return across 104 positions) — though its 2026 vintage (37.5% win rate) shows rotation cuts both ways. The worst fit for current conditions: anything priced for perfection with no recession-tested record, because a first hike into CAPE 42 is historically where unprotected growth de-rates hardest.
The Bottom Line
You came here looking for Motley Fool alternatives. Let me give you the honest answer:
If you want picks with 1-3 year horizons: Alpha Picks. Pure quant, +347.9% since 2022 across 104 positions, 77.6% win rate for 1-3 year holds.
If you want to become a better investor: Morningstar Investor. 40+ years recession-tested methodology. Tools, not picks. Capability, not dependency.
If you want the cheapest research tool: TipRanks at $99/year.
If you want more aggressive MF exposure: Epic ($299) gives you Rule Breakers + Stock Advisor.
If you can’t handle volatility: No stock-picking service will help. Index funds are your answer.
But here’s the thing most “alternatives” articles won’t tell you: Motley Fool Stock Advisor at $99/year is already one of the best values in the industry for 5+ year horizons. The 24.5-year track record is real. The +978.9% total return across 526 positions is documented (TraderHQ analysis of the published trade log, data as of Aug 31, 2026). The 92.2% win rate on 10+ year holds with 46 ten-baggers and 191 doublers proves the methodology works for patient investors. And with September 2026’s 210-point dispersion — where winners average +168.7% and losers average -41.6% while the S&P sits at 7,686 — Stock Advisor’s quality GARP approach earns an EXCEPTIONAL fit rating. A ~65% September hike probability into CAPE 40–42, manufacturing ISM at 55.6, and credit spreads at 2.60% with no systemic stress: this is a market that punishes anything priced for perfection and rewards records with 2008/2020/2022 receipts. When leadership splits three ways — memory and biotech up 236–560%, software down 20–64%, mega-caps treading water — the services that hold winners for years pull ahead. Stock Advisor’s through-cycle proof matters more than ever.
If you’re leaving because of short-term losses, you’ll probably repeat the same pattern with whatever you switch to. The alternative you need isn’t a different service — it’s a different relationship with volatility.
If you’ve genuinely given MF a fair shot and the methodology doesn’t fit your style, then yes — Alpha Picks, Morningstar, or TipRanks might be better matches.
But if you’re just frustrated that your 2021 picks are still underwater… welcome to the club. That’s not a Motley Fool problem. That’s a growth-stock problem. And switching services won’t fix it.
The best investment decision isn’t always switching. Sometimes it’s staying — with more patience.
The split between memory/storage up 236–560% and software down 20–64% proves the point: methodology matters more than brand loyalty. Manufacturing ISM at 55.6 (highest since May 2022) shows the real economy booming even as hike odds hit ~65%. The VIX sits calm at 14.92 while the S&P 500 closes August at 7,686. But AAII bears at 44.4% mean retail investors are frozen on the sidelines while the market climbs. Quality GARP approaches are thriving — Stock Advisor’s 978.9% total return validates the methodology (data as of Aug 31, 2026). The wrong growth is suffering — enterprise software is down 20–64% even as the broader market rallies. Quant models are adapting — Alpha Picks’ 347.9% total return shows factor-based approaches capture the winners, though its 2026 vintage (37.5% win rate) shows rotation cuts both ways. Moat-focused value is finding opportunity in a CAPE 40–42 market where a possible first hike of a new cycle makes fair-value discipline more valuable, not less. With 210-point dispersion and credit spreads at 2.60% confirming no systemic stress, the service whose methodology survives both the melt-up and the hike decision will capture the most alpha. Choose based on approach, not name recognition — and commit to it.
Alpha Picks by Seeking Alpha Performance
Seeking Alpha · 104 picks · 4 years · Updated 2026-09-01
| AP Return | S&P 500 | Alpha | Win Rate |
|---|---|---|---|
| +348% | +104% | +244% | 66% |
S&P 500 shows what you'd have earned buying the index on each pick date instead. Same timing, fair comparison.
| AP Multi-Baggers | 10x+ | 5x+ | 3x+ | 2x+ |
|---|---|---|---|---|
| Count | 1 | 4 | 12 | 19 |
| AP Asymmetry | Avg Winner | Avg Loser | Ratio |
|---|---|---|---|
| Return | +122% | -22% | ~6:1 |
Best Performers (All-Time)
| AP Pick | Return |
|---|---|
 SMCI Super Micro Computer | +969% |
**** Thermal Management | +348% |
 STRL Sterling Construction | +653% |
 POWL Powell Industries | +887% |
**** Homebuilder | +228% |
**** Power Plant Construction | +357% |
**** Casual Dining | +346% |
 CLS Celestica | +1.2K% |
**** Memory Chips | +403% |
 APP AppLovin | +1.6K% |
Latest Alpha Picks Picks
Tickers masked to protect subscriber value. Recent picks need 3-5+ years to demonstrate thesis.
| AP Pick | Return |
|---|---|
**** Memory Chips | +403% |
**** Circuit Board Manufacturing | +102% |
**** Growth Company | +75% |
**** Growth Company | +74% |
**** Gold Mining | +44% |
**** Growth Company | +42% |
**** Growth Company | +26% |
**** Growth Company | +26% |
**** Connectivity Chips | +26% |
**** Growth Company | +11% |
Alpha Picks Win Rate by Holding Period
| Hold Time | AP Win Rate | Avg Return |
|---|---|---|
| < 1 Year | 47.6% | +10% |
| 1-3 Years | 77.6% | +95% |
| 3-5 Years | 100% | +437% |
| 5-10 Years | N/A% | N/A |
| 10+ Years | N/A% | N/A |
Alpha Picks Performance by Year
| Year | AP Picks | Avg Return | Win Rate | |
|---|---|---|---|---|
| 2026 | 16 | -6% | 38% | LITE+42% |
| 2025 | 24 | +59% | 75% | MU+403% |
| 2024 | 24 | +65% | 67% | EAT+346% |
| 2023 | 24 | +155% | 71% | CLS+997% |
| 2022 | 16 | +65% | 75% | MOD+348% |
Inside Alpha Picks
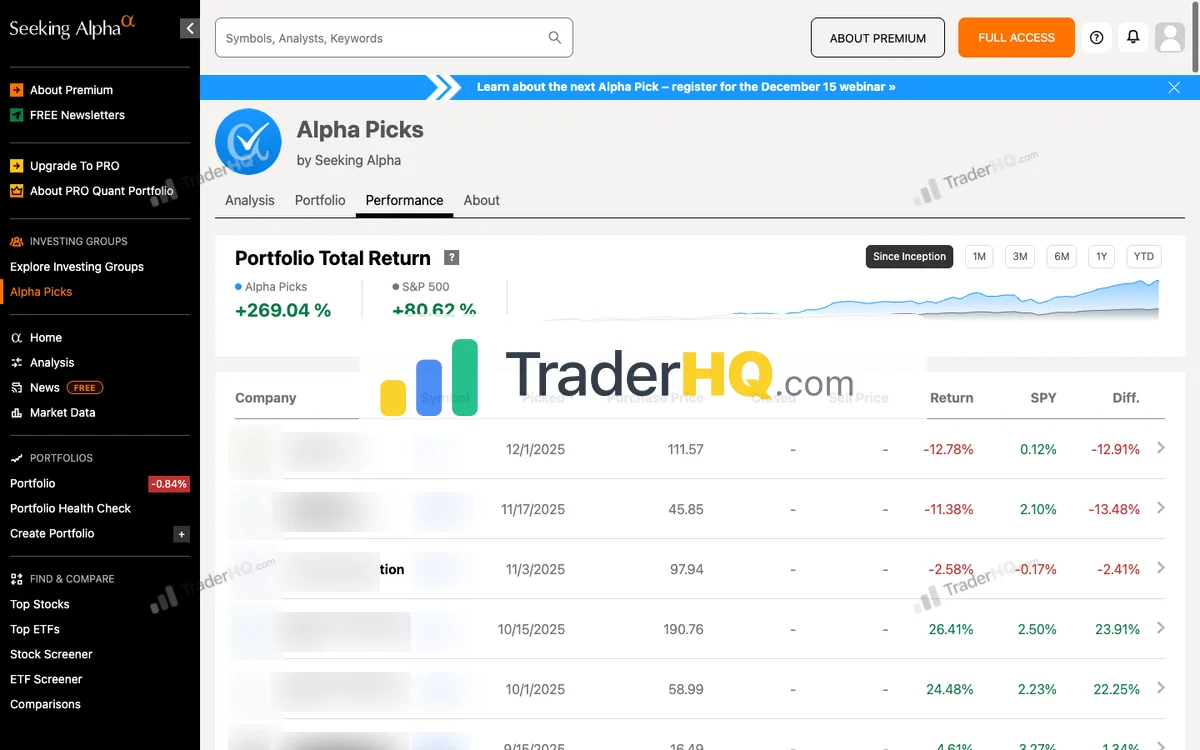
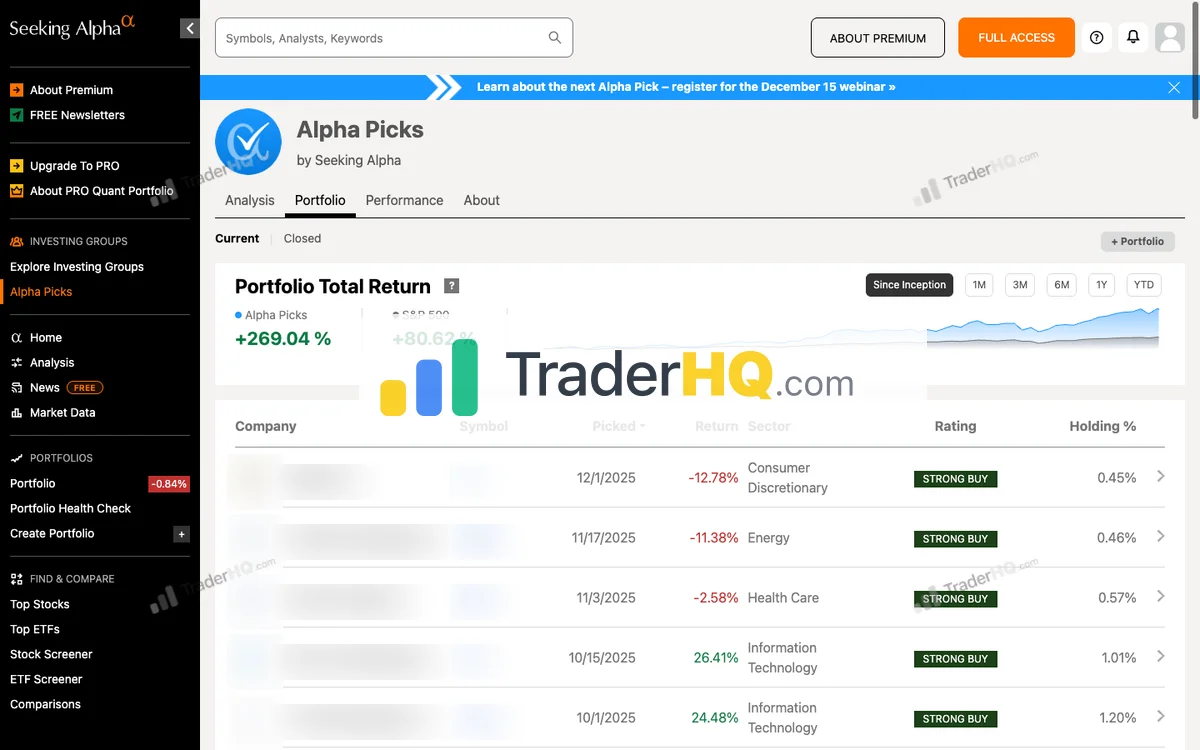
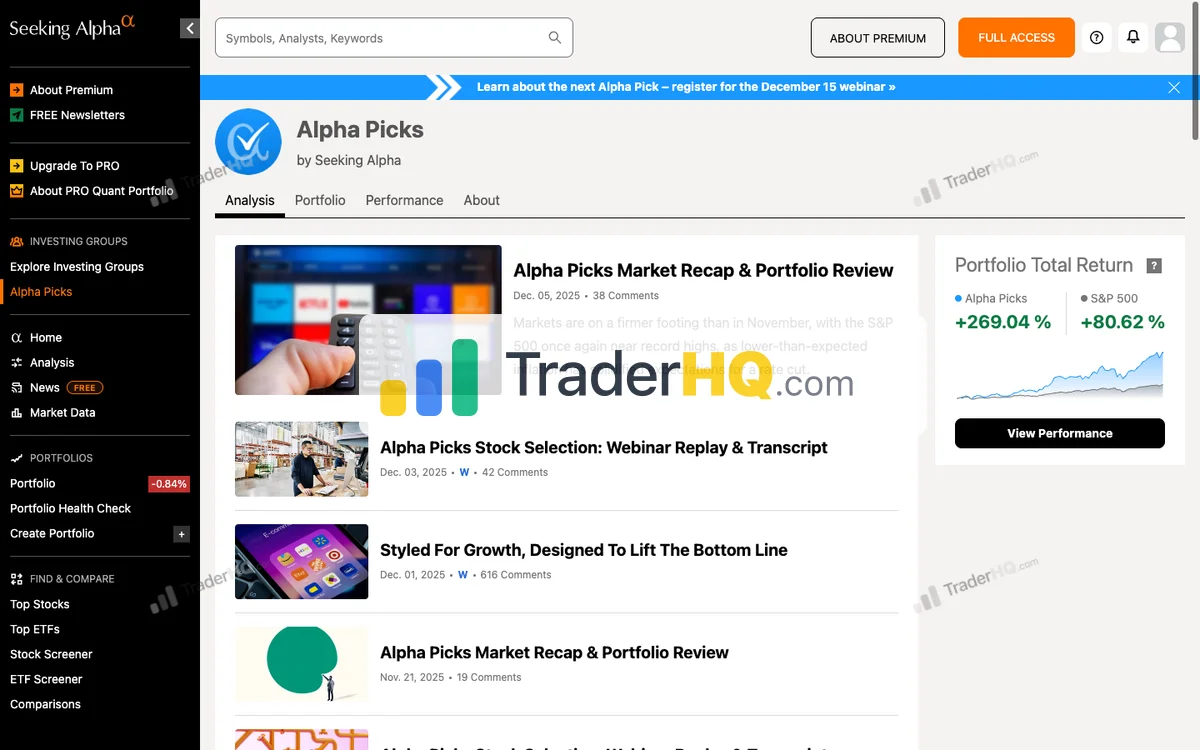
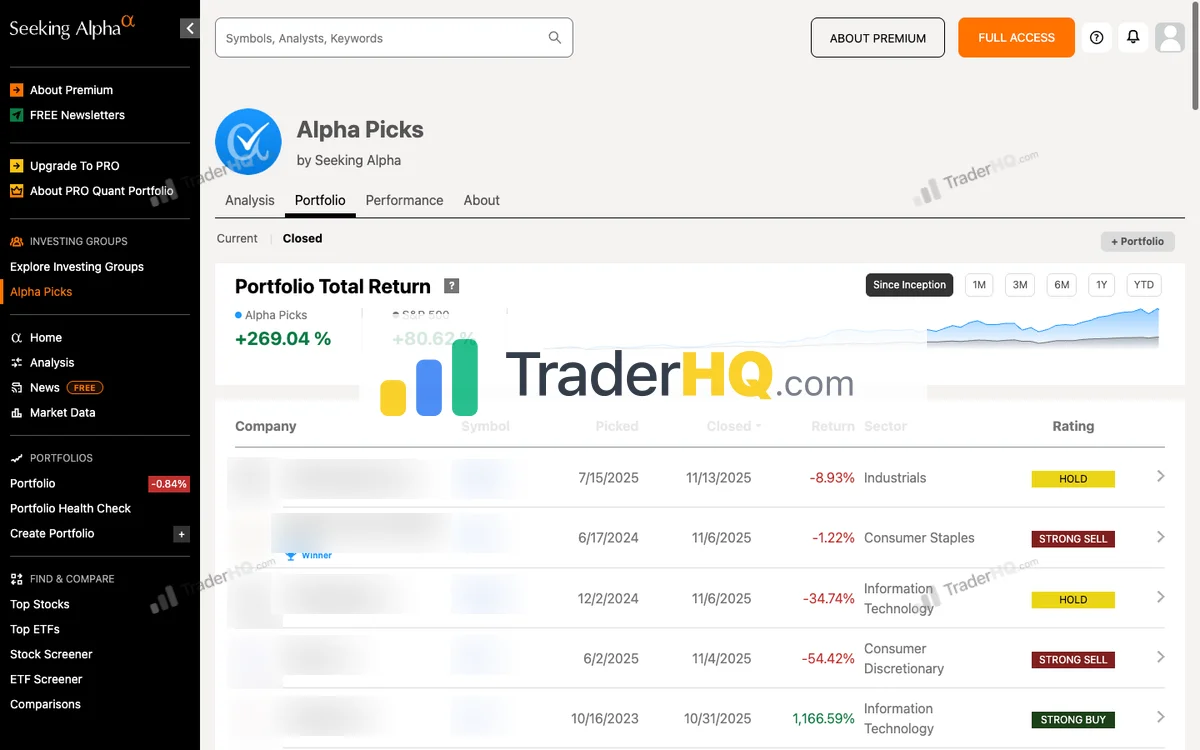

6 screenshots · Click to expand

Motley Fool Stock Advisor Performance
The Motley Fool · 526 picks · 25 years · Updated Aug 31, 2026
| SA Return | S&P 500 | Alpha | Win Rate |
|---|---|---|---|
| +979% | +214% | +765% | 66% |
S&P 500 shows what you'd have earned buying the index on each pick date instead. Same timing, fair comparison.
| SA Multi-Baggers | 10x+ | 5x+ | 3x+ | 2x+ |
|---|---|---|---|---|
| Count | 46 | 91 | 128 | 191 |
| SA Asymmetry | Avg Winner | Avg Loser | Ratio |
|---|---|---|---|
| Return | +1.7K% | -44% | ~38:1 |
Best Performers (All-Time)
| SA Pick | Return |
|---|---|
SHOP Shopify | +4.6K% |
 NFLX Netflix | +44K% |
TSLA Tesla | +16K% |
 CTAS CTAS | +4.6K% |
 AAPL Apple | +6.5K% |
 DIS Disney | +6.1K% |
 AMZN Amazon | +35K% |
 NVDA NVIDIA | +133K% |
 BKNG Booking Holdings | +22K% |
 MME.DL MME.DL | +4.3K% |
The multi-bagger pipeline. 191 doublers → 91 5-baggers → 46 10-baggers. About 24% of doublers become 10-baggers with enough time.
See All Stock Advisor Recommendations →Latest Stock Advisor Picks
Tickers masked to protect subscriber value. Recent picks need 3-5+ years to demonstrate thesis.
| SA Pick | Return |
|---|---|
**** Cloud Monitoring | +97% |
**** Chip Manufacturer | +85% |
**** Infrastructure Construction | +63% |
**** Growth Company | +51% |
**** Growth Company | +41% |
**** E-commerce & Cloud Giant | +28% |
**** Growth Company | +23% |
**** Convenience Stores | +19% |
**** Growth Company | +18% |
**** Growth Company | +16% |
Lessons from 2005. 16 picks that year averaged +8.4K%. Best performers often come from buying during uncertainty—when conviction feels hardest.
Stock Advisor Win Rate by Holding Period
| Hold Time | SA Win Rate | Avg Return |
|---|---|---|
| < 1 Year | 57.1% | +16% |
| 1-3 Years | 55.7% | +11% |
| 3-5 Years | 48.8% | +23% |
| 5-10 Years | 62.9% | +206% |
| 10+ Years | 92.2% | +4.1K% |
Time is the strategy. 10+ year picks show 92.2% win rate with +4.1K% average returns. Same methodology, same picks—time transforms the results.
Stock Advisor Performance by Year
| Year | SA Picks | Avg Return | Win Rate | |
|---|---|---|---|---|
| 2026 | 31 | +10% | 57% | DDOG+97% |
| 2025 | 26 | +7% | 48% | ASML+133% |
| 2024 | 25 | +25% | 67% | AMD+186% |
| 2023 | 25 | +78% | 73% | CRWD+607% |
| 2022 | 23 | +58% | 59% | NET+495% |
| 2021 | 22 | -13% | 32% | LRCX+491% |
| 2020 | 24 | +146% | 46% | TSLA+1.1K% |
| 2019 | 23 | +56% | 70% | SNPS+259% |
| 2018 | 19 | +228% | 68% | SHOP+1.1K% |
| 2017 | 22 | +700% | 86% | NVDA+8.4K% |
| 2016 | 20 | +446% | 80% | SHOP+4.6K% |
| 2015 | 22 | +208% | 68% | CASY+839% |
| 2014 | 20 | +354% | 80% | ATVI+2.8K% |
| 2013 | 17 | +386% | 65% | NFLX+2.5K% |
| 2012 | 23 | +1.2K% | 74% | TSLA+16K% |
| 2011 | 19 | +561% | 63% | AAPL+3.2K% |
| 2010 | 18 | +459% | 83% | AMZN+2.9K% |
| 2009 | 20 | +3.3K% | 90% | NVDA+56K% |
| 2008 | 18 | +1.2K% | 89% | AAPL+6.5K% |
| 2007 | 19 | +1.5K% | 37% | NFLX+29K% |
| 2006 | 20 | +2.5K% | 65% | NFLX+25K% |
| 2005 | 16 | +8.4K% | 63% | NVDA+133K% |
| 2004 | 17 | +6.0K% | 59% | NFLX+44K% |
| 2003 | 17 | +229% | 65% | PHIN+1.4K% |
| 2002 | 16 | +3.2K% | 81% | AMZN+35K% |
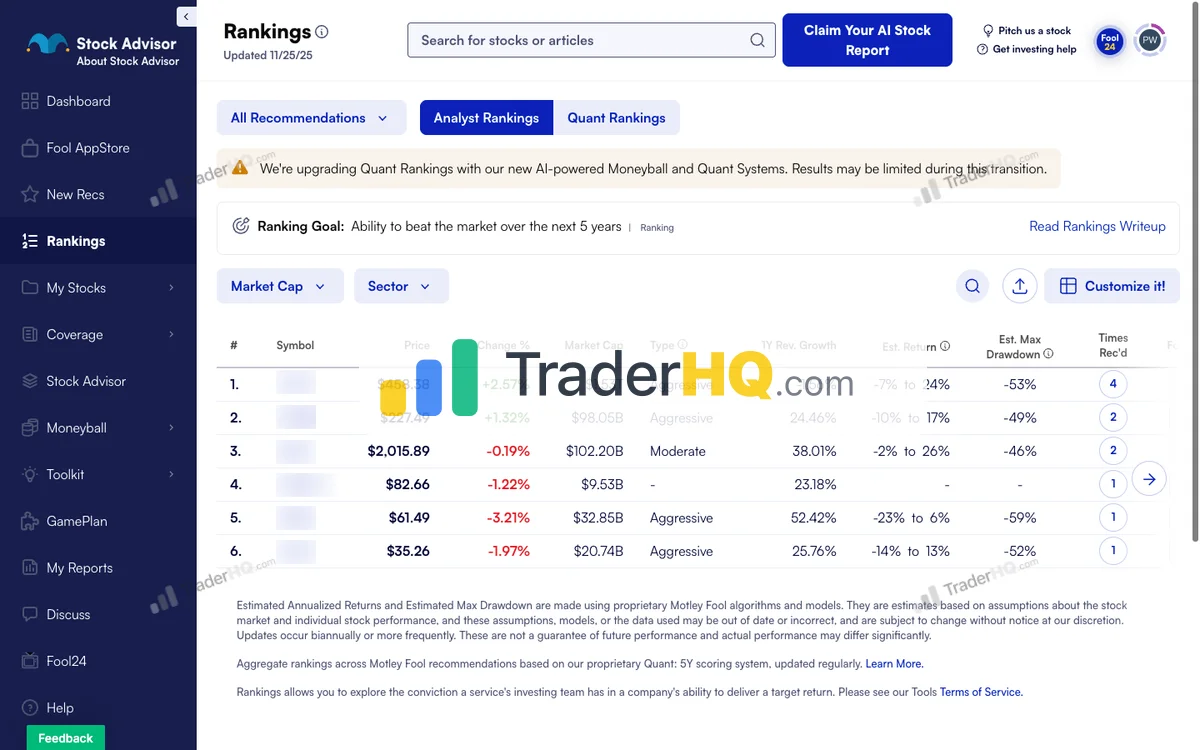
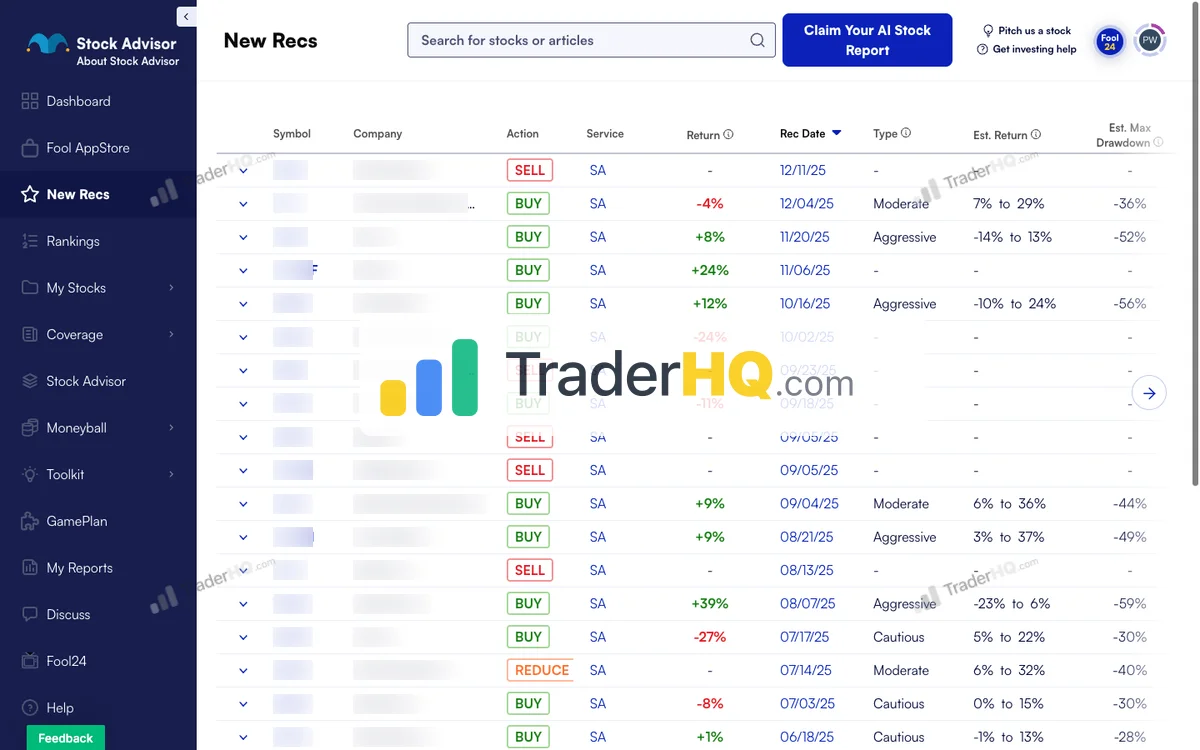
Inside Stock Advisor
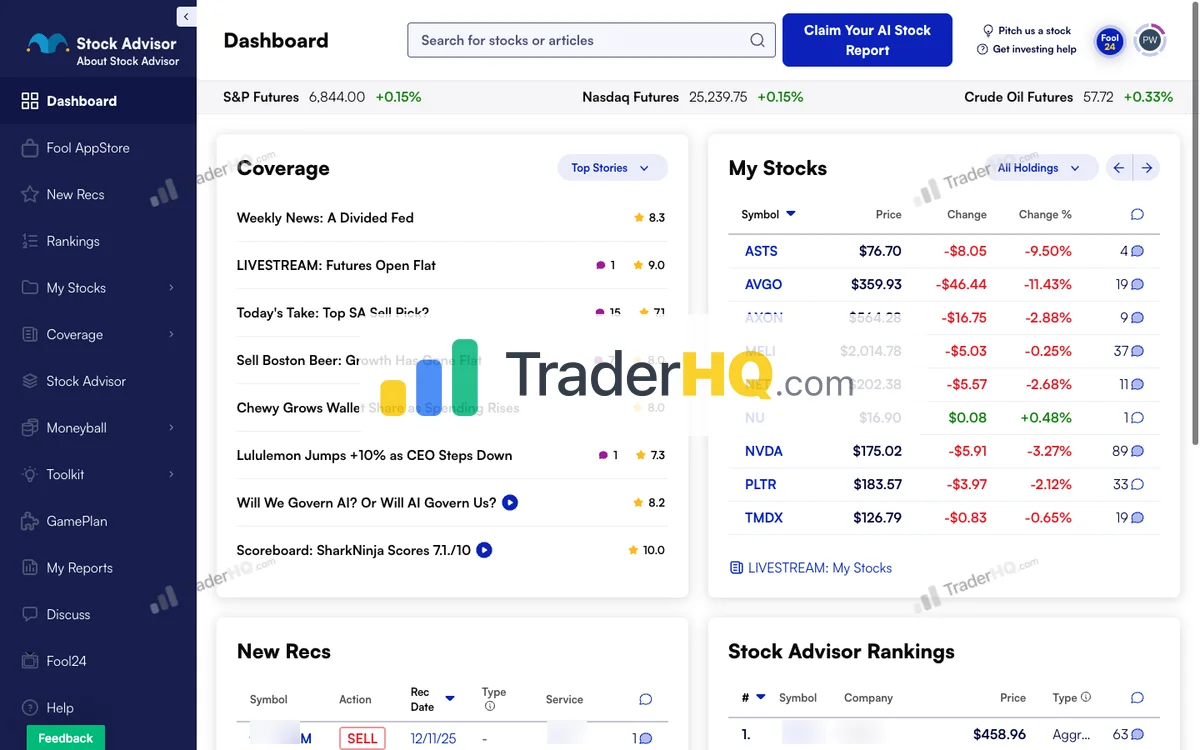
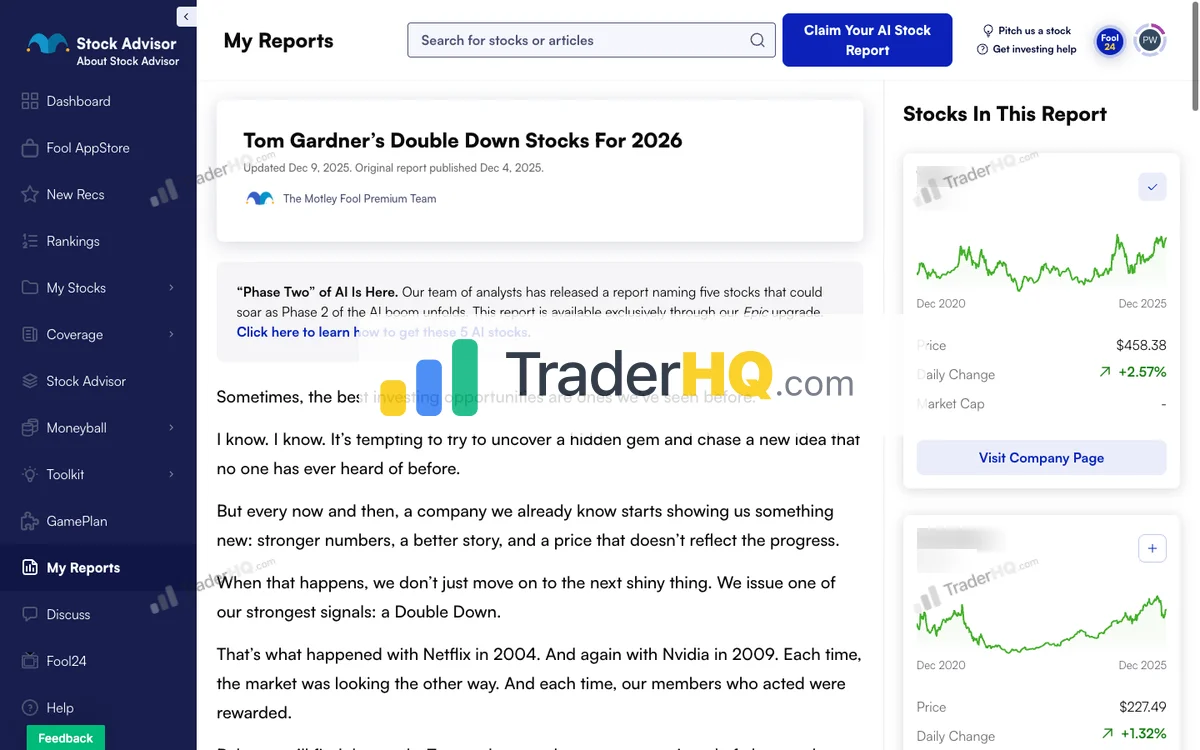
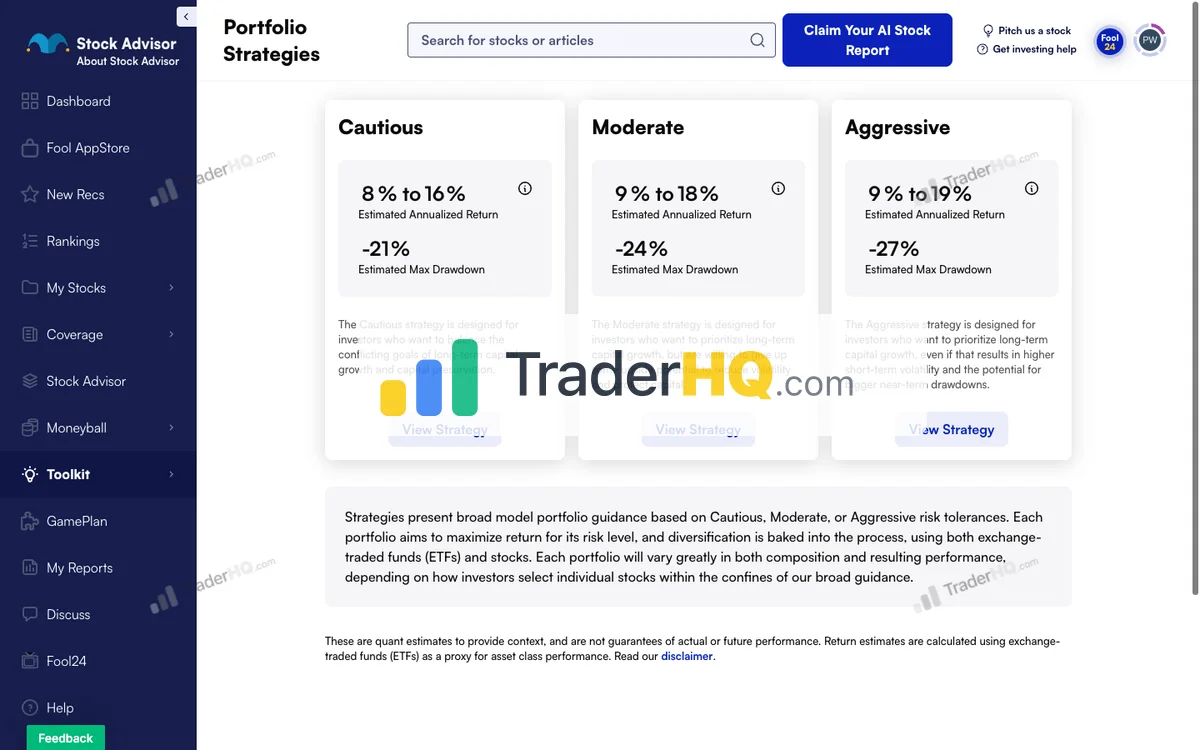
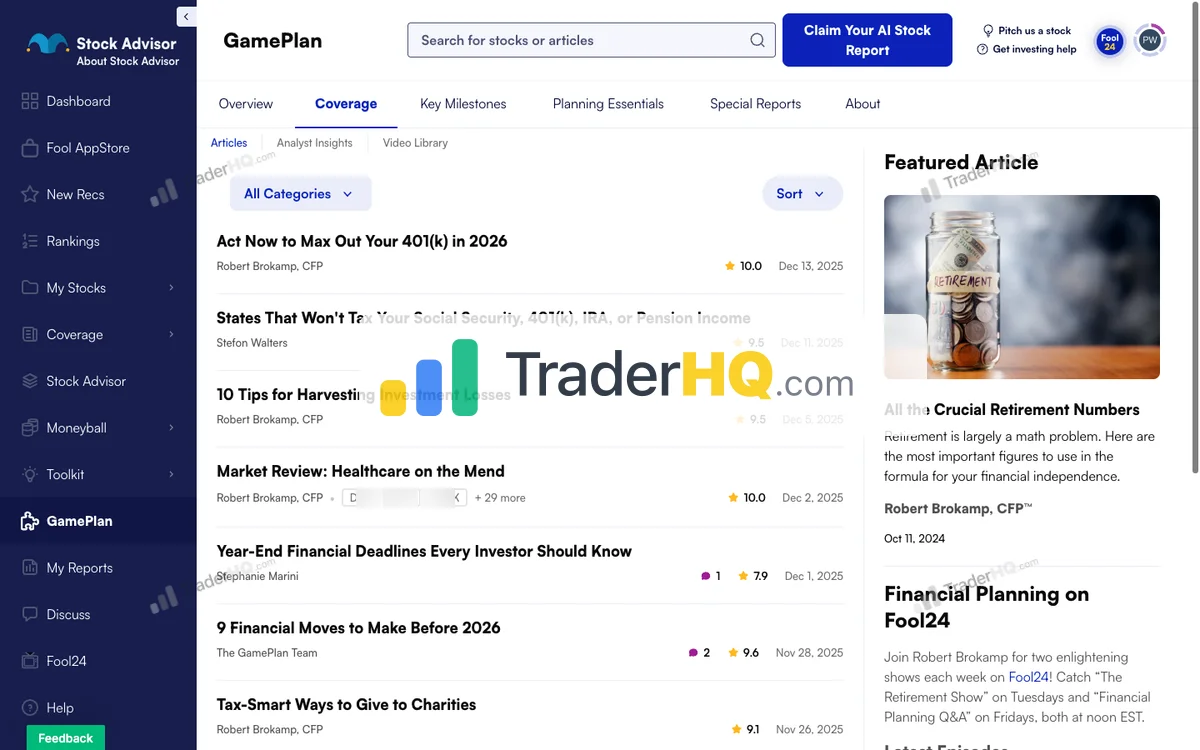
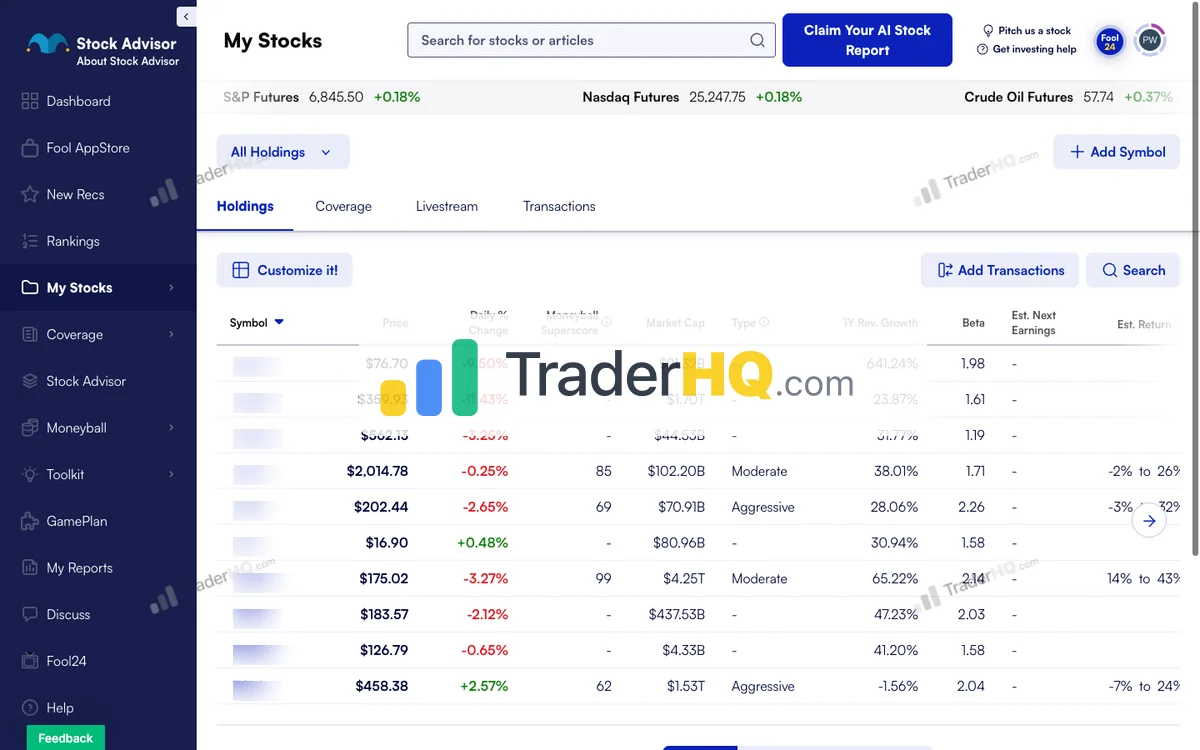
9 screenshots · Click to expand