

Quick Answer
Yes — Motley Fool Stock Advisor is worth it, if you’re a long-term investor who can hold through volatility.
Our recomputation of all 526 published picks since 2002 puts the service at +978.9% versus +214% for the S&P 500 over the same holding periods. That’s roughly 4.5x the market across 24.5 years. For context, the publisher’s own scorecard reports +969% since 2002 (as of Aug 18, 2026).
But here’s the catch, and it matters: 34% of picks lose money, and the typical (median) pick returned just +42.4%. Those market-crushing returns only reach investors who build a 25+ stock portfolio and hold for 5+ years.
TraderHQ analysis of the published trade log (data as of Aug 31, 2026)
- 978.9% total return across 526 positions, including 46 ten-baggers — the strongest case for conviction investing you’ll find anywhere
- The Fool’s own scorecard reports +969% since 2002 versus +215% for the S&P 500 (Aug 18, 2026)
And the timing isn’t luck. With the S&P 500 up 13.1% year-to-date (total return, Slickcharts, Aug 31, 2026) while the spread between its average top-20 and bottom-20 names runs 210 points, conviction stock-picking — not index-hugging — is where 2026’s returns are being made.
Behavior decides whether you capture it
The typical pick returned a median of +42.4%. Even stripping out the top 5% of picks entirely, the average return is still +160.8%. But the headline is carried by a handful of extraordinary winners — NVDA, NFLX, AMZN, BKNG, TSLA — and those winners take years to mature. Subscribers who churn out after a bad year never capture them.
It has survived every major dislocation of the past two decades:
| Regime | Result |
|---|---|
| Dot-Com Crash era | Picks averaged +3,425%, 85% win rate |
| 2008 Financial Crisis | Crisis-era picks averaged +915.6%, 77% win rate |
| 2020 COVID Crash & 2022 Bear Market | Navigated both and recovered |
What the marketing won’t emphasize: 34% of picks lose money, averaging -44.5% when they do. Some years are brutal — the 2021 vintage averaged -13% with a 32% win rate — and every big winner endured 40-60% drawdowns along the way.
The +978.9% return is real. It just required sitting through moments when your portfolio looked like a disaster.
This review breaks down exactly what you get, what the track record actually shows, and whether you’re the type of investor who can capture these returns — because the strategy only works if you can follow it when it hurts.
Quick Verdict: Is Motley Fool Stock Advisor Worth It?
| Metric | Value |
|---|---|
| Total Return (TraderHQ analysis) | +978.9% (as of Aug 31, 2026) |
| Total Return (official) | +969% (Fool scorecard, Aug 18, 2026) |
| vs S&P 500 | +764.9 percentage points (TraderHQ analysis) |
| Win Rate | 66% (92% for 10+ year holds) |
| Track Record | 24.5 years, 526 picks |
| Median Pick Return | +42.4% |
| $10K Becomes | $107,886 |
| Annual Cost | $99 promo ($199 list) |
Rating: 4.6/5 — Best for patient growth investors who hold through volatility for 5+ years.
The track record is real and verified. Stock Advisor has survived the dot-com crash, the 2008 financial crisis, the 2020 COVID crash, and the 2022 bear market — and outperformed through all of them. With 46 ten-baggers and 191 stocks that have doubled, the evidence is overwhelming.
At $99/year promotional ($199 list), the math works — but only if you follow the strategy. That means building a diversified portfolio of 25+ positions over time, holding through significant drawdowns, and resisting the urge to sell when individual picks drop 40-50%. Do that, and Stock Advisor is the gold standard of stock picking services.

Motley Fool Stock Advisor Performance
The Motley Fool · 526 picks · 25 years · Updated Aug 31, 2026
| SA Return | S&P 500 | Alpha | Win Rate |
|---|---|---|---|
| +979% | +214% | +765% | 66% |
S&P 500 shows what you'd have earned buying the index on each pick date instead. Same timing, fair comparison.
| SA Multi-Baggers | 10x+ | 5x+ | 3x+ | 2x+ |
|---|---|---|---|---|
| Count | 46 | 91 | 128 | 191 |
| SA Asymmetry | Avg Winner | Avg Loser | Ratio |
|---|---|---|---|
| Return | +1.7K% | -44% | ~38:1 |
Best Performers (All-Time)
| SA Pick | Return |
|---|---|
 AMZN Amazon | +35K% |
 CTAS CTAS | +4.6K% |
 SHOP Shopify | +4.6K% |
 DIS Disney | +6.1K% |
 NFLX Netflix | +44K% |
 TSLA Tesla | +16K% |
 NVDA NVIDIA | +133K% |
 AAPL Apple | +6.5K% |
 MME.DL MME.DL | +4.3K% |
 BKNG Booking Holdings | +22K% |
38:1 asymmetry. Winners average +1.7K%, losers average -44%. One winner offsets 38 complete losses—this is why selling winners early is costly.
See All Stock Advisor Recommendations →Latest Stock Advisor Picks
Tickers masked to protect subscriber value. Recent picks need 3-5+ years to demonstrate thesis.
| SA Pick | Return |
|---|---|
**** Cloud Monitoring | +97% |
**** Chip Manufacturer | +85% |
**** Infrastructure Construction | +63% |
**** Growth Company | +51% |
**** Growth Company | +41% |
**** E-commerce & Cloud Giant | +28% |
**** Growth Company | +23% |
**** Convenience Stores | +19% |
**** Growth Company | +18% |
**** Growth Company | +16% |
$10K → $108K. Following every recommendation since inception would yield a 10.8x return. Recent picks look small now, but compounding hasn't had time to work.
Stock Advisor Win Rate by Holding Period
| Hold Time | SA Win Rate | Avg Return |
|---|---|---|
| < 1 Year | 57.1% | +16% |
| 1-3 Years | 55.7% | +11% |
| 3-5 Years | 48.8% | +23% |
| 5-10 Years | 62.9% | +206% |
| 10+ Years | 92.2% | +4.1K% |
526 data points over 25 years. The pattern repeats: early volatility, mid-term clarity, long-term outperformance. The data is the strategy.
Stock Advisor Performance by Year
| Year | SA Picks | Avg Return | Win Rate | |
|---|---|---|---|---|
| 2026 | 31 | +10% | 57% | DDOG+97% |
| 2025 | 26 | +7% | 48% | ASML+133% |
| 2024 | 25 | +25% | 67% | AMD+186% |
| 2023 | 25 | +78% | 73% | CRWD+607% |
| 2022 | 23 | +58% | 59% | NET+495% |
| 2021 | 22 | -13% | 32% | LRCX+491% |
| 2020 | 24 | +146% | 46% | TSLA+1.1K% |
| 2019 | 23 | +56% | 70% | SNPS+259% |
| 2018 | 19 | +228% | 68% | SHOP+1.1K% |
| 2017 | 22 | +700% | 86% | NVDA+8.4K% |
| 2016 | 20 | +446% | 80% | SHOP+4.6K% |
| 2015 | 22 | +208% | 68% | CASY+839% |
| 2014 | 20 | +354% | 80% | ATVI+2.8K% |
| 2013 | 17 | +386% | 65% | NFLX+2.5K% |
| 2012 | 23 | +1.2K% | 74% | TSLA+16K% |
| 2011 | 19 | +561% | 63% | AAPL+3.2K% |
| 2010 | 18 | +459% | 83% | AMZN+2.9K% |
| 2009 | 20 | +3.3K% | 90% | NVDA+56K% |
| 2008 | 18 | +1.2K% | 89% | AAPL+6.5K% |
| 2007 | 19 | +1.5K% | 37% | NFLX+29K% |
| 2006 | 20 | +2.5K% | 65% | NFLX+25K% |
| 2005 | 16 | +8.4K% | 63% | NVDA+133K% |
| 2004 | 17 | +6.0K% | 59% | NFLX+44K% |
| 2003 | 17 | +229% | 65% | PHIN+1.4K% |
| 2002 | 16 | +3.2K% | 81% | AMZN+35K% |
Inside Stock Advisor
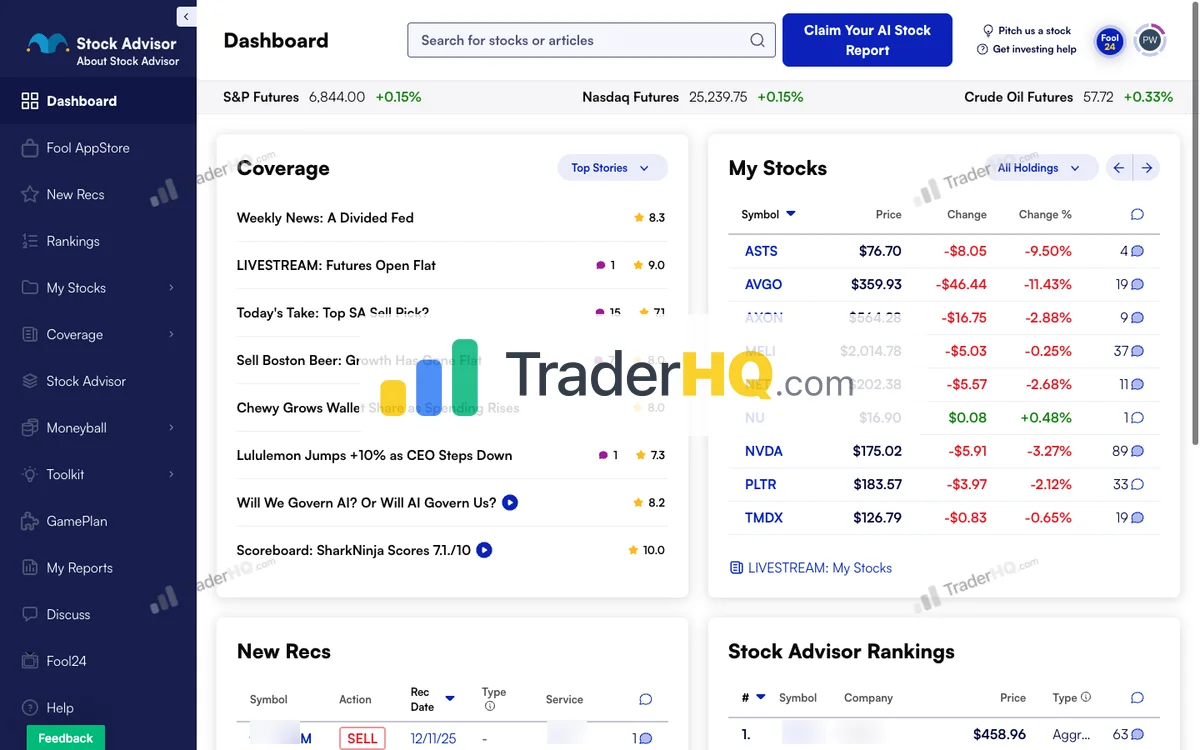
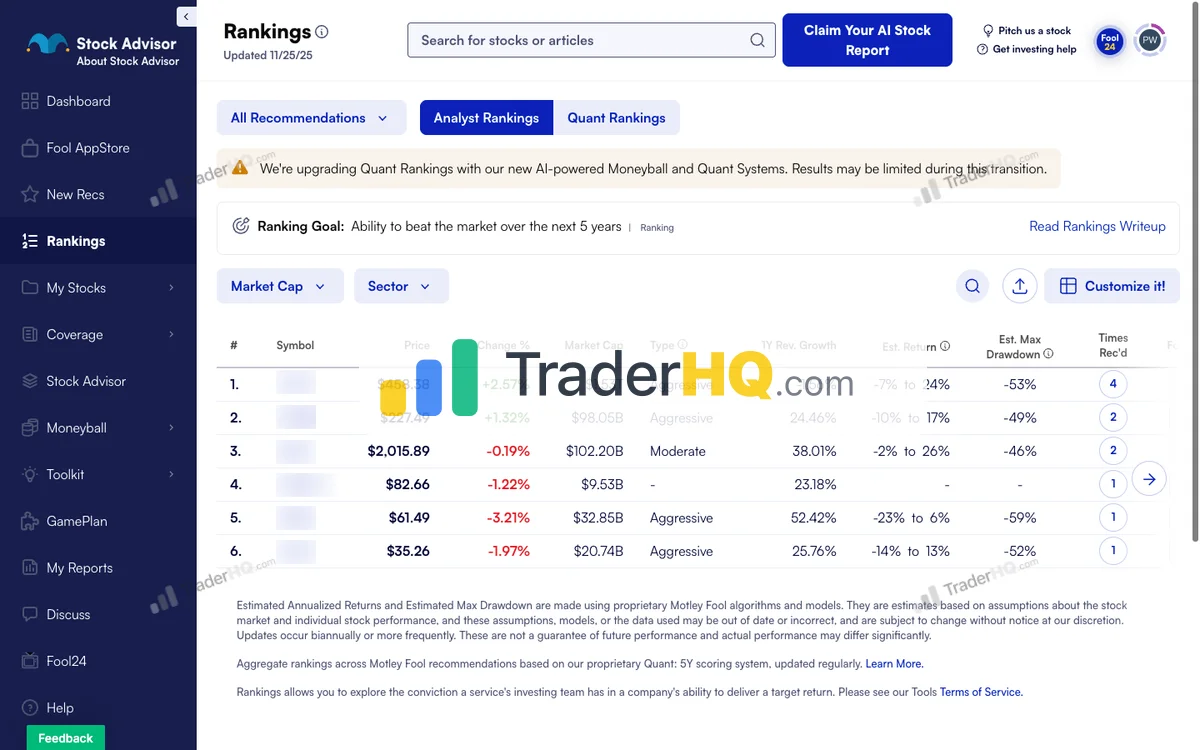
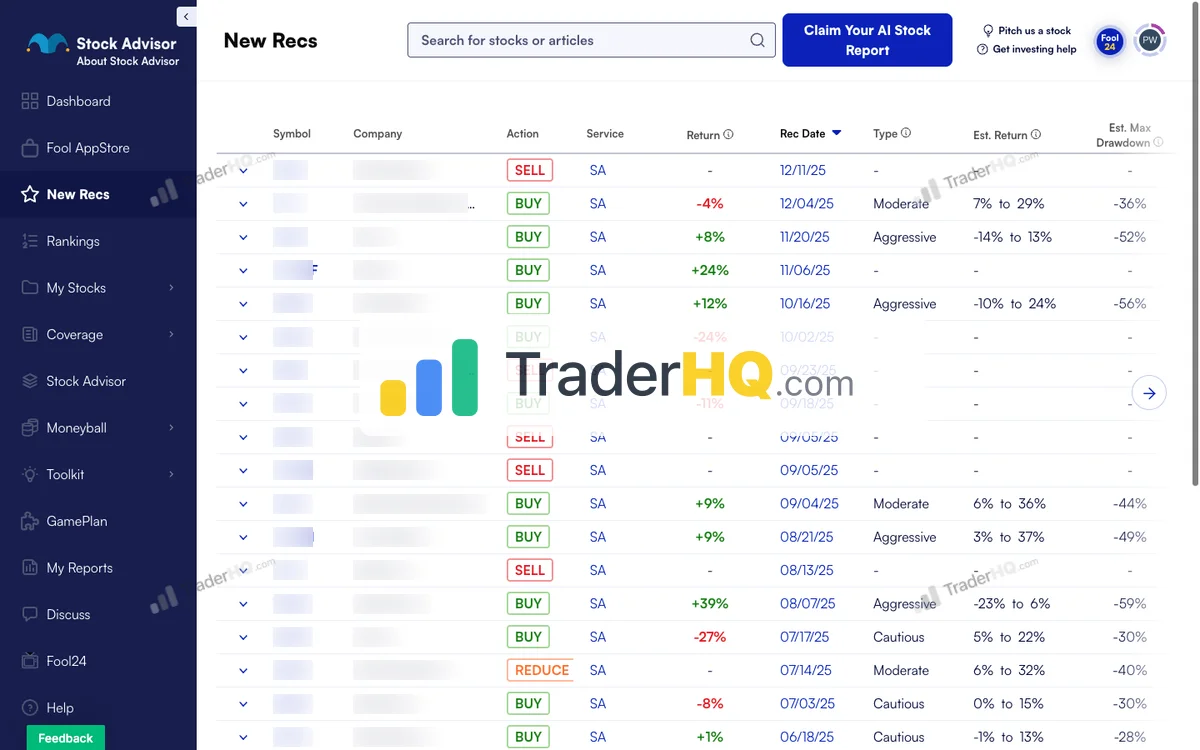
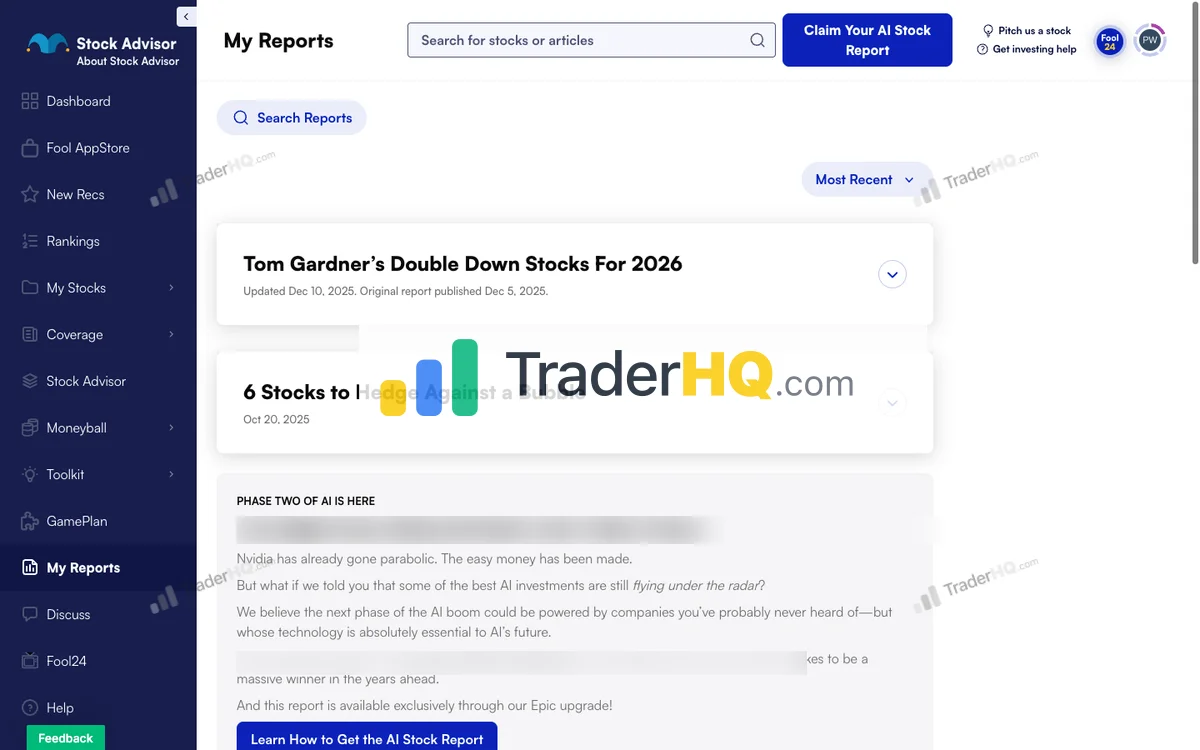
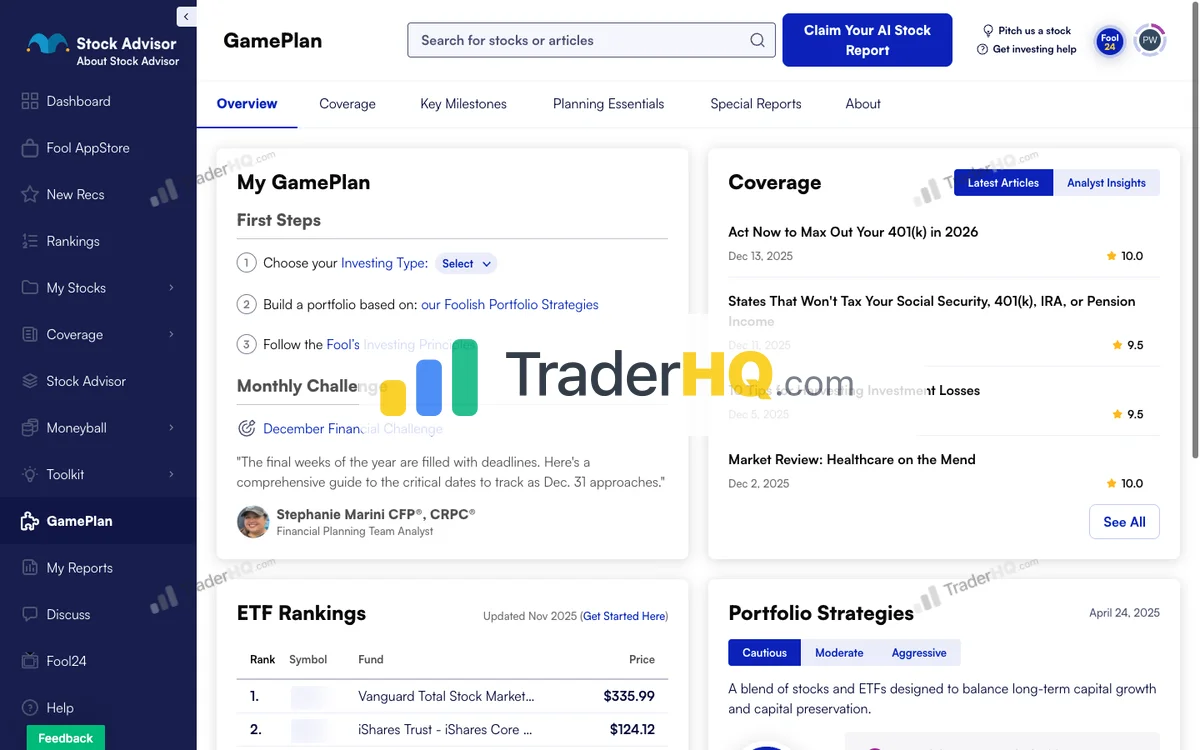
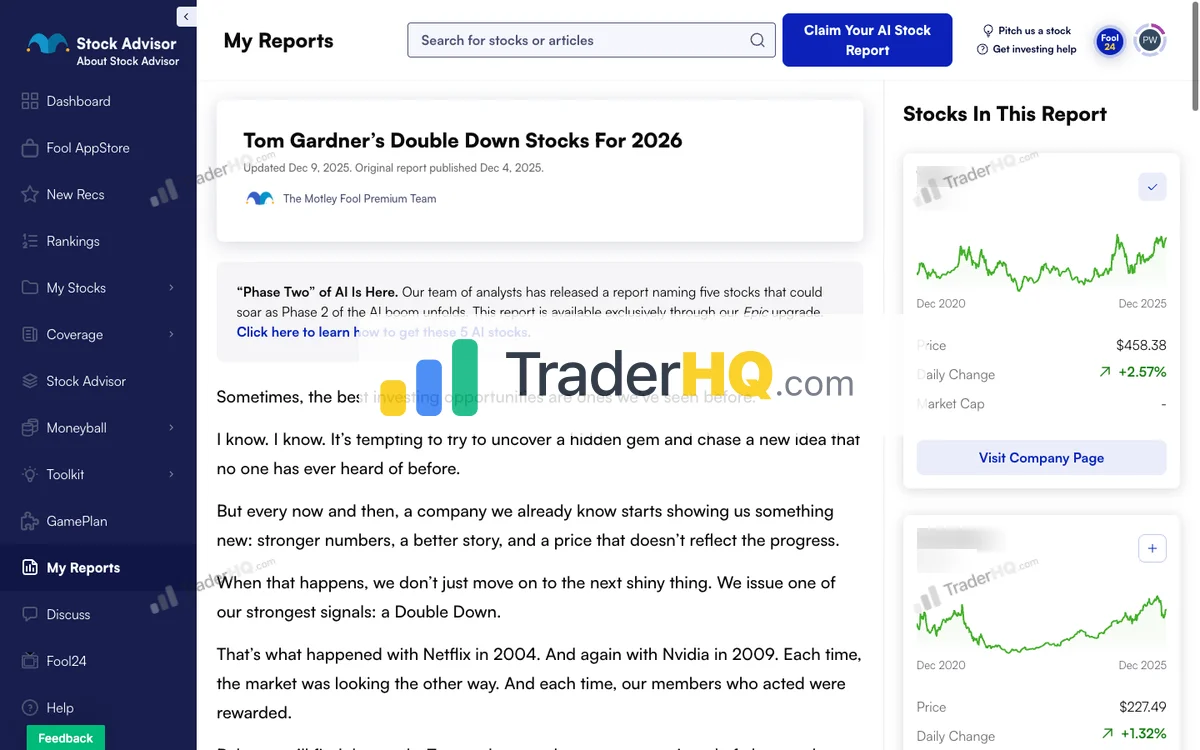
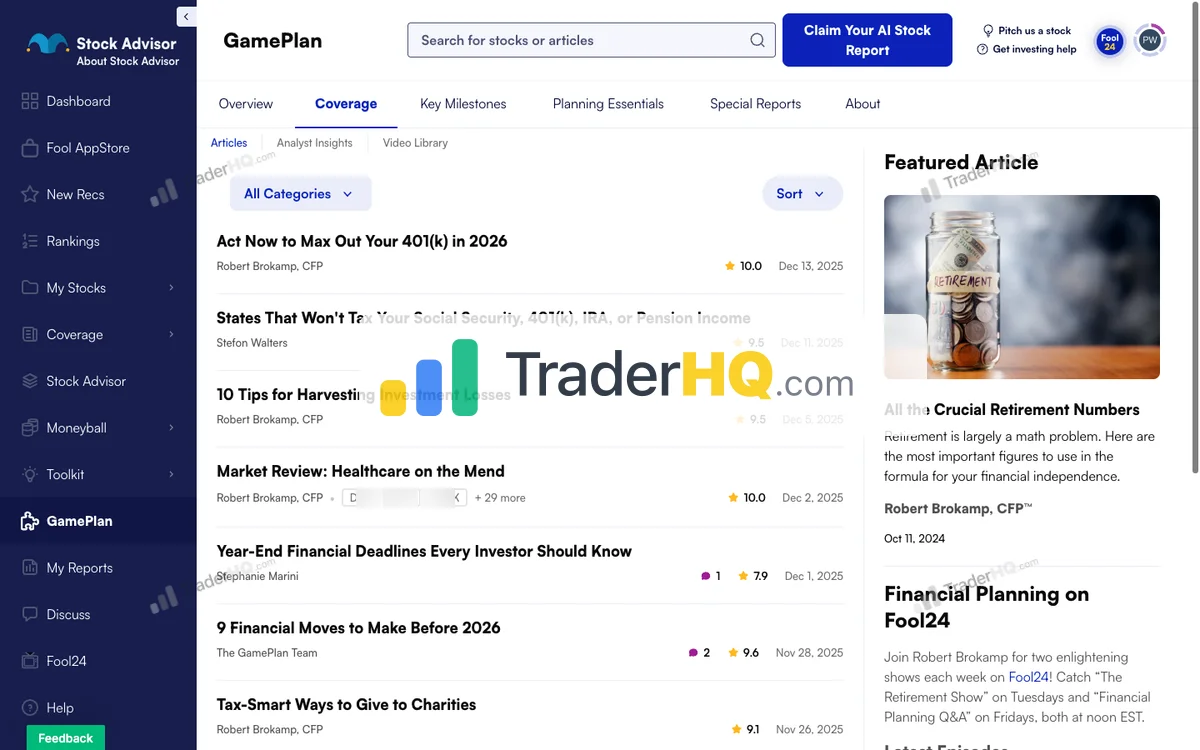
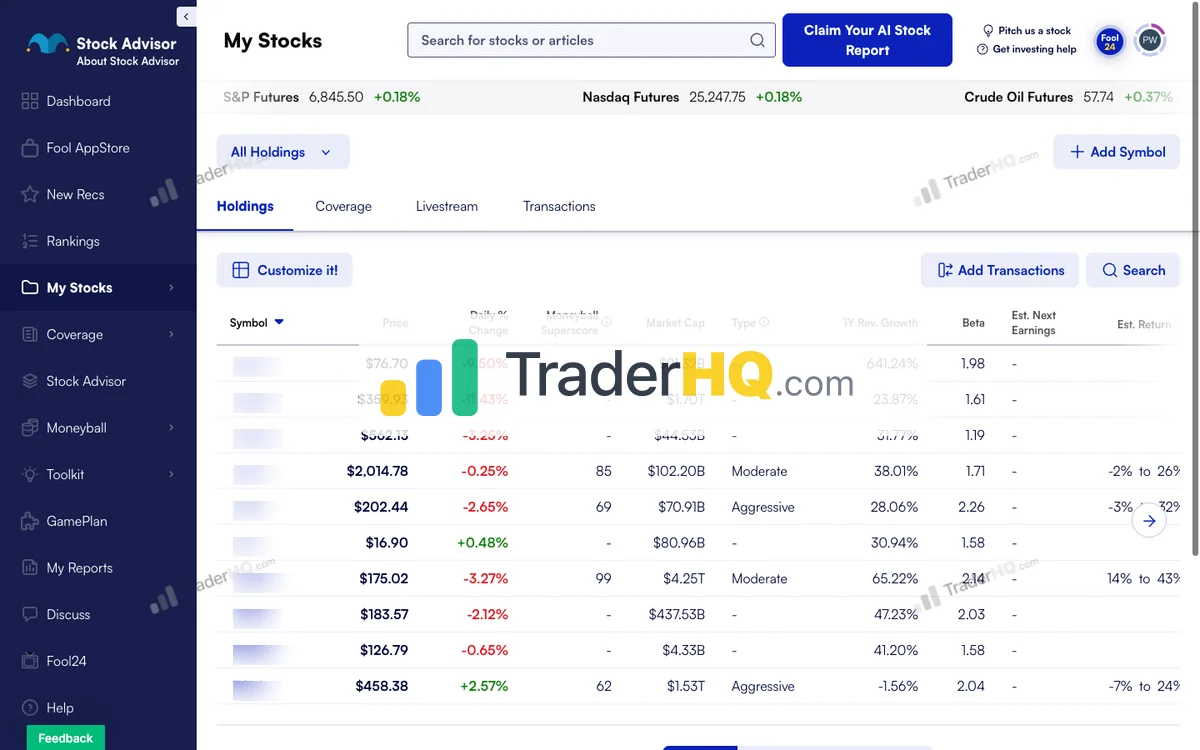
9 screenshots · Click to expand
The Complete Motley Fool Stock Advisor Track Record
The Headline Numbers
$10,000 invested following Stock Advisor’s recommendations in 2002 would be worth approximately $107,886 today (our recomputation of all 526 published picks, data as of Aug 31, 2026). That’s a 10.8x multiplier — a 10.2% compound annual growth rate.
The Motley Fool’s own scorecard reports +969% since 2002 (as of Aug 18, 2026). Here’s what the complete performance data reveals beneath the headline:
Win Rate and Return Asymmetry
| Category | Value |
|---|---|
| Total Picks | 526 |
| Winners | 332 (66%) |
| Losers | 171 (34%) |
| Avg Winner Return | +1,701.7% |
| Avg Loser Return | -44.5% |
The key insight most investors miss: this strategy is asymmetric. Losses are capped — you can only lose 100% — while winners can run 1,000%+, 10,000%+, even 100,000%+. Among long-term positions, the service has produced 191 stocks that doubled, 125 that tripled, 89 five-baggers, and 46 ten-baggers. Total gains across the record outweigh total losses by 74.2x.
A single ten-bagger can offset dozens of losers. When NVIDIA returned +133,425% from its April 2005 recommendation, it didn’t matter that other picks from that year lost money.
These asymmetric wins more than offset the losers. A single 10-bagger can recover from 10+ complete failures.
The Time Curve: Why Holding Period Matters
Holding period is where Stock Advisor picks separate from random stock tips. The data shows a clear pattern:
| Holding Time | Picks | Win Rate | Avg Return |
|---|---|---|---|
< 1 Year | 35 | 57% | +16% |
1-3 Years | 97 | 56% | +11% |
3-5 Years | 86 | 49% | +23% |
5-10 Years | 151 | 63% | +206% |
10+ Years | 129 | 92% | +4.1K% |
"The same Stock Advisor picks. The only variable is how long you hold. Time transforms losers into winners."
Read that again. Recommendations held for less than a year are effectively a coin flip: a 52.2% win rate with an average return of 8.5%. Positions held 5+ years: a 68.8% win rate with average returns of 1,442.8%. Picks held 10+ years: a 92% win rate.
That’s not cherry-picking — it’s the mathematical reality of how compounding works with quality businesses. The service’s “hold for 5+ years minimum” philosophy isn’t arbitrary. It’s built on this data.
The speed-to-double data from our trade-log computation says the same thing from another angle: 191 stocks doubled, but the average time to double was 3 years 1 month, and 106 of the 191 took 2+ years. And the record’s biggest winner needed extreme patience — the April 2005 NVDA recommendation has been held for 21 years 5 months, compounding at 39.9% annualized the whole way.
Performance Through Market Cycles
The record spans eight market regimes — not one extended bull run:
| Market Regime | Period | Positions | Avg Return | Win Rate |
|---|---|---|---|---|
| Dot-Com Crash | 2000-2002 | 13 | 3,425% | 85% |
| Post Dot-Com Recovery | 2002-2007 | 88 | 3,695.7% | 59% |
| Financial Crisis | 2007-2009 | 26 | 915.6% | 77% |
| Post-Crisis Bull | 2009-2020 | 222 | 711.4% | 75% |
| COVID Crash | Feb-Mar 2020 | 3 | -4.2% | 33% |
| COVID Recovery | 2020-2022 | 41 | 51.5% | 39% |
| 2022 Bear Market | 2022 | 17 | 37.9% | 59% |
| AI Bull Market | 2022-Present | 112 | 37.3% | 62% |
And bear-market picks have historically averaged 1,094% returns with a 64% win rate — actually beating bull-market picks (1,124% average, 59% win rate) on reliability.
The Bottom Line: Stock Advisor’s track record is legitimate. The +978.9% return is real, recomputed by TraderHQ across 526 picks over 24.5 years (data as of Aug 31, 2026); the publisher’s scorecard reports +969% (Aug 18, 2026). But capturing those returns requires following the strategy: diversify across 25+ positions, hold for 5+ years, and don’t panic-sell during drawdowns.
Discover Their Top Picks for 2026
How We Did the Math
None of these numbers come from the Fool’s marketing. We computed them ourselves — TraderHQ analysis of the published trade log (data as of Aug 31, 2026).
What we computed:
- All 526 published positions from the publisher’s trade log
- Entry prices = recommendation-date closing prices
- Returns include dividends where the source data applies
How the benchmark works (this matters): The “S&P 500” comparison is not the index’s return over 24.5 years. It’s the average of the index’s total return over each pick’s individual holding period — so a pick held 3 months is measured against 3 months of market, and a pick held 21 years against 21 years. Apples-to-apples, every time.
| What we did | What we didn’t do |
|---|---|
| Computed returns from the publisher’s own published record | Independently verify entry prices against external data |
| Confirmed the aggregate matches the publisher’s figures | Commission a third-party audit |
Gaps we disclose: 4 positions lack entry dates; 23 have no computed return; sector classifications cover only ~4% of positions.
Motley Fool Stock Advisor Picks: A Deep Dive
Understanding how Motley Fool stock picks work — and what makes them different from random stock tips — is essential before subscribing.
How Stock Advisor Picks Are Selected
Every month, the Stock Advisor team issues two new recommendations. Each pick includes:
- A clear investment thesis explaining why this business deserves your capital
- An investing type classification (Cautious, Moderate, or Aggressive)
- Estimated return range and max drawdown expectations
- The price at publication for tracking purposes
The focus: businesses with sustainable competitive advantages, strong management teams, large addressable markets, and financial strength. They’re explicitly not looking for short-term trades or momentum plays.
Recent Motley Fool Stock Advisor Picks Performance
Recent results are mixed — which is normal for growth investing:
| Vintage | Picks | Win Rate | Avg Return | Best | Worst |
|---|---|---|---|---|---|
| 2024 | 25 | 67% | 25% | AMD, up 186% | WING, down 72.7% |
| 2025 | 26 | 48% | +7% | ASML, up 133% | KLAR, down 65% |
| 2026 (so far) | 31 | 57% | +10% | Zero doublers yet — those picks are only months old | — |
Early-stage picks show high variance. The 2021 vintage looked terrible initially (32% win rate, -13% average) but has improved as winners had time to compound — LRCX, from that worst-of-the-record vintage, is up +491%.
The Conviction Picks: Re-Recommendations
When the Fool recommends the same stock repeatedly, pay attention. Multi-recommended stocks average roughly 17x the returns of single recommendations:
| Metric | Multi-Rec Stocks | Single-Rec Stocks |
|---|---|---|
| Average Return | 2,708.3% | 161.1% |
| Count | 74 stocks | All others |
Seeing the same name appear in “Top 10 Stocks to Buy Now” repeatedly is a high-conviction signal. But conviction isn’t infallibility: Zoom was recommended five times and averages -7.3%, and Trade Desk’s four recommendations average -15.8%. Conviction data is a signal worth noticing, not a guarantee.
Notable Motley Fool Stock Advisor Picks by Sector
One honesty note first: our sector data covers only a small classified subset of the 526 positions, so treat these rankings as indicative rather than definitive.
| Sector | Picks | Avg Return | Win Rate | Best Pick |
|---|---|---|---|---|
| Technology | 122 | 3,705.6% | 76.2% | +133,425% |
| Consumer Discretionary | 39 | 1,098% | 61.5% | +22,042% |
| Consumer Staples | 9 | 806.5% | 88.9% | +3,297% |
| Industrials | 19 | 678.3% | 94.7% | +4,587% |
| Financials | 15 | 633.7% | 93.3% | +3,509% |
| Healthcare | 19 | 369.8% | 78.9% | +2,174% |
Within the classified subset, Technology dominates the returns, while Industrials (94.7%) and Financials (93.3%) have been remarkably consistent — though with only 19 and 15 classified positions respectively, those win rates are fragile.
What About the Losers?
171 positions — 34% of picks with computed returns — are losers. Several are down 90%+ (some went to zero), and 31 picks lost 75% or more. The worst vintage year was 2021 (see above), heavy with pandemic darlings that collapsed as the world normalized.
But here’s the critical insight: the winners overwhelm the losers. Total gains from winners: 564,971%. Total losses: -7,613%. That’s the 74.2x gains-to-loss ratio from earlier. The strategy works because you let winners run while cutting losers.
What You Actually Get with Stock Advisor
The subscription is more than the monthly picks. Stock Advisor includes tools and resources that justify the cost even if you never buy a single recommendation.
Core Features
Monthly Stock Recommendations: Two new picks delivered each month from the Stock Advisor analyst team. Each includes a detailed thesis, risk assessment, and expected holding period.
Top 10 Stocks to Buy Now: Updated monthly rankings of the best current buying opportunities from all Stock Advisor recommendations — not just recent picks. This is how you prioritize where to deploy new capital.
Foundational Stocks: A curated list of 10-12 companies they believe “can strengthen every Foolish portfolio.” Updated quarterly with clear rationale for each selection.
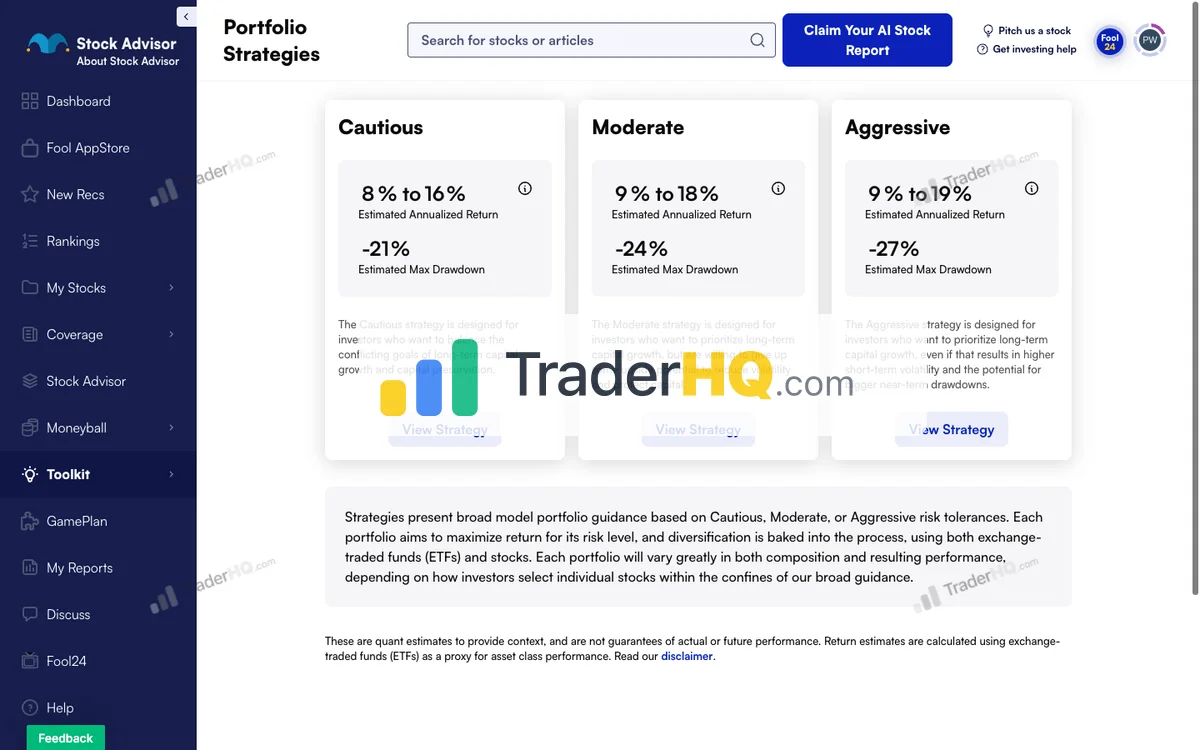
Three Portfolio Strategies: Complete frameworks for Cautious, Moderate, and Aggressive investors:
| Strategy | ETF/Stock Split | Est. Annual Return | Est. Max Drawdown |
|---|---|---|---|
| Cautious | 50% ETFs / 50% Stocks | 8% to 16% | -21% |
| Moderate | 35% ETFs / 65% Stocks | 9% to 18% | -24% |
| Aggressive | 20% ETFs / 80% Stocks | 9% to 19% | -27% |
Research Tools
Moneyball Database: Access to 200+ companies with proprietary scoring across financial health, product strength, leadership quality, and more. You can see why companies rank highly, not just that they do.
Fool IQ Company Pages: Deep dives on individual companies with performance charts, Moneyball scores, recommendation history, and financial data.
Stock Reports: Dozens of in-depth analyses written by expert analysts, covering both recommended stocks and potential future picks.
Educational Content
Weekly Market Recaps: Genuinely informative analysis connecting macro developments to portfolio implications — not generic market commentary.
Investing Philosophy Content: Articles explaining drawdown expectations, investing types, and the service’s core principles. This is the content that builds the holding power you need to capture long-term returns.
Live Coverage: Market commentary during trading hours, plus livestream shows three times daily.
Pro Tip: Read the educational content on drawdowns and volatility before you need it. Understanding that -40% drawdowns are expected for aggressive picks is what saves you from panic selling.
How Stock Advisor’s Investment Philosophy Works
Stock Advisor isn’t just a list of picks — it’s a complete investing system. Six core principles drive it:
The Six Core Principles
-
Buy 25+ Companies Over Time: Diversification isn’t optional. They want you owning enough positions that one underperformer doesn’t sink your confidence.
-
Hold for 5+ Years Minimum: “The shorter your investing time horizon, the more we think you’re gambling.”
-
Add New Savings Regularly: Having cash available means you can add new stocks without selling existing positions.
-
Hold Through Market Volatility: “Be prepared for stock market declines—and take advantage of them.”
-
Let Winners Run: They don’t advocate trimming positions that have grown large. “Winning companies tend to keep winning.”
-
Target Long-Term Returns: Aim for excellent returns over 5-25 year periods, not quarterly performance.
Why This Philosophy Matters
The data backs the philosophy. Positions held 3+ years: 366 positions, 1,518.5% average return, 69.9% win rate. Positions held under 3 years: 133 positions, 13.4% average return, 56.4% win rate.
Patience isn’t just a virtue — it’s a roughly 113x difference in average returns for doing nothing. The service is designed to build holding power, not trading activity.
The “What If” Scenarios
Selling winners early is the most expensive mistake you can make with this service. The performance data quantifies exactly what deviation costs:
- Actual total gains: 557,359%
- If capped at 100% (selling after every double): 17,112%
- Missed gains: 540,247%
- Cost of selling early: 96.9% of total returns lost
Stock Advisor Pricing and Value Analysis
Current Pricing
| Plan | Price | Billing |
|---|---|---|
| Annual Membership | $199/year list | Annual |
| New-Member Promotional Pricing | $99/year | Annual |
At the $99 promotional rate, you’re paying less than $2 per week — $0.55 per day, or $8.29 per pick — for a portfolio that has returned +978.9% (TraderHQ analysis) since 2002. Even at the $199 list price, one avoided mistake pays for years of the service.
The Value Math
Breakeven is remarkably low:
- Conservative scenario: Invest $5,000 per recommendation. If just ONE pick outperforms the S&P 500 by 10% over a year, that’s $500 in excess returns — you’ve paid for 2.5 years of the service.
- Realistic scenario: Some picks underperform, some outperform. Over 5+ years, the winners overwhelm the losers and the $99 becomes irrelevant compared to portfolio value — but only if you stay long enough.
- Mistake-avoidance value: One avoided mistake on a $5,000 position saves $2,225 (at the average loser return of -44.5%). That’s 11 years of subscriptions.
The Guarantee
30-day membership fee back for annual members. If it isn’t for you, cancel within 30 days for a full refund.
The Upsell Reality
The Motley Fool offers a complete product lineup:
| Service | Price | Monthly Picks |
|---|---|---|
| Stock Advisor | $199/year ($99 promo) | 2 |
| Epic | $299/year | 5 |
| Epic Plus | $1,999/year | 8+ |
| Fool Portfolios | $3,999/year | 10+ |
| Fool One | $13,999/year | All access |
My honest take: the upsell pressure within Stock Advisor is relentless. You’ll constantly see promotions for Epic and higher tiers — ignore them initially. The core Stock Advisor offering is substantial; master it before considering upgrades.
Try Stock Advisor — 30-Day Guarantee
The Real Trade-Offs: Pros and Cons
What Stock Advisor Does Well
- Verified long-term track record. 24.5 years of documented picks across multiple market cycles — real recommendations made in real time, not backtested data — recomputed by TraderHQ at +978.9% (data as of Aug 31, 2026); the publisher’s scorecard reports +969% (Aug 18, 2026).
- Asymmetric return profile. Winners average +1,701.7% while losers average -44.5%: unlimited upside, capped downside, a 74.2x gains-to-loss ratio.
- Complete portfolio system. Beyond picks, you get portfolio strategies, risk classifications, and educational content that builds holding power.
- Research tools included. The Moneyball database and Fool IQ provide genuine analytical value beyond the monthly recommendations.
- Philosophy alignment. The service is designed for wealth building, not trading. Everything reinforces long-term holding behavior.
Where Stock Advisor Falls Short
- 34% of picks lose money. That’s the nature of growth investing, but set expectations: some picks fail badly — 31 lost 75% or more of their value.
- Recent years have been choppier. The 2021 vintage was the worst in the record, and recent vintages (2024: 25%, 2025: 7%, 2026: 10% so far) are unremarkable — though the service’s own history shows mediocre early years followed by compounding.
- Relentless upsell pressure. The constant promotion of Epic and higher tiers makes Stock Advisor feel incomplete, even though the core offering is substantial.
- Some features are gated. Full Quant Projections and certain tools require upgrading to Epic or higher.
- Analyst team picks, not Gardner brothers. The marketing features Tom and David Gardner prominently, but David stepped back from stock picking in 2021. Recommendations come from the analyst team.
Who Should Subscribe to Stock Advisor
You’ll Get Real Value If…
- You have a 5+ year time horizon. This is non-negotiable. The strategy fails with shorter holding periods.
- You have $25,000+ to invest. Their suggested minimum makes sense — you need enough capital to build a diversified portfolio of 25+ positions over time.
- You can stomach significant drawdowns. Their aggressive picks might drop 50-60%. If that would cause you to sell, this service will frustrate you.
- You want a system, not just tips. The portfolio strategies, risk classifications, and educational content provide a complete framework.
- You’re willing to ignore the upsells. The core subscription provides substantial value. Don’t let the constant Epic promotion make you feel like you’re missing out.
Look Elsewhere If…
- You want short-term trading ideas. This service explicitly discourages holding periods under 5 years. If you get bored without action, you’ll overtrade and destroy your returns.
- You need income-focused investments. Stock Advisor focuses on growth. Dividend investors should look at Morningstar Investor for research tools or other dividend-focused services.
- You can’t handle volatility. Even the “Cautious” strategy expects -21% drawdowns. If that would keep you up at night, consider index funds.
- You’re investing money you’ll need in 3 years. This is a 5+ year strategy. The volatility can hurt you in shorter timeframes.
- You want personalized advice. This is a one-size-fits-many service. They can’t know your specific situation, tax circumstances, or complete financial picture.
Best Alternatives to Stock Advisor
If Stock Advisor isn’t the right fit, consider these alternatives:
For Research-Focused Investors
Morningstar Investor ($249/year) — If you want tools rather than picks, Morningstar provides institutional-grade research, fair value estimates, and portfolio analysis. Best for self-directed analysts who want to make their own decisions. See our Morningstar Investor review for the complete breakdown.
For Quant-Driven Investors
Alpha Picks by Seeking Alpha ($449/year) — Algorithm-driven stock picks based on quantitative analysis. A different philosophy than Stock Advisor’s fundamental approach. Best for investors who trust data over human judgment. See our Stock Advisor vs Alpha Picks comparison for a detailed breakdown.
For Aggressive Growth Seekers
Motley Fool Rule Breakers ($299/year) — Stock Advisor’s more aggressive sibling, focusing on disruptive companies in emerging industries. Higher risk, higher potential reward. Compare the two in our Stock Advisor vs Rule Breakers guide, or see our complete Motley Fool review for the full ecosystem overview.
For Income Investors
Simply Safe Dividends ($199/year) — Focuses entirely on dividend safety and income investing. A completely different approach than Stock Advisor’s growth focus. Best for retirees or income-focused portfolios.
| Service | Price | Best For | Key Difference |
|---|---|---|---|
| Stock Advisor | $199/yr ($99 promo) | Long-term growth | Verified 24.5-year track record |
| Morningstar Investor | $249/yr | Self-directed research | Tools, not picks |
| Alpha Picks | $449/yr | Quant-driven investing | Algorithm-based selection |
| Rule Breakers | $299/yr | Aggressive growth | Higher volatility |
Final Verdict: Is Motley Fool Stock Advisor Worth the Money?
Stock Advisor is worth it for investors who can actually follow the strategy. After analyzing 526 picks across 24.5 years, here’s the case.
The +978.9% return (TraderHQ analysis of the published trade log, data as of Aug 31, 2026) versus +214% for the S&P 500 over the same holding periods — with the publisher’s scorecard reporting +969% (Aug 18, 2026) — is real. A 66% win rate with winners averaging 38x the size of losers creates genuine wealth over time.
With 46 ten-baggers, 191 doublers, a 92% win rate for positions held 10+ years, and research tools, portfolio frameworks, and educational content beyond the picks, the package is hard to beat for patient investors.
But the strategy only works if you:
- Hold for 5+ years (positions held 10+ years have a 92% win rate)
- Build a diversified portfolio of 25+ stocks
- Accept that 34% of picks will lose money
- Don’t panic-sell during 40-50% drawdowns
The most important number in this review isn’t the headline return — it’s the gap between the +978.9% total and the +42.4% median pick. The headline is carried by a handful of extraordinary winners that took years to mature.
Subscribers who judge the service on its first year of picks — and recent vintages have been modest (2025: 7% average, 48% win rate) — sell precisely the positions that become ten-baggers. If you sell every winner after it doubles, you’d capture 17,112% instead of 557,359%: 96.9% of the record’s gains come from letting winners run far past their first double.
And market-timing the subscription hasn’t worked historically: bear-market picks averaged 1,094% returns with a 64% win rate versus 1,124% and 59% for bull-market picks. “The market is at highs” has been the wrong reason to skip a year.
At the $99 promotional price ($199 list), the math works. One successful pick that beats the market by 10% on a $5,000 position pays for 2.5 years of the service. One avoided mistake saves 11 years of subscriptions.
The real question isn’t whether Stock Advisor is worth it. It’s whether you’re the type of investor who can capture the returns.
If you can commit to the 5+ year holding period, stomach the inevitable drawdowns, and trust the process when individual picks are underwater — Stock Advisor is the gold standard of stock picking services.
If you’ll second-guess every pick, sell at the first sign of trouble, or need the money in 3 years — save your $99. The service only works for investors who can follow it.
Compare all your options in our guide to the best stock advisors.
Get Their Next Stock Pick — 30-Day Guarantee
Frequently Asked Questions
Is Motley Fool Stock Advisor worth the money?
Yes, for long-term investors who can hold 5+ years. At $99/year promotional ($199 list), Stock Advisor has delivered +978.9% total returns since 2002 (TraderHQ analysis, data as of Aug 31, 2026) versus +214% for its per-position S&P 500 benchmark; the publisher’s scorecard reports +969% (Aug 18, 2026).
It has produced 46 ten-baggers and 191 doublers, with a 92% win rate for positions held 10+ years.
The math works if you follow the strategy — but 34% of picks lose money, so you need patience and diversification to capture the winners that drive overall returns. One successful pick that beats the market by 10% on a $5,000 position pays for 2.5 years of the service.
What are the best alternatives to Motley Fool Stock Advisor?
The best alternatives depend on your investing style:
- Morningstar Investor ($249/year) — best for self-directed researchers who want tools rather than picks
- Alpha Picks by Seeking Alpha ($449/year) — quantitative algorithms instead of fundamental analysis
- Rule Breakers ($299/year) — more aggressive growth picks for higher risk tolerance
- Simply Safe Dividends ($199/year) — focused entirely on dividend safety for income investors
Motley Fool Stock Advisor vs Alpha Picks: Which is better?
They use fundamentally different approaches — pick based on how you invest. Stock Advisor relies on human analysts selecting businesses with competitive advantages and strong management: a 24.5-year track record with +978.9% returns (TraderHQ analysis), 46 ten-baggers, and a 92% win rate for 10+ year holds. Alpha Picks uses quantitative algorithms to identify undervalued stocks based on data patterns.
Stock Advisor is better for investors who want thesis-driven picks and educational content. Alpha Picks is better for those who trust algorithms over human judgment. On price, Stock Advisor costs $99/year promotional ($199 list) versus Alpha Picks’ $449/year. Read our Stock Advisor vs Alpha Picks comparison for the detailed breakdown.
How do I cancel Motley Fool Stock Advisor?
You can cancel anytime by contacting Member Support at [email protected], calling (888) 665-3665 (Mon-Fri, 9am-5pm EST), or using the Customer Service Contact Form at fool.com/contact/customer-service/.
Annual memberships include a 30-day money-back guarantee — cancel within 30 days for a full refund. After 30 days, you can still cancel but won’t receive a refund for the remaining subscription period.
What is Motley Fool Stock Advisor’s actual return?
As of Aug 31, 2026, Stock Advisor has delivered +978.9% total returns since inception in March 2002 (10.2% CAGR), based on our recomputation of all 526 published picks (data as of Aug 31, 2026). That’s versus +214% for the S&P 500 averaged over each pick’s holding period — an outperformance of +764.9 percentage points. The Motley Fool’s own scorecard puts it at +969% (as of Aug 18, 2026).
It also has a 66% overall win rate (92% for 10+ year holds), with 191 stocks that doubled and 46 ten-baggers.
However, 34% of picks lose money, the average loser returns -44.5%, and the typical (median) pick returned +42.4% — the headline is carried by a handful of extraordinary winners.
How many stock picks does Motley Fool Stock Advisor give per month?
Two new recommendations per month, plus ongoing guidance: the “Top 10 Stocks to Buy Now” rankings (updated monthly), the Foundational Stocks list (updated quarterly), and coverage of existing recommendations.
The subscription also includes access to the Moneyball database with 200+ scored companies and research tools for analyzing potential investments beyond the monthly picks.
How much money do I need to start with Motley Fool Stock Advisor?
$25,000+ is ideal to build a properly diversified portfolio. Stock Advisor recommends owning 25+ positions over time; with $25,000 you can build meaningful positions of ~$1,000 each. At smaller portfolio sizes, the $99 fee represents a larger percentage of capital, and you’ll struggle to diversify adequately.
That said, you can start with less — many investors begin with 5-10 positions and add over time. The 30-day guarantee lets you test whether the service fits your situation.
What happens during market crashes with Stock Advisor picks?
Picks drop with the market — often more — but recover faster. During the 2022 bear market, many Stock Advisor picks fell 40-60%. The same happened in 2020’s COVID crash. But the 24.5-year track record includes surviving 2008, 2020, and 2022 — each time recovering to new highs. The service doesn’t avoid crashes; it outperforms through full market cycles.
If you can’t hold through a 50% drawdown on individual positions, this service isn’t for you.
Can I see Stock Advisor’s picks before subscribing?
No — specific picks are behind the paywall, but aggregate performance is public. The public scorecard shows total returns (+969% official since 2002), win rate (66% per TraderHQ analysis), and general statistics. You’ll see specific stock names, entry prices, and individual returns only after subscribing.
The 30-day money-back guarantee means you can see everything, evaluate the picks, and get a full refund if it’s not for you.
Is Stock Advisor good for retirement accounts (401k/IRA)?
Yes — the 5+ year holding period aligns perfectly with retirement investing. In a Roth IRA, gains compound tax-free. In a traditional IRA or 401k, you avoid short-term capital gains taxes entirely, and long holding periods also qualify taxable-account gains for lower long-term capital gains rates.
The main consideration: most 401k plans don’t allow individual stock purchases — you’d need a self-directed IRA or brokerage window.
How does Stock Advisor perform during market rotations?
Stock Advisor’s GARP methodology is purpose-built for rotational markets. When sectors diverge sharply — some soaring while others collapse — stock selection matters far more than sector allocation, and that’s precisely what a fundamental pick service provides.
Key evidence from the track record:
- Bear-market vintages beat bull-market vintages on reliability: 1,094% average return with a 64% win rate versus 1,124% and 59% for bull-market picks
- The Dot-Com Crash vintage produced a 3,425% average return with an 85% win rate; the Financial Crisis vintage did 915.6% at 77%
- Conviction re-recommendations average 2,708% versus 161% for single picks — when analysts re-buy during turbulence, that signal has historically mattered
- The 2021 vintage (the worst in the record at -13%) still contained LRCX at +491% — time, not entry timing, does the work
Stock Advisor’s +978.9% total return across 526 positions and 46 ten-baggers prove the methodology works across every cycle.
Is Stock Advisor worth it in 2026’s uncertain economy?
The uncertainty is exactly what makes the track record relevant. Every era feels uncertain when you’re living through it — the service’s 24.5-year record spans the dot-com aftermath, the 2008 financial crisis, the COVID crash, and the 2022 bear market, and it outperformed through all of them.
Historically, fear has been the better entry signal: bear-market picks averaged 1,094% returns with a 64% win rate, matching or beating bull-market picks.
And the honest counterweight: the typical (median) pick returned +42.4%, recent vintages have been modest, and 34% of picks lose money. This is a long-horizon product, not a quick win.
At the $99 promotional price ($199 list), one pick that beats the market by 10% on a $5,000 position pays for 2.5 years of the service. 46 ten-baggers and a 92% win rate for 10+ year holds put the odds firmly in your favor — provided you can hold through the inevitable volatility.
What if I already own some Stock Advisor picks in my portfolio?
Check your overlap before subscribing — you may already own the core positions. Stock Advisor’s Foundational Stocks and most re-recommended picks tend to be well-known quality companies (think Amazon, Nvidia, Meta). If your existing portfolio already holds 5-10 Stock Advisor favorites, you’ll get less immediate value from new picks.
That said, the research tools, portfolio guidance, and “Top 10 Stocks to Buy Now” rankings help you prioritize future purchases. Many subscribers use Stock Advisor to validate existing positions as much as to find new ones.