

The Best Stock Advisor Service Overall: Motley Fool Stock Advisor — 24.5 years, +978.9% total return (46 ten-baggers, 191 doublers) vs S&P’s +214% per TraderHQ analysis of the published trade log (data as of Aug 31, 2026). The longest-running, most transparent stock advisor available. Read our full Stock Advisor review.
The Quick Answer: Best Stock Advisors Compared
The whole decision on one screen. Each service’s section below carries the full evidence: track records computed pick by pick, who each service actually fits, and the terms in fine print.
| Rank | Service | Best For | Track Record | Price | 2026 Fit |
|---|---|---|---|---|---|
| 🥇 | Stock Advisor | Long-term growth (5+ years) | +978.9% since 2002 (46 ten-baggers) | $99/yr | Exceptional — quality GARP thrives in high-dispersion markets |
| 🥈 | Alpha Picks | Data-driven investors (1-3 years) | +347.9% since 2022 (66% win rate) | $449/yr | Situational — strong quant fit, but recession-untested |
| 🥉 | Rule Breakers | Aggressive growth | +311.9% since 2004 (37 ten-baggers) | $299/yr | Strong — innovation DNA fits the hardware boom |
| 4 | Morningstar Investor | DIY researchers | N/A (40+ year research platform) | $199/yr | Exceptional — fair value discipline matters most at elevated valuations |
| 5 | 7investing | Innovation enthusiasts | Members-only scorecard (no public track record) | $199/yr | Situational — deep research, thin public track |
| 6 | Zacks Premium | Earnings-focused | 37+ year methodology | $249/yr | Good — manufacturing expansion supports earnings |
| 7 | Danelfin | AI/quant enthusiasts | +263% since 2017 | $39/mo | Situational — AI scoring in a high-dispersion market |
How we did the math: every return figure on this page is TraderHQ’s computation from each publisher’s published trade log — entry prices at recommendation-date closes, with the S&P 500 benchmark averaged over each pick’s actual holding period.
This is official-computed analysis, not a third-party audit. Where the data has gaps — a missing entry date, an all-open book — we say so in that service’s section.
The Scenario Cheat Sheet:
- Just starting out (<$25K)? Stock Advisor — proven track record, complete framework, 30-day guarantee
- Building serious wealth ($50K+)? Stock Advisor + Alpha Picks — combine human conviction with quant validation
- Want to pick your own stocks? Morningstar Investor — research tools, not recommendations (40+ years of methodology)
- High risk tolerance? Rule Breakers — more volatility, more upside
- Trust algorithms over humans? Alpha Picks — pure quant, zero human discretion
- Want deep research on fewer picks? 7investing — 1 pick/month with extensive thesis
- Prefer AI-driven analysis? Danelfin — explainable AI, 10,000+ features per stock
Time Horizon Matching:
- 1-3 years: Alpha Picks — 77.6% win rate on 1-3 year holds
- 5-10 years: Stock Advisor — 62.9% win rate, +205.7% average return
- 10+ years: Stock Advisor — 92.2% win rate on 10+ year holds
Why Stock Picking Matters in This Market (September 2026)
Market data as of Aug 31, 2026 (Slickcharts, BLS, CBOE, AAII, CME FedWatch).
| Indicator | Reading |
|---|---|
| S&P 500 | 7,686, +13.1% YTD (total return) |
| Winner-loser spread | 210 points — top-20 average +168.7%, bottom-20 average −41.6% |
| Extremes | SanDisk +560%, Trade Desk −63.9% |
| CAPE | ~40–42, highest since September 2000 |
| Forward index returns (est.) | 1-yr: −5% to +15% · 3-5 yr: 4-8% CAGR (vs 10.2% historical avg) |
| VIX / sentiment | 14.92 calm / AAII bears 44.4% vs bulls 32.9% |
| Inflation / Fed | CPI 3.4% sticky / September hike ~60–65% priced after Jackson Hole |
Forward index returns from this valuation level have historically compressed toward 5-8% a year. Two points of annual return compound into real money: $100K at 7% grows to ~$197K over a decade, ~$237K at 9% — illustrative arithmetic, not a forecast, and no advisor adds guaranteed alpha.
What that means for the rankings: services that hold winners for years (Stock Advisor, Rule Breakers) fit a market where the leaders need time to play out. Fair-value discipline (Morningstar) earns its fee when the index trades at dot-com-era multiples. Quant momentum (Alpha Picks) catches rotation — in both directions.
1. Motley Fool Stock Advisor

Patient growth investors who hold through volatility for 5+ years
Every “best stock advisor” list starts with Motley Fool Stock Advisor, and the reason is structural: 24.5 years and 526 published positions, every pick visible — including the losers. If you want one service with a complete portfolio framework and the longest verifiable record available, this is it.
Motley Fool Stock Advisor Performance
The Motley Fool · 526 picks · 25 years · Updated Aug 31, 2026
| SA Return | S&P 500 | Alpha | Win Rate |
|---|---|---|---|
| +979% | +214% | +765% | 66% |
S&P 500 shows what you'd have earned buying the index on each pick date instead. Same timing, fair comparison.
| SA Multi-Baggers | 10x+ | 5x+ | 3x+ | 2x+ |
|---|---|---|---|---|
| Count | 46 | 91 | 128 | 191 |
| SA Asymmetry | Avg Winner | Avg Loser | Ratio |
|---|---|---|---|
| Return | +1.7K% | -44% | ~38:1 |
Best Performers (All-Time)
| SA Pick | Return |
|---|---|
 NVDA NVIDIA | +133K% |
 BKNG Booking Holdings | +22K% |
 CTAS CTAS | +4.6K% |
 DIS Disney | +6.1K% |
 AAPL Apple | +6.5K% |
 TSLA Tesla | +16K% |
 AMZN Amazon | +35K% |
 SHOP Shopify | +4.6K% |
 NFLX Netflix | +44K% |
 MME.DL MME.DL | +4.3K% |
38:1 asymmetry. Winners average +1.7K%, losers average -44%. One winner offsets 38 complete losses—this is why selling winners early is costly.
See All Stock Advisor Recommendations →Latest Stock Advisor Picks
Tickers masked to protect subscriber value. Recent picks need 3-5+ years to demonstrate thesis.
| SA Pick | Return |
|---|---|
**** Cloud Monitoring | +97% |
**** Chip Manufacturer | +85% |
**** Infrastructure Construction | +63% |
**** Growth Company | +51% |
**** Growth Company | +41% |
**** E-commerce & Cloud Giant | +28% |
**** Growth Company | +23% |
**** Convenience Stores | +19% |
**** Growth Company | +18% |
**** Growth Company | +16% |
$10K → $108K. Following every recommendation since inception would yield a 10.8x return. Recent picks look small now, but compounding hasn't had time to work.
Stock Advisor Win Rate by Holding Period
| Hold Time | SA Win Rate | Avg Return |
|---|---|---|
| < 1 Year | 57.1% | +16% |
| 1-3 Years | 55.7% | +11% |
| 3-5 Years | 48.8% | +23% |
| 5-10 Years | 62.9% | +206% |
| 10+ Years | 92.2% | +4.1K% |
526 data points over 25 years. The pattern repeats: early volatility, mid-term clarity, long-term outperformance. The data is the strategy.
Stock Advisor Performance by Year
| Year | SA Picks | Avg Return | Win Rate | |
|---|---|---|---|---|
| 2026 | 31 | +10% | 57% | DDOG+97% |
| 2025 | 26 | +7% | 48% | ASML+133% |
| 2024 | 25 | +25% | 67% | AMD+186% |
| 2023 | 25 | +78% | 73% | CRWD+607% |
| 2022 | 23 | +58% | 59% | NET+495% |
| 2021 | 22 | -13% | 32% | LRCX+491% |
| 2020 | 24 | +146% | 46% | TSLA+1.1K% |
| 2019 | 23 | +56% | 70% | SNPS+259% |
| 2018 | 19 | +228% | 68% | SHOP+1.1K% |
| 2017 | 22 | +700% | 86% | NVDA+8.4K% |
| 2016 | 20 | +446% | 80% | SHOP+4.6K% |
| 2015 | 22 | +208% | 68% | CASY+839% |
| 2014 | 20 | +354% | 80% | ATVI+2.8K% |
| 2013 | 17 | +386% | 65% | NFLX+2.5K% |
| 2012 | 23 | +1.2K% | 74% | TSLA+16K% |
| 2011 | 19 | +561% | 63% | AAPL+3.2K% |
| 2010 | 18 | +459% | 83% | AMZN+2.9K% |
| 2009 | 20 | +3.3K% | 90% | NVDA+56K% |
| 2008 | 18 | +1.2K% | 89% | AAPL+6.5K% |
| 2007 | 19 | +1.5K% | 37% | NFLX+29K% |
| 2006 | 20 | +2.5K% | 65% | NFLX+25K% |
| 2005 | 16 | +8.4K% | 63% | NVDA+133K% |
| 2004 | 17 | +6.0K% | 59% | NFLX+44K% |
| 2003 | 17 | +229% | 65% | PHIN+1.4K% |
| 2002 | 16 | +3.2K% | 81% | AMZN+35K% |
Inside Stock Advisor
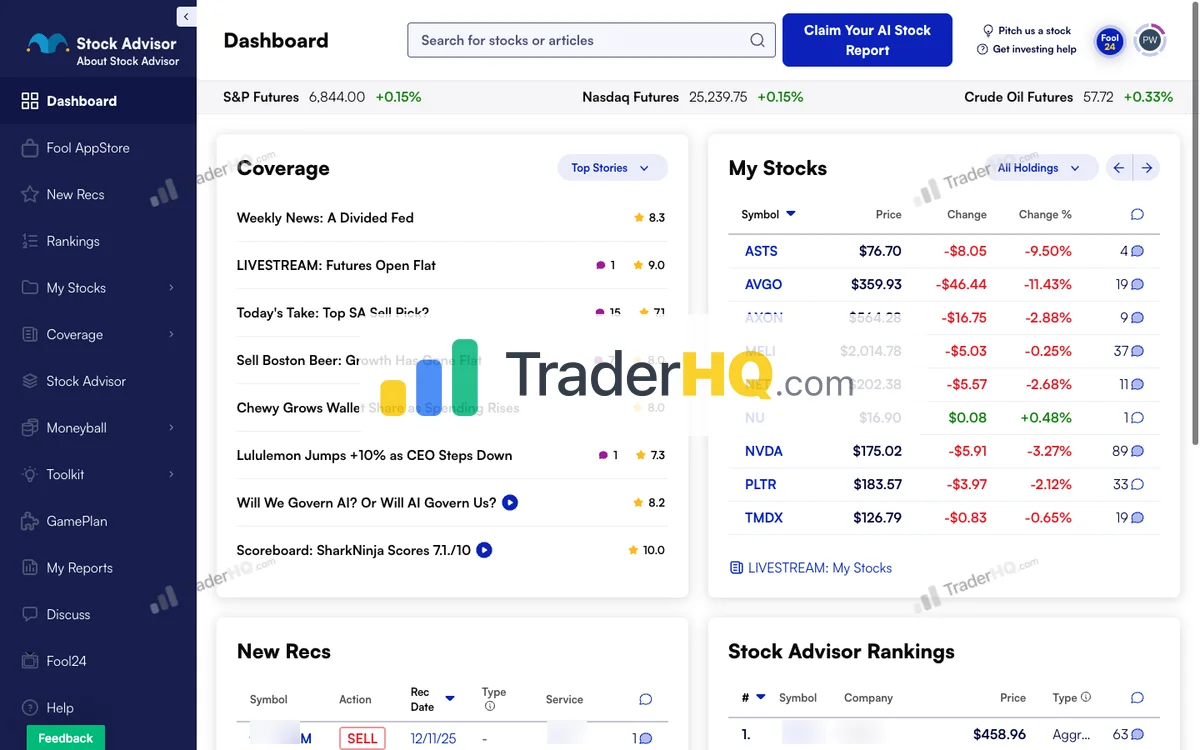
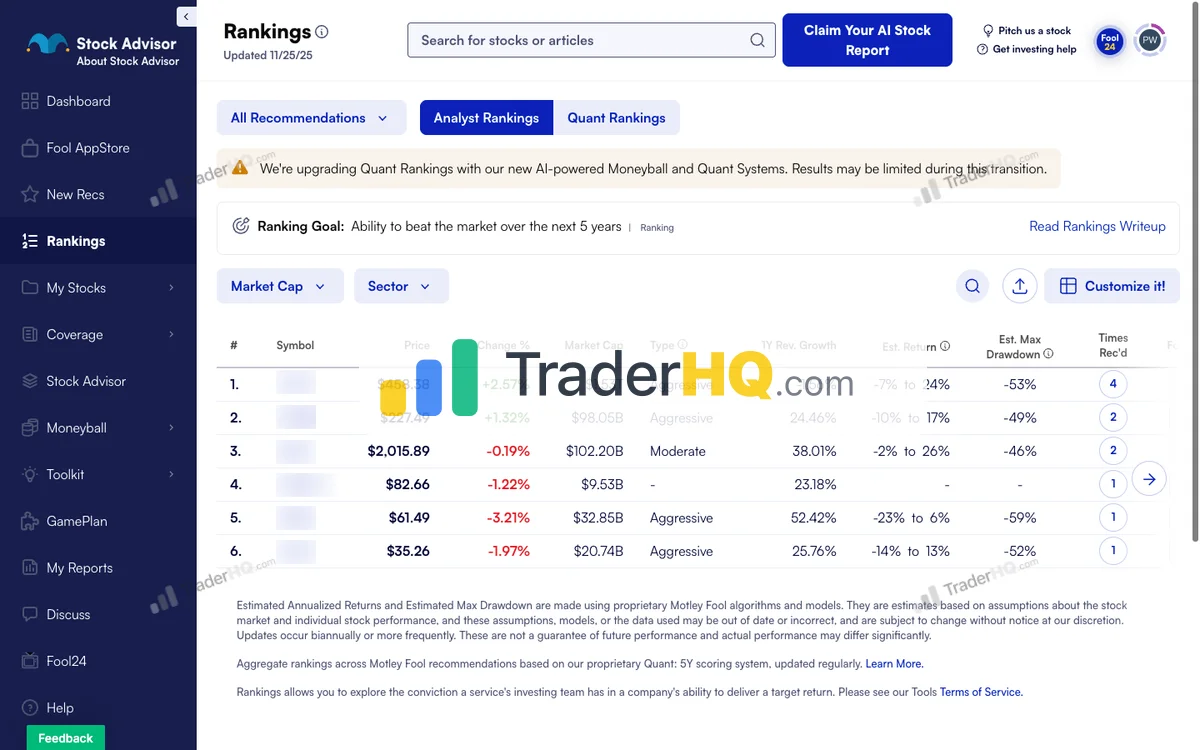
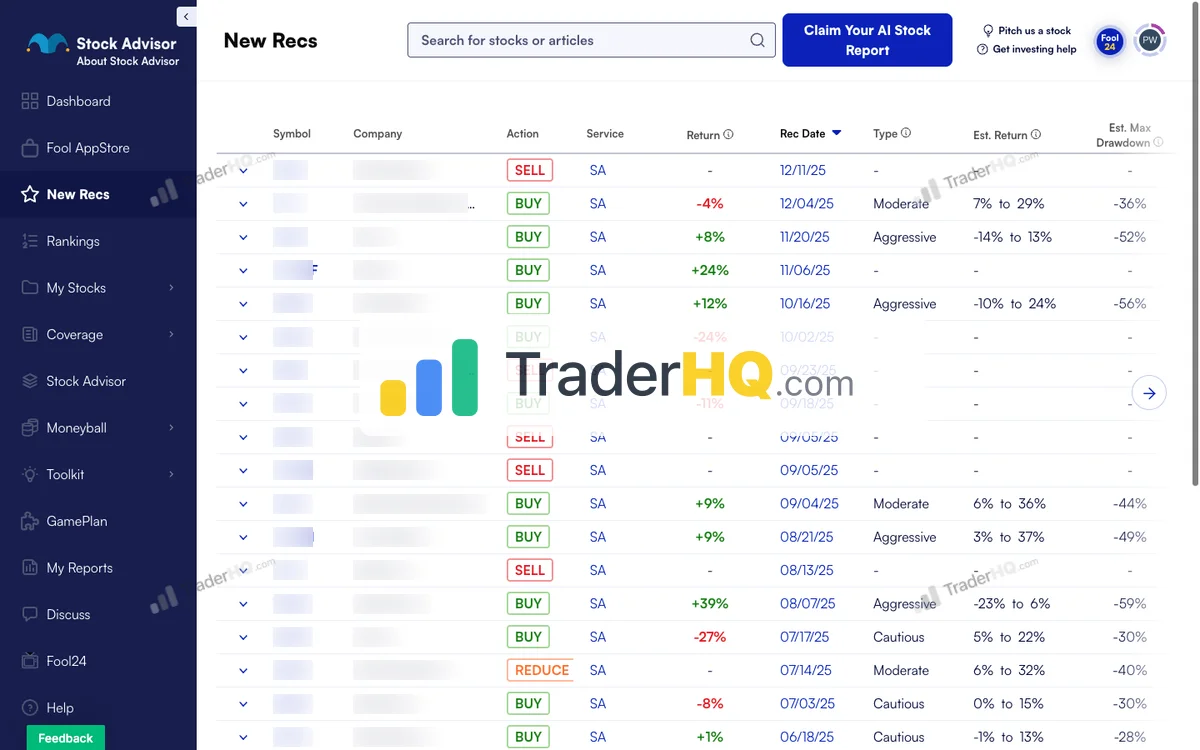
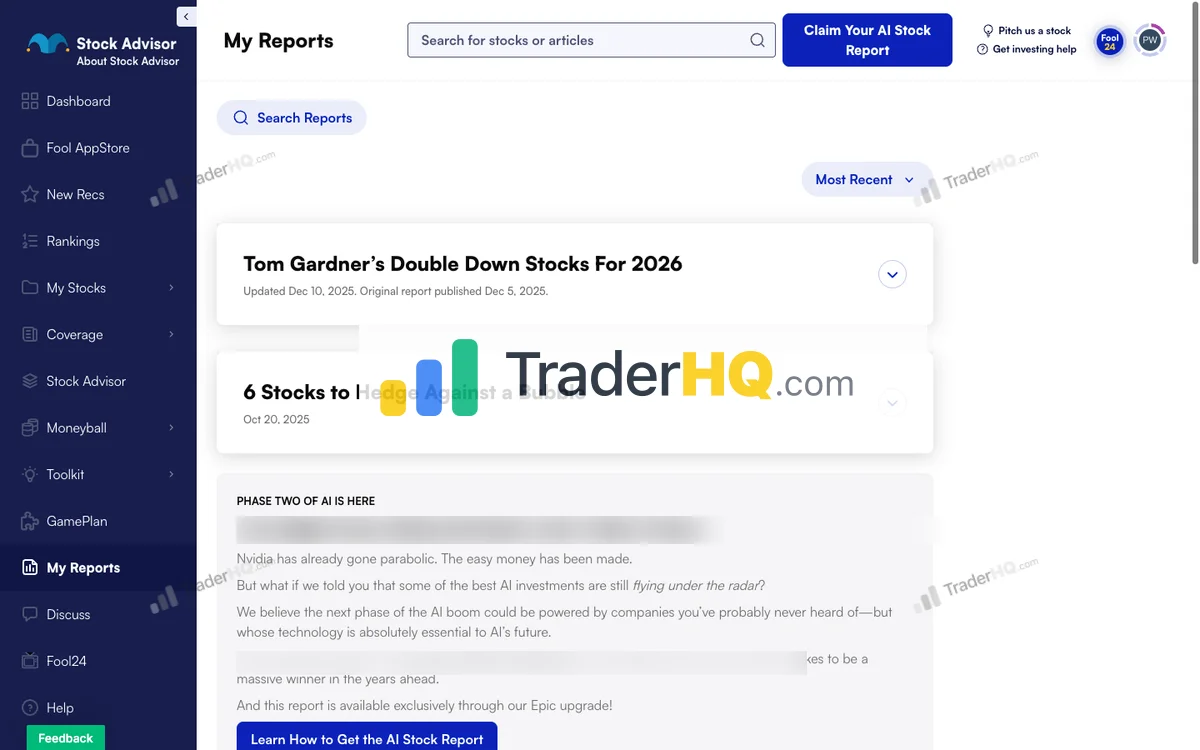
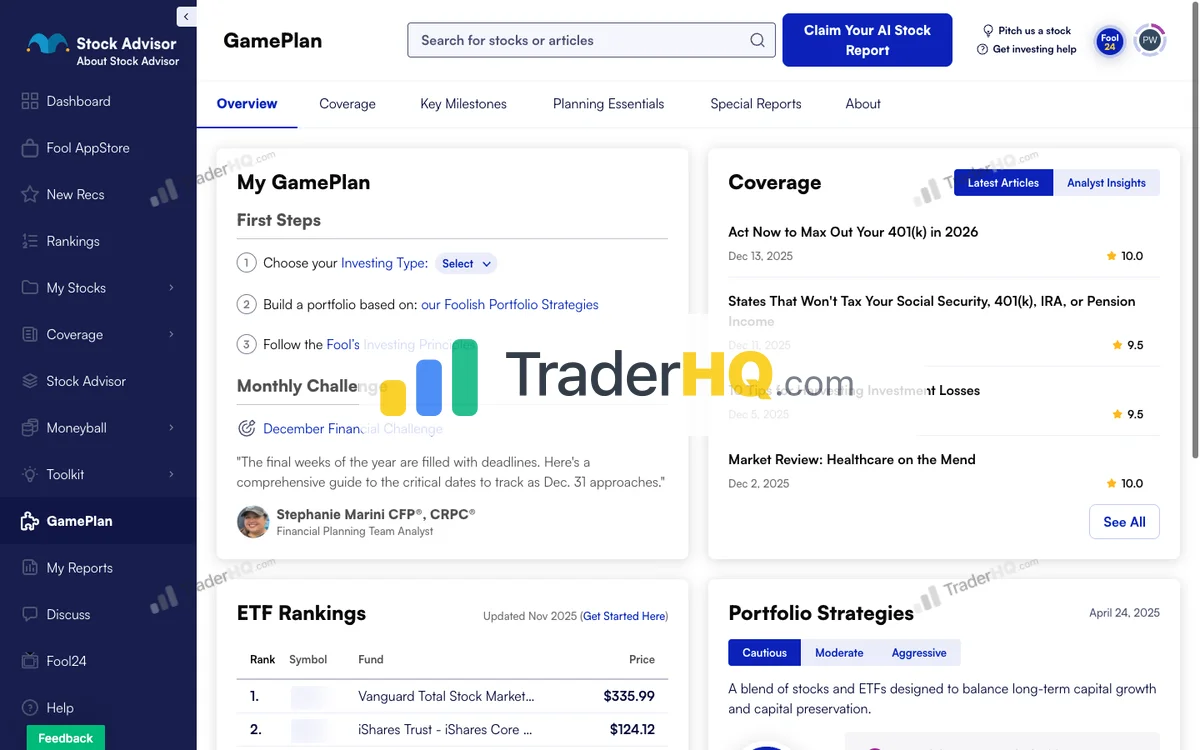
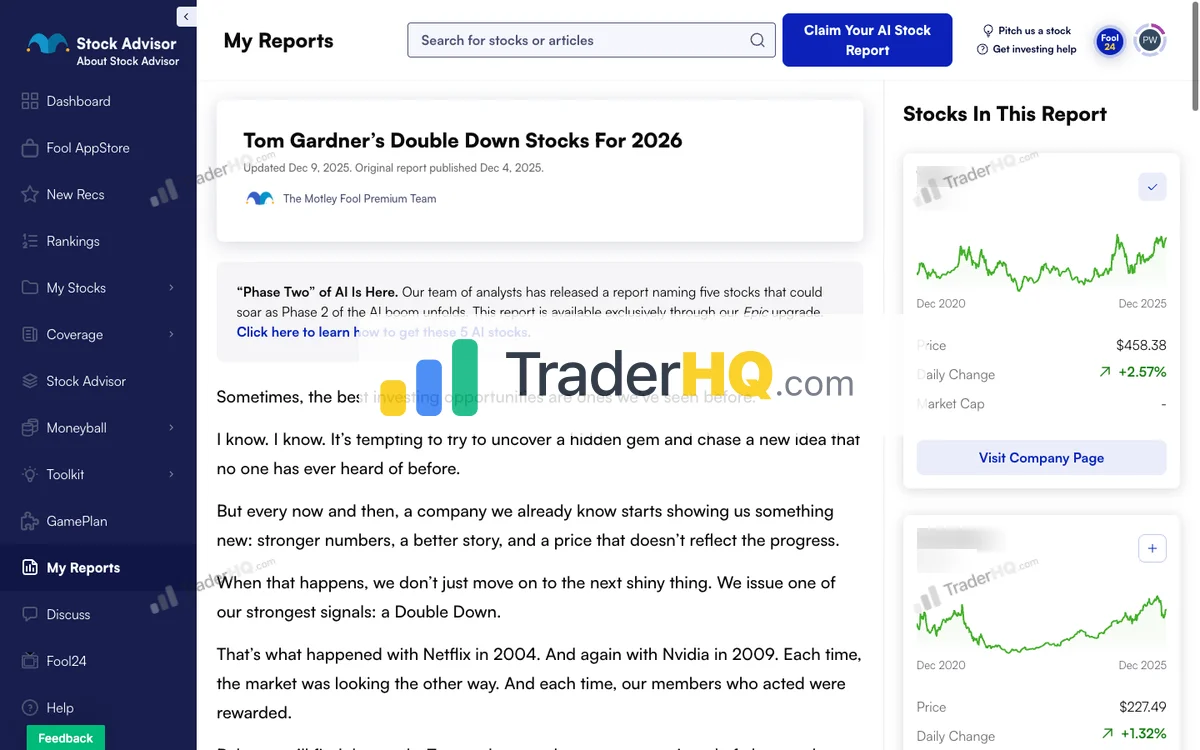
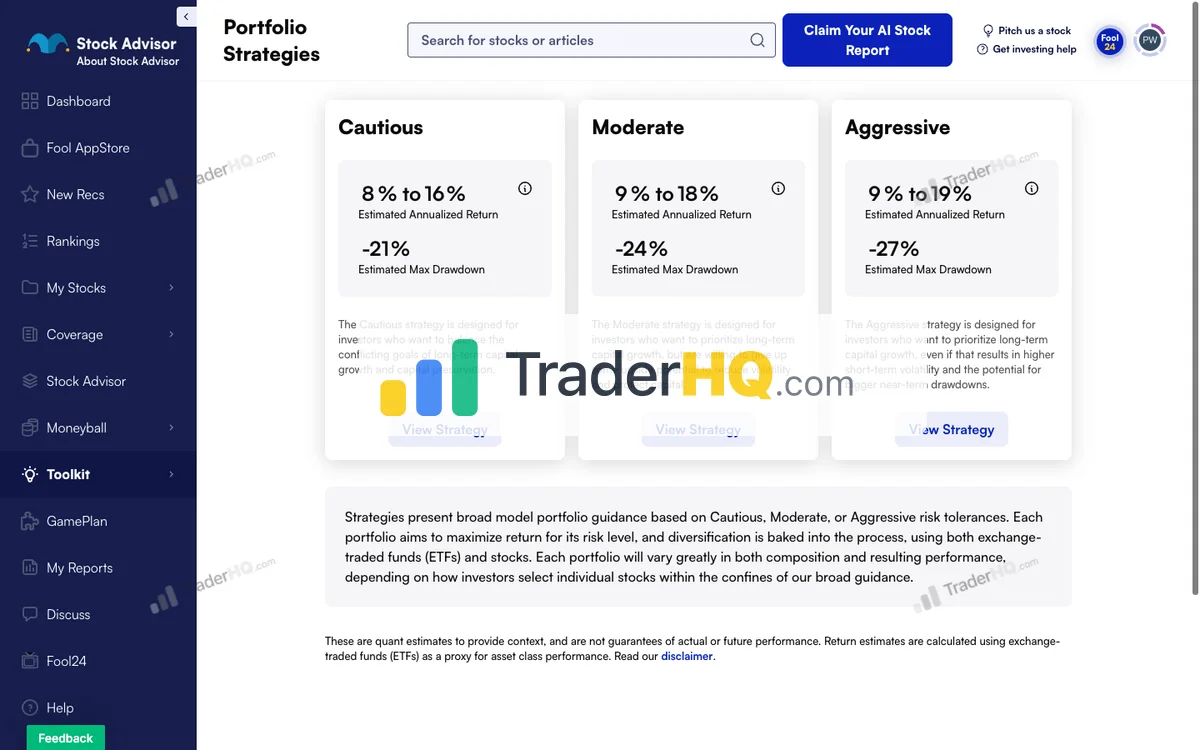
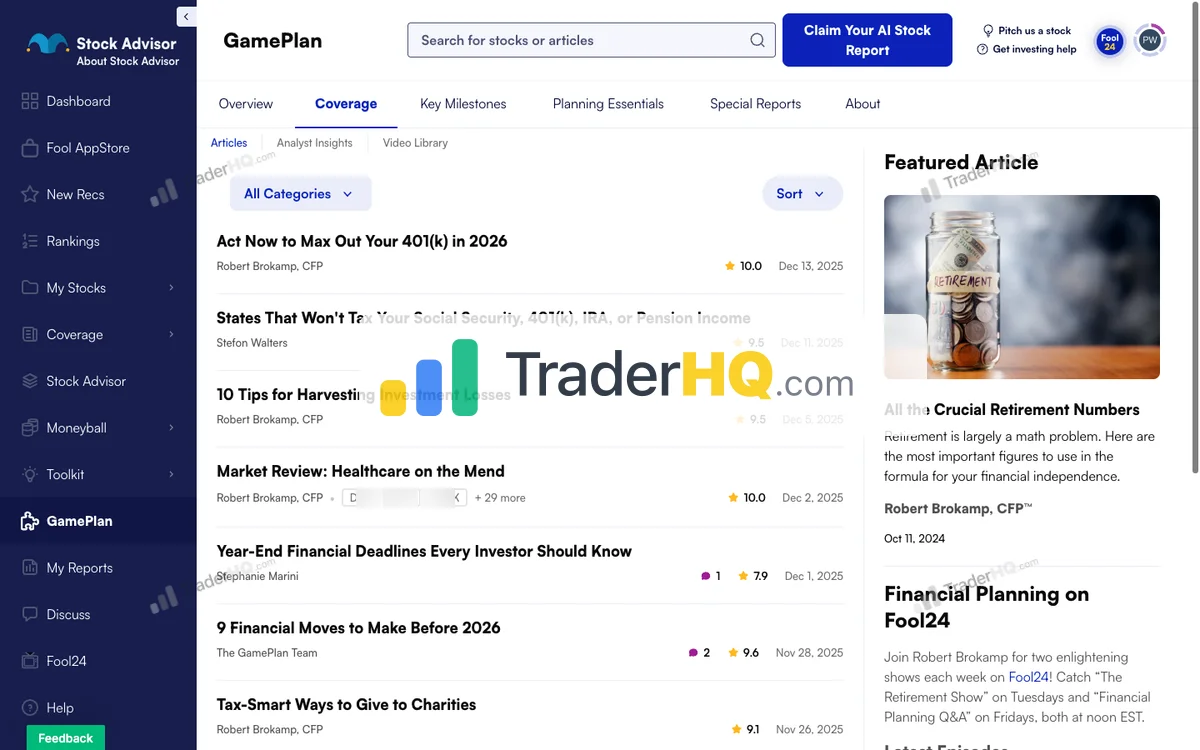
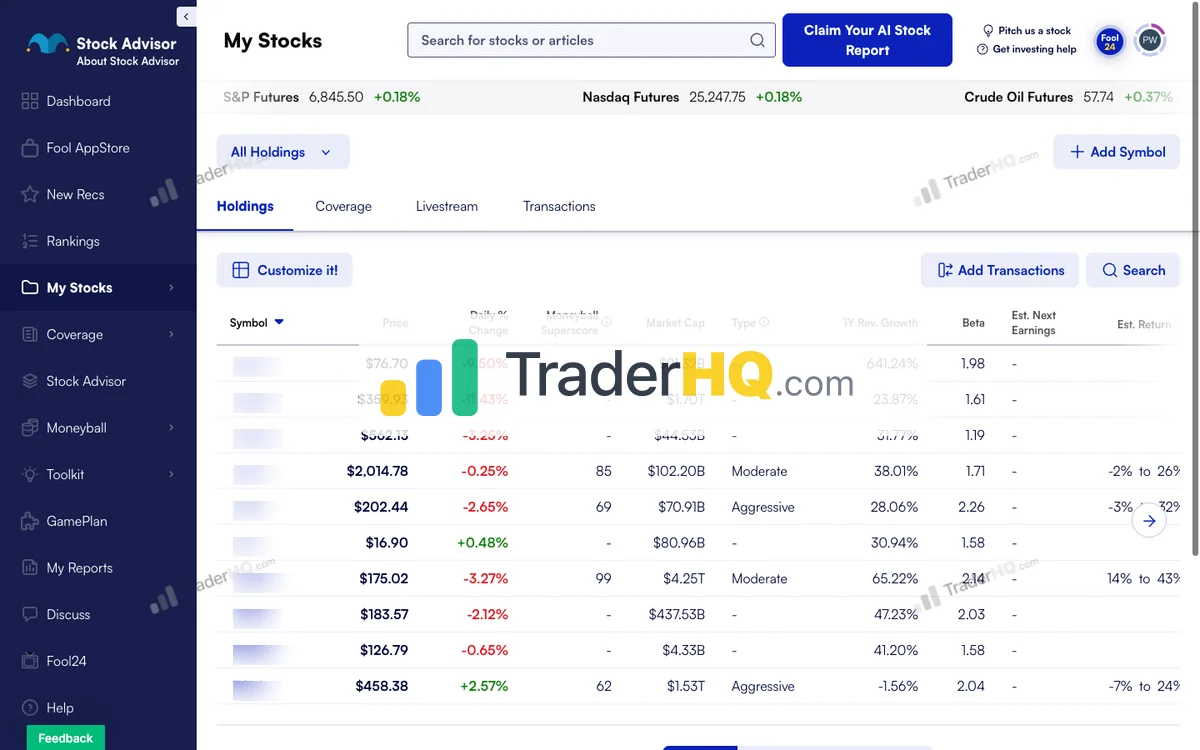
9 screenshots · Click to expand
The Track Record: What the Numbers Actually Mean
+978.9% total return since February 2002 versus +214% for the S&P 500 (per-position benchmark), across 526 positions — TraderHQ analysis of the published trade log (data as of Aug 31, 2026).
In dollars: $10,000 spread across every 2002 recommendation would be worth about $107,886 today. The same money in the per-position S&P benchmark: about $31,400.
The time curve is the real product:
| Holding Period | Win Rate | Average Return |
|---|---|---|
| Under 1 year | 52.2% | +8.5% |
| 5-10 years | 62.9% | +205.7% |
| 10+ years | 92.2% | +4,051.8% |
The whole book, not the highlight reel: 66% of picks win and 34% lose. Winners average +1,701.7%; losers average −44.5%. The typical (median) pick returned +42.4% — the headline is carried by extraordinary winners like NVDA, recommended in April 2005 and up +133,425% since.
The depth is broad, not lucky: even excluding the top 5% of picks entirely, the average return is still +160.8%. And the winners take time — 191 picks have doubled, the average time to double is 3 years 1 month, and 106 of them took 2+ years. Set expectations accordingly.
We verified this against the actual historical recommendations, losers included. Every pick since 2002 is visible in the scorecard. One more counterintuitive fact: picks made during the Dot-Com Crash averaged +3,425% with an 85% win rate — bear-market entries have historically beaten bull-market entries.
How Stock Advisor Actually Works
2 new stock recommendations per month from Motley Fool’s analyst team. Each comes with a deep-dive thesis, quantitative return ranges with drawdown estimates, risk classifications, and re-recommendation signals when existing picks become more attractive.
The picks aren’t the real product. The portfolio framework is:
- Three portfolio strategies — Cautious, Moderate, Aggressive — calibrated to different risk tolerances and drawdown expectations
- Foundational Stocks — the 10 highest-conviction core holdings with explicit risk classifications. New subscribers should start here, not with the latest pick
- The Moneyball database — 344 companies scored across 12+ dimensions (financial health, product quality, leadership, AI relevance). A research platform that builds your capability rather than your dependency
6 views
The Uncomfortable Reality: Why Most Subscribers Fail
- They can’t hold through drawdowns. The best performers — Netflix, Amazon, Nvidia — all crashed 50-80% at some point. Selling during those crashes forfeited the recovery.
- They sell winners too early. Capping every winner at +100% would have kept just 3.1% of the service’s total gains. The record lives in the tail.
- They joined at the wrong time. The 2021 vintage averaged −13% with a 32% win rate — subscribers who started then have personal results that look nothing like the headline. Judge any vintage at 3-5 years, not 3-5 months.
- They ignore the framework. Cherry-picking “exciting” picks while skipping “boring” ones consistently underperforms the system.
Who Stock Advisor Is For
- Patient investors with 5+ year horizons. Non-negotiable. If you need the money in 2-3 years, index funds are safer.
- Portfolios of $25,000+. At smaller sizes the fee is too large a share of capital.
- Investors who can stomach 30-50% drawdowns. Not theoretically — actually.
- People who want a framework, not just tips.
Who Stock Advisor Is NOT For
- Short-term traders. The average holding period is 6.9 years.
- Income investors. Growth focus, not dividends.
- Investors who hate upsells. The Fool pushes Epic and beyond. Relentlessly.
- Anyone unwilling to hold through a 40% portfolio drop.
Pricing and Value
- Regular Price: $199/year
- New Member Price: $99/year (50% off)
- Refund Policy: 30-day money-back guarantee
At $99/year you’re paying roughly $4 per pick for recommendations backed by a 24.5-year published record — $0.55 a day even at list price. Compare: an hour with a financial advisor ($200-400), or a 1% expense ratio on $100K ($1,000/year). The math works if you follow the system.
The Bottom Line on Stock Advisor
Motley Fool Stock Advisor isn’t perfect — the upsell pressure is annoying, the 2021 vintage is still recovering, and a third of picks lose money.
But the record is real, transparent, and fully published, and the portfolio framework addresses exactly the behaviors that cause most subscribers to fail. If you’re going to try one stock advisory service, this is it.
For a deeper analysis, read our complete Stock Advisor review. Wondering how it compares to the competition? See our Stock Advisor vs Alpha Picks comparison.
2. Alpha Picks by Seeking Alpha — The Quant Challenger

Data-driven investors who trust algorithms over human opinion
Alpha Picks is Seeking Alpha’s pure quant service: no human discretion in selection, and every position published with entry date, exit, and return. Data-driven investors with 1-3 year horizons win with it — if they accept a 4.2-year record, no recession test, and no refunds.
Alpha Picks by Seeking Alpha Performance
Seeking Alpha · 104 picks · 4 years · Updated 2026-09-01
| AP Return | S&P 500 | Alpha | Win Rate |
|---|---|---|---|
| +348% | +104% | +244% | 66% |
S&P 500 shows what you'd have earned buying the index on each pick date instead. Same timing, fair comparison.
| AP Multi-Baggers | 10x+ | 5x+ | 3x+ | 2x+ |
|---|---|---|---|---|
| Count | 1 | 4 | 12 | 19 |
| AP Asymmetry | Avg Winner | Avg Loser | Ratio |
|---|---|---|---|
| Return | +122% | -22% | ~6:1 |
Best Performers (All-Time)
| AP Pick | Return |
|---|---|
 STRL Sterling Construction | +653% |
**** Casual Dining | +346% |
**** Power Plant Construction | +357% |
**** Memory Chips | +403% |
**** Thermal Management | +348% |
 APP AppLovin | +1.6K% |
**** Homebuilder | +228% |
 SMCI Super Micro Computer | +969% |
 POWL Powell Industries | +887% |
 CLS Celestica | +1.2K% |
Latest Alpha Picks Picks
Tickers masked to protect subscriber value. Recent picks need 3-5+ years to demonstrate thesis.
| AP Pick | Return |
|---|---|
**** Memory Chips | +403% |
**** Circuit Board Manufacturing | +102% |
**** Growth Company | +75% |
**** Growth Company | +74% |
**** Gold Mining | +44% |
**** Growth Company | +42% |
**** Growth Company | +26% |
**** Growth Company | +26% |
**** Connectivity Chips | +26% |
**** Growth Company | +11% |
Alpha Picks Win Rate by Holding Period
| Hold Time | AP Win Rate | Avg Return |
|---|---|---|
| < 1 Year | 47.6% | +10% |
| 1-3 Years | 77.6% | +95% |
| 3-5 Years | 100% | +437% |
| 5-10 Years | N/A% | N/A |
| 10+ Years | N/A% | N/A |
Alpha Picks Performance by Year
| Year | AP Picks | Avg Return | Win Rate | |
|---|---|---|---|---|
| 2026 | 16 | -6% | 38% | LITE+42% |
| 2025 | 24 | +59% | 75% | MU+403% |
| 2024 | 24 | +65% | 67% | EAT+346% |
| 2023 | 24 | +155% | 71% | CLS+997% |
| 2022 | 16 | +65% | 75% | MOD+348% |
Inside Alpha Picks
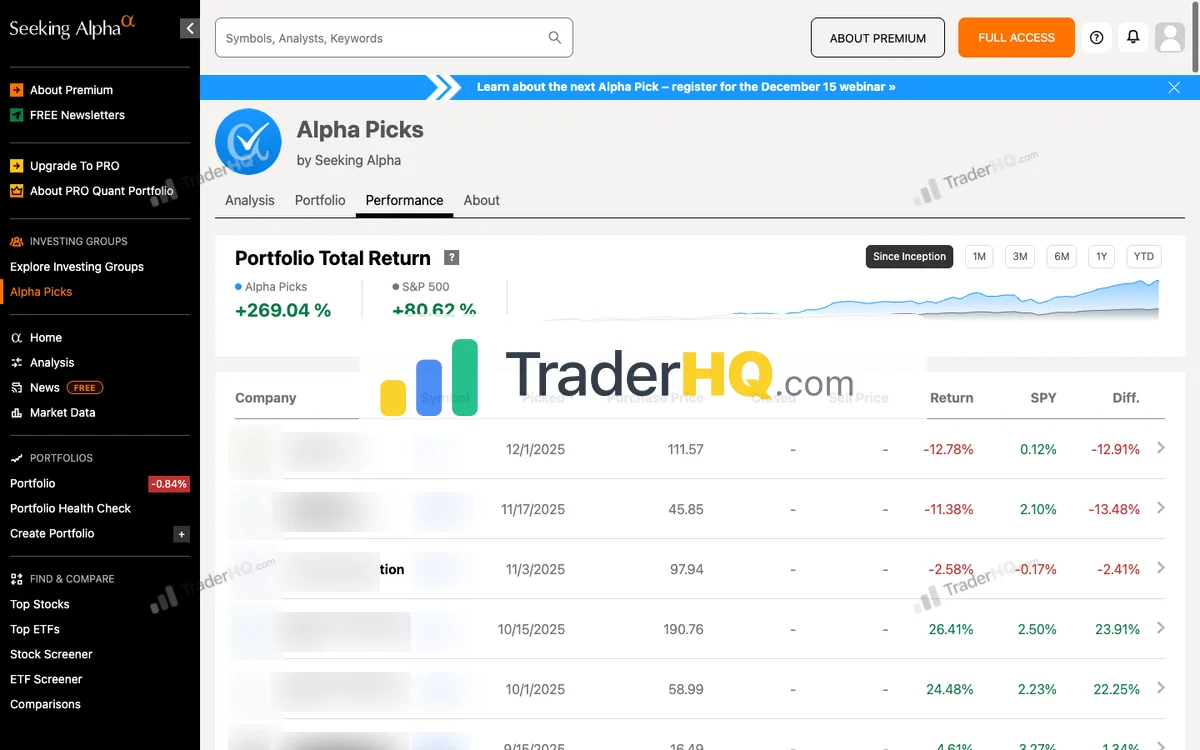
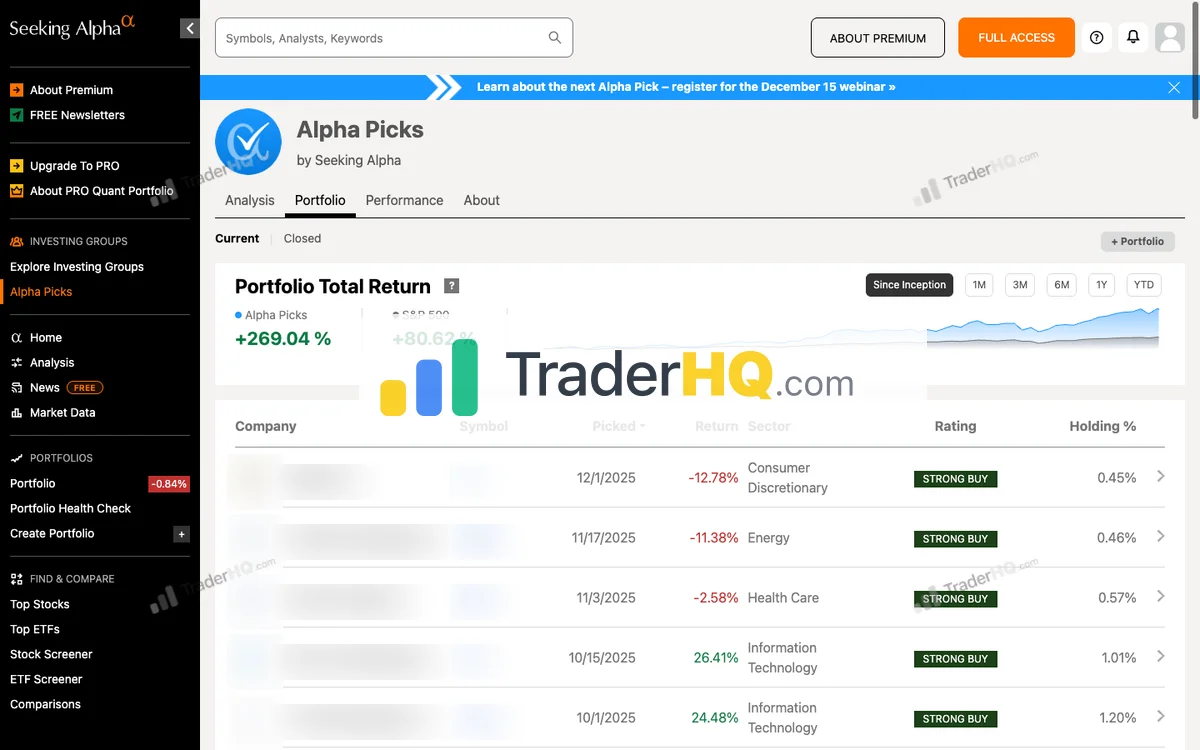
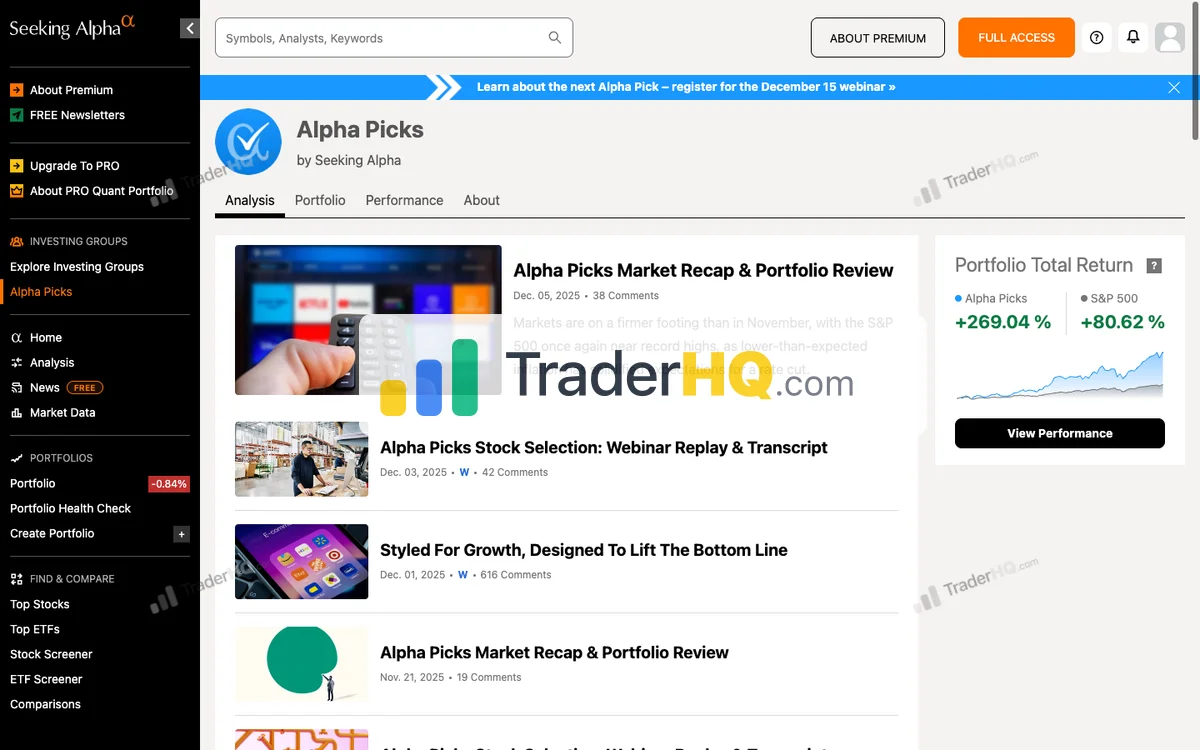
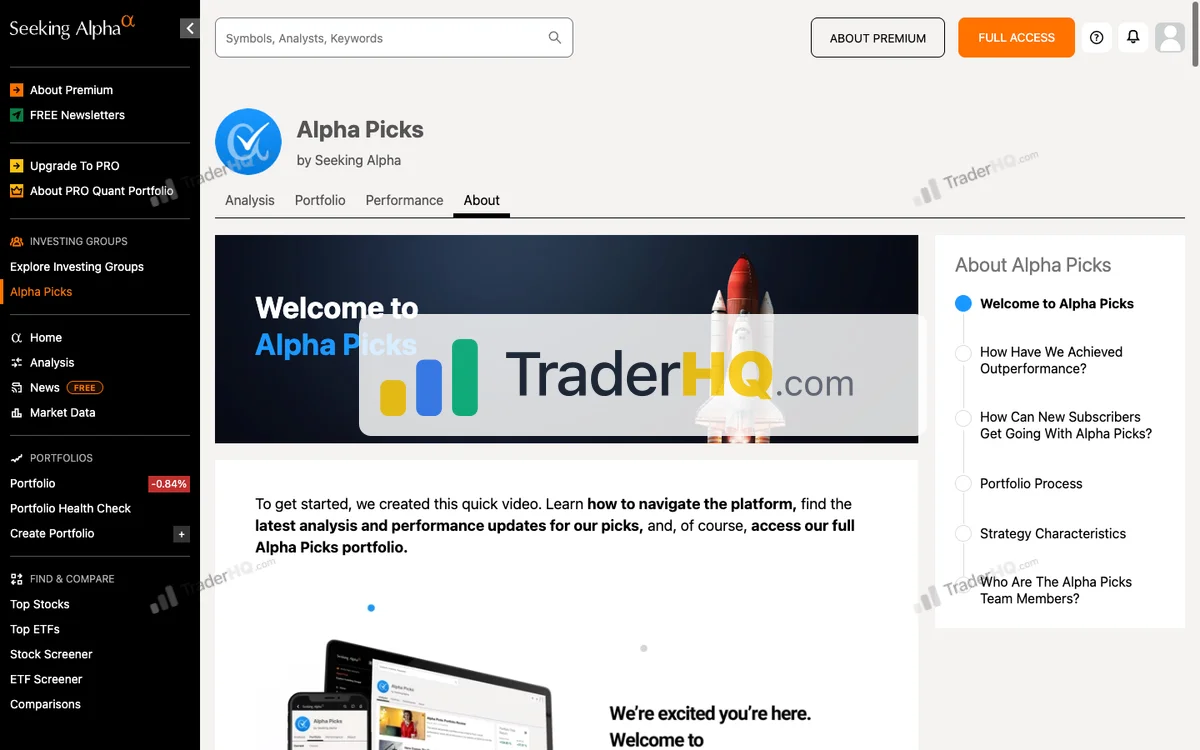
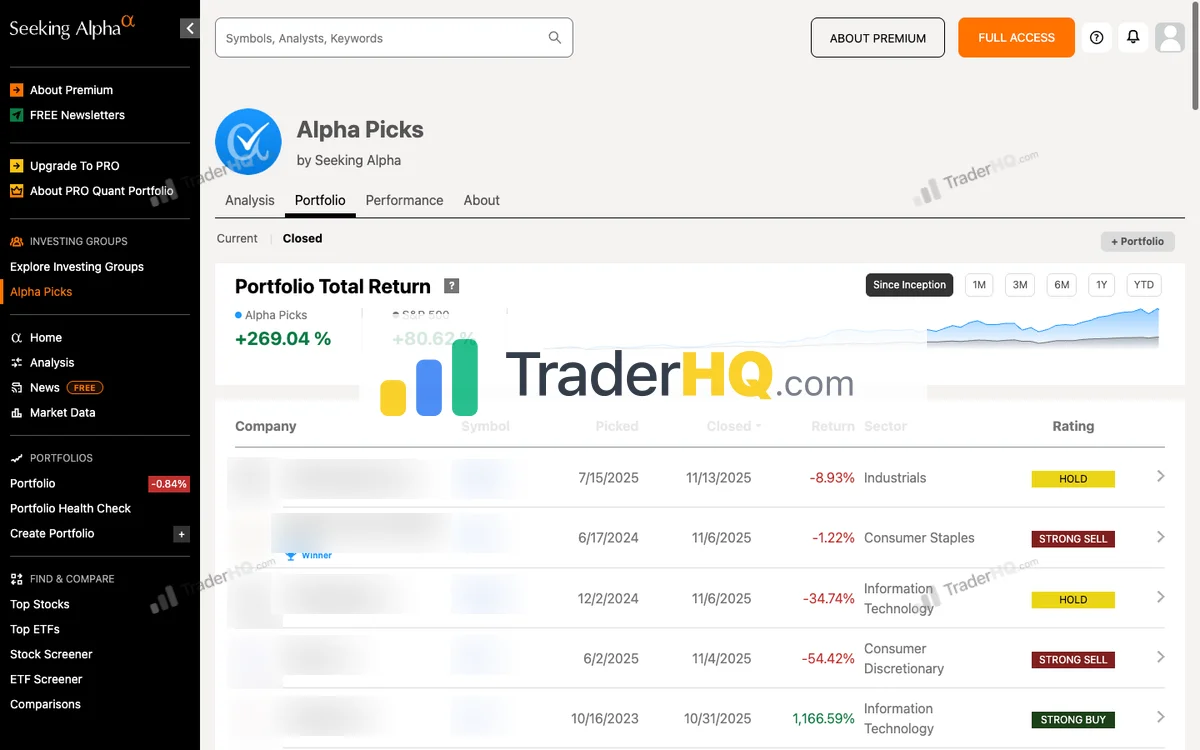

6 screenshots · Click to expand
The Track Record: Shorter But Impressive
- +347.9% total return since July 2022 (vs +103.8% for the S&P 500, per-position benchmark) across 104 positions — TraderHQ analysis of the published trade log (data as of Sep 1, 2026)
- 66% win rate — 34% of picks lose money; winners average +121.8%, losers just −21.6%
- 3 ten-baggers, 21 doublers in 4.2 years
- The median pick returned +20.8% — solid rather than spectacular; the fat right tail does the heavy lifting
- Even stripping out the top 5% of picks, the trimmed average is +41.1% — the edge isn’t a couple of lucky home runs
- A $10,000 stake at inception simulates to $44,790 (4.5x), assuming all recommendations followed equally
- Position-level texture: MU, recommended October 15, 2025, is up +402.6% in 11 months
How Alpha Picks Works
The system screens US-listed stocks through Seeking Alpha’s Quant Ratings — valuation, growth, profitability, momentum, earnings revisions — and publishes the two highest-rated names each month. No analyst overrides.
The model’s active selling cuts both ways. It caught AppLovin’s +1,571% run, and the same rotation discipline rides the crashes too: APP is down 53.7% in 2026. Its best hit rate actually came in the 2022 bear market, when picks averaged +40.7% with an 82% win rate.
6 views
The Time Curve: Why Patience Pays
| Holding Period | Win Rate | Average Return |
|---|---|---|
| Under 1 year | 47.6% | +9.9% |
| 1-3 years | 77.6% | +94.5% |
That’s a ~9.5x difference in average return based purely on holding period. Capping every winner at +100% would have forfeited 61.5% of total returns. Selling early is the main way to lose with this service.
Who Alpha Picks Is For
- Data-driven investors who trust algorithms over human opinion
- Patient holders who commit to 1-3+ year holding periods
- Transparency seekers — every position visible, winners and losers
- Investors who want systematic, emotion-free execution
Who Alpha Picks Is NOT For
- Investors who want to understand why — the algorithm is a black box
- Those who need portfolio guidance — picks only, no construction framework
- Investors who think in decades — no 5+ year cohort exists yet
- Anyone who needs a money-back guarantee — there isn’t one
Pricing
- Regular Price: $499/year
- New Member Price: $449/year (10% off)
- Refund Policy: None (annual billing only)
No refund policy is a real cost of trying this service — factor it in.
The honest caveat: the 2026 vintage is underwater so far (16 picks, −6% average, 38% win rate). Young picks always look worst, so this may be an early-stage artifact — but the data can’t yet prove the edge persists. Stock Advisor’s 24.5-year record through 2008, 2020, and 2022 carries more through-cycle proof for long horizons.
For our complete analysis, see our Alpha Picks review. Curious how it stacks up against other stock advisors? Check our Alpha Picks vs Mindful Trader comparison.
3. Motley Fool Rule Breakers — The Aggressive Growth Play
Rule Breakers is Stock Advisor’s aggressive sibling — same analyst DNA, hunting disruptive innovators before they become obvious. Investors with genuine 5+ year horizons and 50%+ drawdown tolerance win with it; everyone else should stay with the flagship.

Motley Fool Rule Breakers Performance
The Motley Fool · 217 picks · 22 years · Updated 2026-08-19
| RB Return | S&P 500 | Alpha | Win Rate |
|---|---|---|---|
| +312% | +186% | +126% | 74% |
S&P 500 shows what you'd have earned buying the index on each pick date instead. Same timing, fair comparison.
| RB Multi-Baggers | 10x+ | 5x+ | 3x+ | 2x+ |
|---|---|---|---|---|
| Count | 37 | 65 | 90 | 105 |
| RB Asymmetry | Avg Winner | Avg Loser | Ratio |
|---|---|---|---|
| Return | +918% | -36% | ~25:1 |
Best Performers (All-Time)
| RB Pick | Return |
|---|---|
SHOP Shopify | +7.0K% |
 MNST MNST | +3.2K% |
TSLA Tesla | +16K% |
 ANET Arista Networks | +4.3K% |
 ISRG Intuitive Surgical | +7.9K% |
 VRTX Vertex Pharma | +4.8K% |
 GOOGL Alphabet (Google) | +3.1K% |
 PANW Palo Alto Networks | +3.2K% |
 MELI MercadoLibre | +13K% |
 AVGO Broadcom | +3.2K% |
37 ten-baggers. These 1,000%+ winners—NVDA, NFLX, AMZN—are what drive the portfolio. You don't need to pick all winners; you need a few massive ones.
See All Rule Breakers Recommendations →Latest Rule Breakers Picks
Tickers masked to protect subscriber value. Recent picks need 3-5+ years to demonstrate thesis.
| RB Pick | Return |
|---|---|
**** Life Sciences Software | +42% |
**** Growth Company | +21% |
**** Growth Company | +17% |
**** Growth Company | +14% |
**** Growth Company | +6% |
**** Social Platform | -11% |
**** Growth Company | -12% |
**** RNA Therapeutics | -18% |
**** Growth Company | -34% |
**** Growth Company | -34% |
Lessons from 2011. 4 picks that year averaged +4.5K%. Best performers often come from buying during uncertainty—when conviction feels hardest.
Rule Breakers Win Rate by Holding Period
| Hold Time | RB Win Rate | Avg Return |
|---|---|---|
| < 1 Year | 41.7% | -7% |
| 1-3 Years | 61.3% | +47% |
| 3-5 Years | 55.3% | +60% |
| 5-10 Years | 69.8% | +212% |
| 10+ Years | 98.6% | +1.8K% |
The 5-10 year sweet spot. 69.8% win rate, +212% average returns. Long enough for thesis to play out, recent enough to reflect current dynamics.
Rule Breakers Performance by Year
| Year | RB Picks | Avg Return | Win Rate | |
|---|---|---|---|---|
| 2026 | 9 | +2% | 63% | VEEV+42% |
| 2025 | 12 | +1% | 42% | BBIO+99% |
| 2024 | 16 | +63% | 69% | GH+430% |
| 2023 | 19 | +69% | 58% | CRWD+647% |
| 2022 | 19 | +75% | 63% | ANET+678% |
| 2021 | 16 | +39% | 44% | CRWD+210% |
| 2020 | 13 | -16% | 31% | ISRG+100% |
| 2019 | 14 | +118% | 64% | DDOG+661% |
| 2018 | 13 | +403% | 92% | AXON+1.3K% |
| 2017 | 9 | +387% | 89% | TWLO+687% |
| 2016 | 14 | +1.4K% | 100% | SHOP+7.0K% |
| 2015 | 5 | +652% | 80% | AXON+2.5K% |
| 2014 | 11 | +1.1K% | 100% | ANET+4.3K% |
| 2013 | 8 | +456% | 100% | AX+912% |
| 2012 | 8 | +1.4K% | 100% | META+2.4K% |
| 2011 | 4 | +4.5K% | 100% | TSLA+16K% |
| 2010 | 2 | +323% | 100% | OLED+423% |
| 2009 | 7 | +3.4K% | 100% | MELI+13K% |
| 2008 | 4 | +1.6K% | 100% | ISRG+2.8K% |
| 2007 | 7 | +1.1K% | 100% | CMG+2.7K% |
| 2006 | 1 | +3.3K% | 100% | ISRG+3.3K% |
| 2005 | 6 | +3.4K% | 100% | ISRG+7.9K% |
The Track Record: Asymmetric Math
- +311.9% total return since October 2004 (vs +185.7% for the S&P 500, per-position benchmark) across 217 positions — TraderHQ analysis of the published trade log (data as of Aug 19, 2026)
- 74% win rate — winners average +917.5%, losers just −36%
- 37 ten-baggers, led by TSLA (+16,082.8% from its November 2011 recommendation) and MELI (+12,552.7%)
- 105 picks have doubled; the average time to double is 2 years 4 months
- The median pick is up +94.6% — the typical position, not just the TSLA outliers, has paid; a $10,000 inception stake simulates to $41,190 (4.1x)
- One caveat our computation surfaced: all 217 positions are still open, so these are unrealized marks, not banked gains
The Time Curve: Patience Is the Strategy
| Holding Period | Win Rate | Average Return |
|---|---|---|
| First year | 41.7% | −7% |
| 10+ years | 98.6% | +1,775.1% |
First-year picks start underwater on average. Hold a decade and nearly every pick has paid. Time horizon isn’t a suggestion here — it’s the entire strategy.
How Rule Breakers Works
2 new picks per month targeting companies breaking the rules of their industries — think early Amazon, Netflix, Tesla. Each pick includes a disruption thesis, estimated return ranges, maximum drawdown estimates, and risk classifications.
Important: Rule Breakers no longer exists as a standalone subscription. It’s bundled inside Motley Fool Epic ($299/year), which also includes Stock Advisor and two additional scorecards.
No screenshots available for motley-fool-rule-breakers
Who Rule Breakers Is For
- Aggressive growth investors with genuine 5+ year horizons
- High risk tolerance — 50%+ drawdowns on individual positions happen
- Believers in disruptive innovation as a thesis
- Existing Stock Advisor members who want a more aggressive sleeve
Who Rule Breakers Is NOT For
- Income investors — growth stocks, not dividend payers
- Short-term traders — the math needs years
- Subscribers from 2020-2021 still frustrated — the 2020 vintage (−16% average) is the worst in the book, and the time curve above is the honest answer
- Anyone who can’t watch a position fall 80-90% — it happens
Pricing
- Price: $299/year (via Epic bundle)
- Includes: Stock Advisor + Rule Breakers + 2 additional scorecards
- Refund Policy: 30-day money-back guarantee
If you want both Fool flagship services, Epic is efficient — you’re effectively getting Rule Breakers for about $100/year incremental.
For the complete breakdown, see our Rule Breakers review. Still deciding between the two Motley Fool stock advisors? Read Stock Advisor vs Rule Breakers.
4. Morningstar Investor — The DIY Research Platform

Morningstar Investor is not a stock picker — it’s a research platform that helps you make your own decisions. DIY investors who want professional-grade tools win with it; anyone who wants to be told what to buy should use Stock Advisor or Alpha Picks instead.
What You Get
- Fair Value Estimates — Morningstar’s estimate of what each stock is actually worth; a market price below fair value may mean you’re buying at a discount
- Economic Moat Ratings — competitive-advantage ratings identifying companies that can defend pricing power for decades
- Portfolio X-Ray — upload your holdings and see true allocation, fees, and overlaps
- Screening with 200+ data points — custom screens on valuation, growth, profitability, and momentum
The Track Record Question
Morningstar Investor doesn’t have a track record because it doesn’t make picks — that’s the point. The ratings methodology has been trusted for 40+ years and is recession-tested across multiple market cycles; the quality/moat focus is the industry standard for fundamental analysis.
One honest limit: a fair value estimate shows distance from fair value, not when that gap closes. Cheap can stay cheap for years — the tool tells you what’s expensive, not what happens next. For DIY researchers, it’s still the gold standard.
Who Morningstar Is For
- Self-directed investors who want professional-grade research
- DIY analysts who enjoy the research process
- Investors who want to understand why they’re buying, not just what
- Those building independent capability rather than following picks
Who Morningstar Is NOT For
- Investors who want someone to tell them what to buy — it won’t
- Beginners who need guidance — the learning curve is real
- Those seeking actionable stock picks — use Stock Advisor or Alpha Picks
Pricing
- Regular Price: $249/year
- New Member Price: $199/year (save $50)
- Refund Policy: 7-day free trial
Morningstar is a research platform, not a stock advisor. Read our Morningstar Investor review for the complete analysis.
Try It Free — See the Latest Research
5. 7investing — The Boutique Innovation Service

7investing is a solo-analyst boutique run by Simon Erickson: 1 high-conviction pick per month, deep research, direct analyst access, and zero upsells. Innovation enthusiasts who value depth over volume win with it — knowing the scorecard is members-only and there’s no money-back guarantee.
How 7investing Works
- 1 pick per month (half the volume of most competitors)
- Deep-dive video thesis with peer scrutiny
- Discord community for direct interaction with Simon
- Focus on disruptive innovation: AI, quantum computing, biotech, fintech
- 5+ year investment horizon
The Founder Credibility
Erickson led a team of 22 as Lead Advisor of Motley Fool Explorer and managed over $1 million in real-money investments. The background is legitimate; the model is concentrated — all eggs in one analyst’s basket, with the service founded in 2020.
The Trade-Offs
- Performance detail is members-only — there is no public, auditable track record; you can’t verify the full book without joining
- Solo analyst model — no second opinion
- 7-day trial only — no money-back guarantee
- Shorter track record — founded 2020, untested in a downturn
Who 7investing Is For
- Innovation enthusiasts with 5+ year horizons
- Investors who value direct analyst access and community engagement
- Those frustrated by upsells — 7investing has none
- People who want deep research on fewer picks
Who 7investing Is NOT For
- Bargain hunters — $199/year for 12 picks vs Stock Advisor’s 24
- Those needing immediate performance validation — no public track record
- Passive investors — engagement is required to get full value
Pricing
- Price: $199/year
- Refund Policy: 7-day free trial (no money-back guarantee)
6. Zacks Premium — The Earnings-Focused Quant

Zacks Premium is built on one of the oldest documented anomalies in investing: earnings estimate revisions predict stock performance. Earnings-focused investors who follow estimate revisions win with it — if they tolerate a dense platform and aggressive upselling.
How the Zacks Rank Works
Stocks are rated 1-5 on earnings estimate revisions, updated daily with no human discretion:
- 1 = Strong Buy — analysts raising estimates aggressively
- 2 = Buy — estimates trending higher
- 3 = Hold — mixed signals
- 4 = Sell — estimates declining
- 5 = Strong Sell — analysts cutting aggressively
Founded in 1978 by Len Zacks (MIT PhD), the firm pioneered research on the predictive power of earnings revisions. The Zacks Rank has been in continuous use since 1988 — 37+ years of real-world application.
The Track Record
Zacks claims strong backtested performance, though specific numbers aren’t prominently displayed. The methodology is academically sound — the earnings-revisions effect is well-documented in financial research.
The Trade-Offs
- Overwhelming content volume — Zacks throws everything at you
- Aggressive upselling to higher tiers (Ultimate, Black Box, etc.)
- Pricing not always transparent — promotions change frequently
- A research platform, not a pick service — you still do the work
Who Zacks Is For
- Earnings-focused investors who follow estimate revisions religiously
- Quantitative investors who want data-driven signals
- Those comfortable with information overload
Who Zacks Is NOT For
- Investors who want simple stock picks
- Those overwhelmed by dense data
- People who dislike aggressive marketing
Pricing
- Price: $249/year
- Refund Policy: 30-day money-back guarantee
7. Danelfin — The AI-Powered Scorer

Danelfin applies explainable machine learning to 10,000+ US and European stocks, scoring each on its probability of beating the market over the next 3 months. Active traders win with it; long-term holders shouldn’t — the horizon mismatch is structural.
How Danelfin Works
The platform analyzes 900+ daily indicators per stock, transforming them into 10,000+ features to predict 3-month outperformance. Each stock gets an AI Score from 1-10. The differentiator is explainable AI: unlike black-box systems, Danelfin shows exactly which features drive each score.
The Track Record
- Best-Score Stocks (10/10): +21.05% average outperformance over 3 months (since 2017)
- “Danelfin Best Stocks” Strategy: +263% total return (Jan 2017 - Aug 2024) vs +189% for the S&P 500
- Trade Ideas Win Rate: ≥60% for Buy/Strong-Buy signals
Note: These are company-stated figures. Independent verification recommended.
The Trade-Offs
- 3-month focus — the wrong tool for 5+ year horizons
- Monthly pricing ($39/mo) adds up to ~$468/year — more expensive than it looks
- A scoring tool, not picks — you still decide what to buy
- Learning curve to interpret AI scores and features
Who Danelfin Is For
- AI/quant enthusiasts who want cutting-edge methodology
- Active investors comfortable with 3-month holding periods
- Those who want transparency into algorithmic recommendations
- Investors covering US and European markets
Who Danelfin Is NOT For
- Long-term holders — the horizon doesn’t match
- Passive investors — requires active engagement
- Those seeking fundamental research — pure quant
- Budget-conscious investors — monthly pricing accumulates
Pricing
- Price: $39/month (~$468/year)
- Free tier available to try before committing
Try It Free — See AI Stock Scores
The Allocation Reality: How Stock Advisors Fit Your Portfolio
None of these services should be your entire portfolio.
The Core-Explore Framework:
- 90% Core: low-cost index funds (total market, international, bonds)
- 10% Explore: stock advisor picks for potential alpha
If your explore bucket is $50,000, that’s enough for 10-15 positions, and a $199/year service is 0.4% of the allocation. If it’s $5,000, the fee is 4% of capital annually — use the $99 promo or index everything until the base is larger.
Position sizing for a 15-stock advisor-built portfolio:
- Each position starts at ~6.7% of the explore allocation
- New picks start at half-size; add on conviction
- Let winners run — don’t rebalance down
- Hold losers unless the thesis breaks — don’t panic-sell
The Decision Matrix
| If you… | Choose… | Because… |
|---|---|---|
| Have 5+ years and $50K+ | Stock Advisor | Longest verified record; quality GARP suits wide-dispersion markets |
| Are just starting out | Stock Advisor | Best value at $99/yr, complete framework, 30-day guarantee |
| Trust algorithms over humans | Alpha Picks | Quant momentum captures rotation between hardware and software |
| Want aggressive growth | Rule Breakers | 37 ten-baggers over two decades; built for disruption cycles |
| Want to pick your own stocks | Morningstar Investor | Fair value discipline matters most at elevated valuations; 40+ year methodology |
| Value direct analyst access | 7investing | Solo analyst, community-driven, deep research |
| Follow earnings religiously | Zacks Premium | 37+ years of earnings-revision research; fits an earnings-led tape |
| Want AI-driven analysis | Danelfin | Explainable AI, 10,000+ features per stock |
| Want income, not growth | None of these | Look at dividend-focused services instead |
| Are worried about a downturn | Morningstar + Stock Advisor | Both quality-focused, both through-cycle tested |
Frequently Asked Questions
What is a stock advisor?
A stock advisor is a service that recommends which stocks to buy. Unlike robo-advisors that manage money automatically, stock advisors provide specific picks you execute in your own brokerage account, with research explanations and published track records. You keep full control of your investments.
What’s the best stock picking service in 2026?
For most investors, Motley Fool Stock Advisor — the longest verified record (see the table above), a complete portfolio framework, and a 30-day guarantee. For data-driven investors with 1-3 year horizons, Alpha Picks is the stronger fit, with the 2026-vintage caveat covered in its section above.
Is it worth paying for a stock advisor in 2026?
Yes — if you’ll follow the system. The subscription is the small cost; the large one is behavioral. Most subscribers underperform the services they pay for because they sell during drawdowns or take profits too early. The service provides the picks; you provide the discipline. If you won’t, index funds are the honest answer.
How do I choose a stock advisor?
Prioritize verified track records over marketing claims. Look for: (1) performance data that includes losers, (2) a methodology you understand, (3) a holding period that matches your timeline, (4) a price you can justify against your portfolio size, and (5) refund terms that let you test risk-free. Compare options in our stock advisor comparison guide.
Which stock picking service has the best track record?
Motley Fool Stock Advisor has the longest and most verified — 24.5 years across 526 positions, computed pick by pick, with every loser on display. Alpha Picks has the stronger recent record for 1-3 year holds, but 4.2 years and no recession test limit what it can prove. Judge any record by its losers, not its highlights.
What is the best stock advisor for beginners?
Stock Advisor — it includes portfolio strategies (Cautious, Moderate, Aggressive), the Foundational Stocks list to start with, and clear position-sizing guidance. The 30-day guarantee lowers the risk of a first subscription.
Is Motley Fool Stock Advisor worth it?
Yes, for long-term investors who can hold 5+ years. The full math — including the 34% of picks that lose money — is in its track record section above. If you’ll panic-sell in a drawdown, save your money; the record only works for people who hold.
Stock Advisor vs Alpha Picks: Which is better?
It depends on your time horizon. For 5+ year horizons, Stock Advisor wins: 24.5 years of data, a 92.2% win rate on 10+ year holds, and a complete framework. For 1-3 year horizons, Alpha Picks excels (see its time curve above): pure systematic execution and transparency. One uses human analysts; the other is a black box with no refunds.
Are stock advisor returns realistic for new subscribers?
The records are real; your results depend on entry year and behavior. Subscribers who joined in 2020-2021 bought peak growth valuations, and many of those vintages are still recovering — the service’s record is not your record. Judge at 3-5 years, not 3-5 months, and follow the framework rather than cherry-picking.
Can I use multiple stock advisory services?
Yes, but with intention. Complementary pairs work: Stock Advisor (human conviction) + Alpha Picks (quant validation), or Stock Advisor + Rule Breakers (core + aggressive growth). Avoid two services doing the same job. When two services pick different stocks in the same sector, that’s portfolio construction, not conflict — own both if you have the capital.
What’s the difference between stock advisors and research tools?
Stock advisors tell you what to buy; research tools help you decide for yourself. Stock Advisor and Alpha Picks publish recommendations. Morningstar Investor and Danelfin provide ratings, scores, and data — the buy decision stays yours. Choose based on whether you want guidance or independence.
How much money do I need to use a stock advisory service?
$25,000+ is ideal. At $10,000, a $199 fee is 2% of capital — you’d need to beat the index by 2 points just to break even, and with fewer positions you’re less diversified. Many investors index until they reach $25,000+, then add a service.
Do stock advisory services actually beat the market?
The best ones do, with verified records — see the table and track-record sections above.
But a service’s published record belongs to the picks; your record belongs to your entries, your exits, and your temperament. Subscribers who buy after gains are announced and sell the first losers get personal results that look nothing like the time-weighted figures. That distance is where almost all subscriber disappointment lives.
What’s the best strategy when stock advisor picks conflict with each other?
Diversification is the strategy — own both positions if you have the capital. Different methodologies will naturally disagree: Stock Advisor might flag a quality compounder where Alpha Picks flags a value play in the same sector. The services are finding different paths to outperformance. If capital is limited, prioritize your primary service and use the second for validation.
How do tariffs and policy changes affect stock advisor picks?
Through-cycle services adapt; newer services are unproven. Policy shifts create sector winners and losers, and Stock Advisor’s methodology has navigated multiple policy regimes over two and a half decades. Morningstar’s moat analysis identifies companies with pricing power that can pass costs through. Choose services proven through different policy environments, not just the most recent bull market.
What’s the best free alternative to paid stock advisors?
Index funds. If you won’t pay for picks or follow a system, a low-cost S&P 500 fund will outperform most active investors. Beating the market requires either significant personal research time or paid expertise. There’s no free shortcut that consistently works.
How long should I hold stock advisor picks?
5+ years minimum. Stock Advisor’s own data: picks under a year old are a coin flip (52.2% win rate), while 10+ year holds show a 92.2% win rate with +4,051.8% average returns. Alpha Picks shows the same shape: 47.6% under a year, 77.6% at 1-3 years. The math only works if you hold.
What happens if a stock advisor pick loses money?
Hold unless the thesis breaks. About a third of Stock Advisor picks lose money — the full distribution is in its track record section — and the winners more than compensate. Selling losers locks in losses and prevents recovery. The exception: if the business strategy shifts or the competitive position deteriorates, selling may be right.
Do stock advisors recommend AI stocks?
Yes — both human and quant services. Stock Advisor’s book includes Nvidia from April 2005, one of the greatest picks in the category’s history. But this year shows why owning “AI” as a bucket isn’t a strategy: the gap between AI winners and AI casualties demands company-level selection, which is exactly what these services are built for.
How do stock advisors perform during recessions?
Through-cycle services recover faster than the index. Stock Advisor and Rule Breakers operated through 2008, 2020, and 2022 — falling harder than the index each time, recovering faster.
Alpha Picks and 7investing haven’t been tested through a full recession; that’s a fact about data, not a knock. Expect 30-50% drawdowns even from good services, and keep cash reserves so you never sell at the bottom.
Should I follow stock advisor picks exactly or modify them?
Follow the system first, adapt later. Most underperformance comes from cherry-picking “exciting” picks and skipping “boring” ones, or selling winners early. Run the framework exactly — allocations, sizing, holding periods — for 1-2 years, then personalize. The biggest mistake is assuming you know better than a 24.5-year track record.
What’s the difference between stock advisors and robo-advisors?
Stock advisors tell you what to buy; robo-advisors invest for you. Robo-advisors (Betterment, Wealthfront) manage diversified ETF portfolios automatically — hands-off, index-like returns. Stock advisors recommend individual stocks you buy yourself — more work, more upside potential. Choose robo if you want zero involvement.
How do I know if a stock advisor service is legitimate?
Look for transparent records that include losers. Legitimate services publish every historical pick with dates and returns. Red flags: cherry-picked results, no history, guaranteed returns, pressure tactics. Services with 30-day money-back guarantees (Stock Advisor, Epic) are also easier to test risk-free.
What’s the best stock advisor for dividend investors?
Motley Fool Dividend Investor (included in Epic) or Morningstar Investor. Most services on this list target growth, not income. Dividend Investor targets reliable dividend payers; Morningstar’s Fair Value estimates help identify undervalued income stocks. Epic ($299/year) bundles both approaches.
How do I build a portfolio using stock advisor picks?
Start with 10-15 positions, then add monthly. Begin with Foundational Stocks or Top 10 lists — the highest-conviction names. Allocate equally, add new picks monthly rather than deploying everything at once, and build toward 25+ positions over 12-18 months. No single pick should exceed 5% of your portfolio initially.
The Bottom Line
You came here with a dozen browser tabs and analysis paralysis. You should leave with one decision.
If you’re going to try one stock advisory service, start with Motley Fool Stock Advisor. Not because it’s perfect — the upsells are annoying and a third of picks lose money — but because 24.5 years and +978.9% (TraderHQ analysis of the published trade log, data as of Aug 31, 2026) make it the lowest-regret choice.
The portfolio framework addresses why most subscribers fail, and the 30-day guarantee means you’ll know within a month if it’s not for you. For data-driven investors with 1-3 year horizons, Alpha Picks is the quant complement — with its 2026-vintage caveat and no-refund terms weighed honestly.
The bigger risk isn’t picking the “wrong” service. It’s another year of “researching” while this market pays the people who own the right stocks and starves the people who own the index. Imperfect action beats perfect paralysis. Every time.
Related Stock Advisor Resources
Looking for more in-depth analysis? Explore our stock advisor research:
- How to Use Stock Picking Services Effectively — Maximize your returns
- Best Stock Research Tools — For DIY investors
- Best Investment Newsletters — Alternative stock advisors
- Portfolio Construction Guide — Build around stock advisor picks