You’ve been searching for stock research tools for a while now. Maybe you started with free screeners and realized they’re too shallow. Maybe you tried a subscription and found it wasn’t designed for how you actually invest. The frustration is real: there are dozens of platforms, each claiming to offer “comprehensive” research, but none seem to fit.
Here’s what I’ve learned after years of using these services: the “best” research platform depends entirely on whether you want to do your own analysis, follow expert picks, or trust a quantitative model. Get the match wrong, and you’ll pay for tools you don’t use—or worse, follow recommendations that don’t fit your investment style.
Best Overall for Research: Morningstar Investor for DIY analysis (40+ years, recession-tested). Best for Stock Picks: Stock Advisor with 23+ years and +883.8% returns. See our top recommendations below.
The 196-Point Gap That Proves Research Depth Matters:
Within technology alone — one sector, one label — SNDK is up +155% and INTU is down -41%. That’s a 196-point gap between two stocks your brokerage would both classify as “tech.” Sector-level analysis would have told you “tech is down 2%.” Company-level research would have told you memory/storage stocks averaged ~83% (SNDK +155%, WDC +75%, STX +54%, MU +48%) while enterprise software remained deeply negative (CRM -29%, NOW -29%, WDAY -34%, INTU -41%). The research depth determines the outcome.
The rotation beneath the surface keeps deepening. CPI confirmed at 2.4% (lowest since May 2025), core CPI at 2.5% (lowest since April 2021). Disinflation is validated. The VIX dropped 4.3% to 20.29 as AI panic subsided and tech rebounded on Feb 18. The S&P 500 rallied to ~6,883, within 1.4% of its all-time high, up +0.68% YTD. But the calm surface masks an intensifying rotation underneath.
The broader picture is striking:
- Rotation leaders: Energy +22.5% YTD, Materials +16.9%, Consumer Staples +13.3%, Industrials +12.8%
- Rotation laggards: Financials -4.0%, Tech -2.1% (but massively bifurcated internally)
- The spread: 83 points of dispersion (a new 2026 high) — top 20 stocks average +51.8%, bottom 20 average -30.7%
- Energy names entering the top 20: BKR +36%, SLB +35%
The Fed holds at 3.50-3.75% with a March hold expected. The bond market confirms the setup — the 2-year Treasury yield at 3.47% sits below the fed funds rate, while the 10-year at 4.09%. The yield curve (2s10s) at +62 bps maintains a healthy positive slope. Gold holds above $5,000/oz. Consumer confidence remains at a 12-year low. AAII bears (38.1%) nearly match bulls (38.5%). Credit spreads at 2.94% show no systemic stress — this is rotation, not crisis.
When disinflation is validated and the VIX declines but intra-sector dispersion keeps widening, macro-based investing becomes fragile — company-level fundamental analysis is robust. Manufacturing PMI at 52.6 marks the highest reading since August 2022.
In this environment, knowing what’s cheap vs. what’s expensive is everything. Fair value estimates, moat analysis, and fundamental screening separate investors who find the undervalued opportunities from those who overpay at the top. Your research quality has rarely mattered more. Start with Stock Advisor’s 23-year proven methodology.
Time horizon guides your service choice:
- 1-3 year horizons: Alpha Picks (EXCEPTIONAL fit) with 73% win rate—quant model capturing the sector rotation driving 83-point dispersion (a new 2026 high)
- 5+ year horizons: Stock Advisor (EXCEPTIONAL fit) with 65% win rate, 92.8% for 10+ year holds, 42 ten-baggers
- DIY researchers: Morningstar Investor (GOOD fit) with 40+ years of recession-tested methodology and fair value discipline at CAPE ~40
The Quick Answer
| Rank | Service | Best For | Track Record | Price | Our Take |
|---|---|---|---|---|---|
| 🥇 | Morningstar Investor | DIY researchers | N/A (research tool) | $249/yr | Gold standard for fundamental analysis |
| 🥈 | Stock Advisor | Long-term growth (5+ years) | +883.8% since 2002 | $99/yr | 23-year track record, 92.8% win rate 10+ years |
| 🥉 | Alpha Picks | Quant believers (1-3 years) | +299.6% since 2022 | $449/yr | 73% win rate, 77.8% for 1-3 year holds |
| 4 | Seeking Alpha Premium | Research junkies | N/A (research tool) | $299/yr | 18,000+ analysts, crowd-sourced insights |
| 5 | Simply Wall St | Visual learners | N/A (research tool) | $120/yr | Infographics that make data accessible |
| 6 | Zacks Premium | Earnings-focused | 37+ years of methodology | $249/yr | Earnings estimate revisions pioneer |
| 7 | FastGraphs | Value investors | N/A (research tool) | ~$144/yr (25% off) | 7-day free trial, code affiliate25 |
Note: All services above have detailed reviews. See individual sections below for full analysis, track records, and pricing details.
The Scenario Cheat Sheet:
- Want to do your own research? Morningstar Investor — 40+ years of recession-tested methodology, professional-grade tools
- Want expert picks with a long track record (5+ years)? Stock Advisor — 23 years, +883.8%, 92.8% win rate on 10+ year holds
- Trust algorithms over analysts (1-3 years)? Alpha Picks — quant-driven with +299.6% returns, 77.8% win rate for 1-3 year holds
- Want diverse opinions from real investors? Seeking Alpha Premium — crowd-sourced research
- Prefer visuals over spreadsheets? Simply Wall St — infographics that simplify complexity
- Focus on earnings momentum? Zacks Premium — the original earnings revision methodology
- Value investor seeking fair value? FastGraphs — 25% off with code affiliate25 + 7-day free trial

Understanding the Categories
Before diving into individual services, it helps to understand the three types of stock research platforms:
Analyst-Led Research (Stock Advisor, Zacks): Human experts analyze companies and make specific buy/sell recommendations. You’re paying for their judgment and conviction. The value is in the picks themselves and the thesis behind them.
Quant-Driven Picks (Alpha Picks): Algorithms screen the market using quantitative factors—value, growth, momentum, earnings revisions. No human discretion in stock selection. You’re trusting the model, not an analyst.
DIY Research Tools (Morningstar, Seeking Alpha Premium, Simply Wall St, FastGraphs): Platforms that give you data, screeners, and analysis tools—but don’t tell you what to buy. You’re doing the work; they’re providing the infrastructure.
Most investors benefit from a combination: a DIY tool for your own research, plus a stock-picking service for ideas you might not find yourself.
1. Morningstar Investor — The Professional’s Toolkit

If you want to do your own research at a professional level, Morningstar Investor is the benchmark. This isn’t a stock-picking service—it’s the same caliber of analysis tools that institutional investors use, made accessible to individuals.
Why it earns the top spot: When someone searches for “stock market research websites,” they’re often looking for tools to evaluate companies themselves. Morningstar has been providing independent investment research since 1984. Their Fair Value estimates, Economic Moat ratings, and Star ratings have become industry standards.
What you get:
The platform includes stock and fund screeners with 200+ data points, unlimited analyst reports, and portfolio management tools that track performance, allocation, and fee impact. The Fair Value estimates tell you whether a stock is trading above or below intrinsic worth. The Economic Moat ratings identify companies with sustainable competitive advantages.
Pricing: $249/year ($34.95/month) with a 7-day free trial
Best for: Self-directed investors with $50K+ portfolios who want to make their own decisions using professional-grade research. If you enjoy analyzing businesses and developing your own conviction, Morningstar gives you the tools to do it well.
The trade-off: No stock picks. You’re paying for data and analysis, not recommendations. If you want someone to tell you what to buy, look at Stock Advisor or Alpha Picks instead.
For the complete breakdown of features, tools, and how it compares to other research platforms, see our Morningstar Investor review.
Explore Morningstar Investor — 7-Day Free Trial
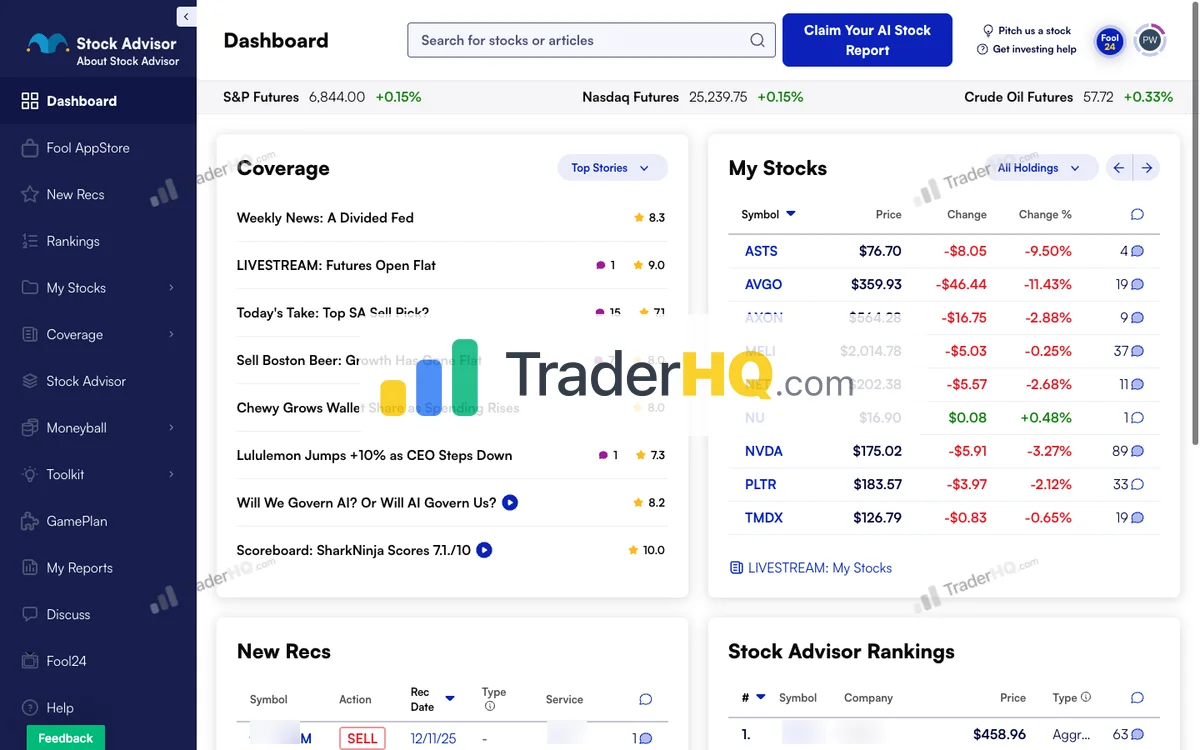
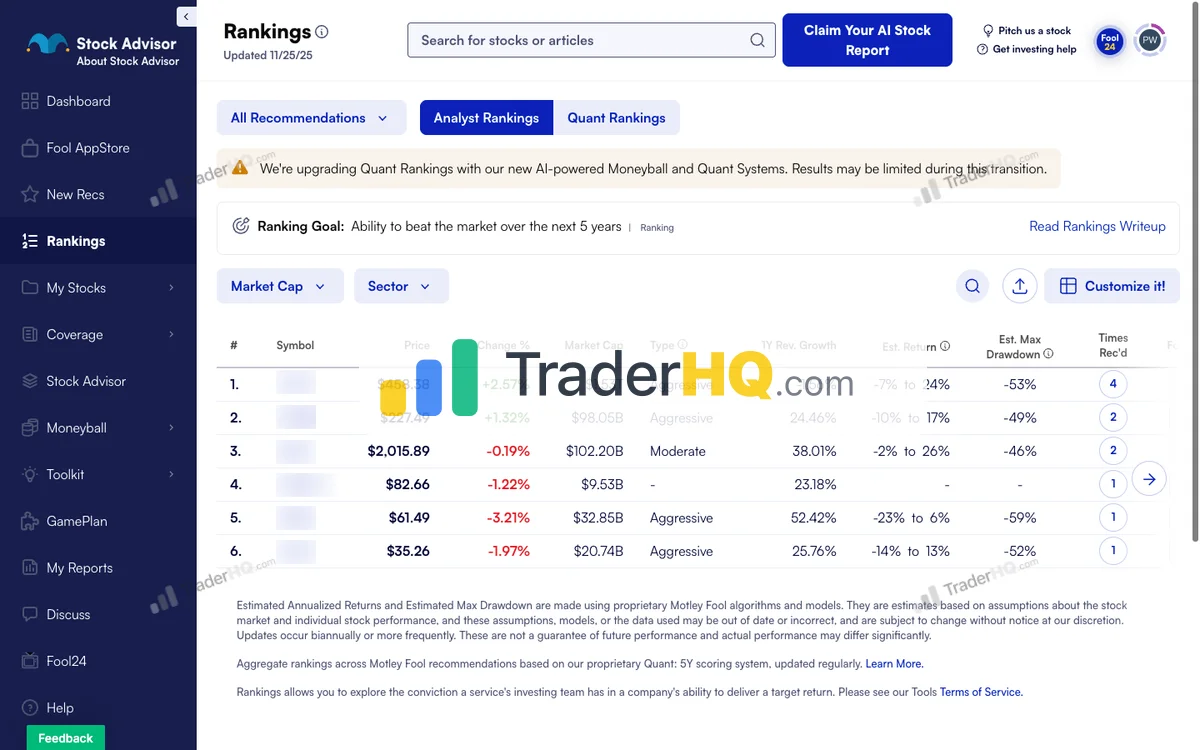
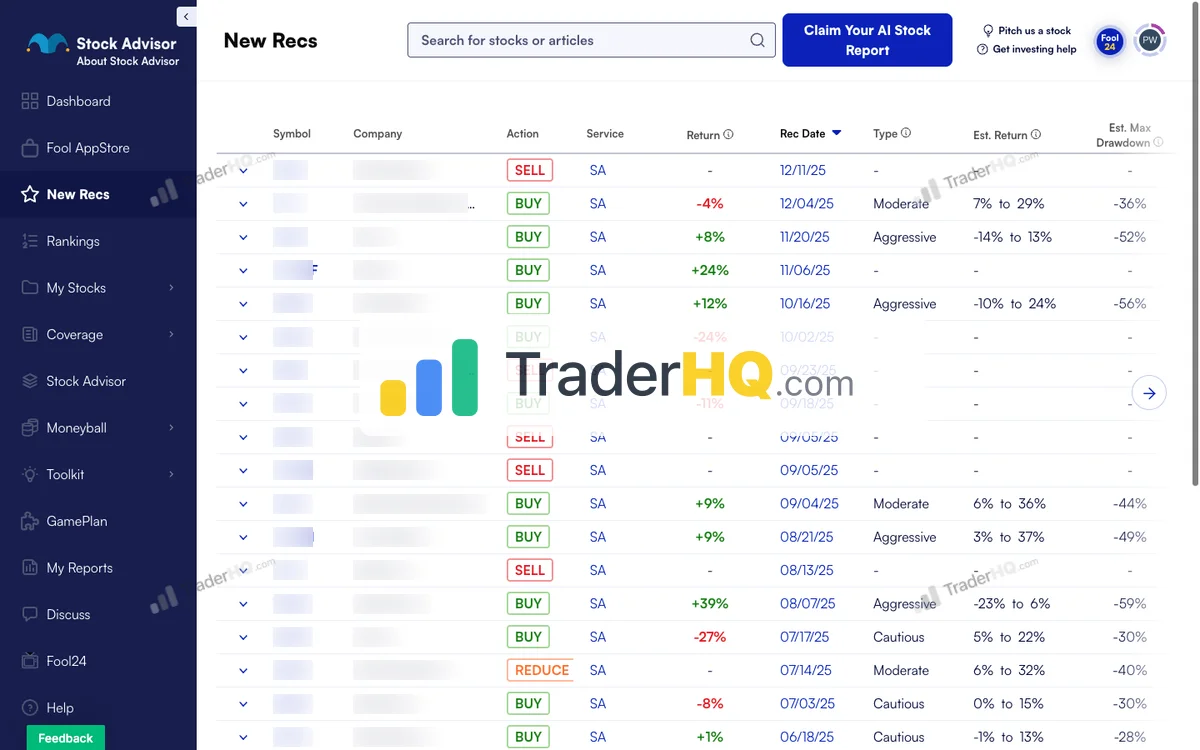
2. Motley Fool Stock Advisor — The 23-Year Track Record

Patient growth investors who hold through volatility for 5+ years
When you want expert stock picks backed by decades of real-world performance, Stock Advisor has the longest verified track record in the industry. Since 2002, the service has delivered +883.8% total returns versus +195.8% for the S&P 500—nearly 4.5x the market.
Motley Fool Stock Advisor Performance
The Motley Fool · 504 picks · 24 years · Updated Feb 18, 2026
| SA Return | S&P 500 | Alpha | Win Rate |
|---|---|---|---|
| +888% | +193% | +695% | 65% |
S&P 500 shows what you'd have earned buying the index on each pick date instead. Same timing, fair comparison.
| SA Multi-Baggers | 10x+ | 5x+ | 3x+ | 2x+ |
|---|---|---|---|---|
| Count | 42 | 86 | 126 | 181 |
| SA Asymmetry | Avg Winner | Avg Loser | Ratio |
|---|---|---|---|
| Return | +1.5K% | -45% | ~34:1 |
Best Performers (All-Time)
| SA Pick | Return |
|---|---|
 AAPL Apple | +5.4K% |
 AMZN Amazon | +26K% |
 DIS Disney | +5.9K% |
 BKNG Booking Holdings | +18K% |
 NVDA NVIDIA | +113K% |
 CTAS CTAS | +4.4K% |
 NFLX Netflix | +41K% |
 MME.DL MME.DL | +4.3K% |
 COST Costco | +3.5K% |
 TSLA Tesla | +19K% |
42 ten-baggers. These 1,000%+ winners—NVDA, NFLX, AMZN—are what drive the portfolio. You don't need to pick all winners; you need a few massive ones.
See All Stock Advisor Recommendations →Latest Stock Advisor Picks
Tickers masked to protect subscriber value. Recent picks need 3-5+ years to demonstrate thesis.
| SA Pick | Return |
|---|---|
**** Chip Equipment | +95% |
**** Mobile App Platform | +70% |
**** Space Launch | +58% |
**** Infrastructure Construction | +46% |
**** Growth Company | +35% |
**** Growth Company | +33% |
**** Growth Company | +24% |
**** Athletic Apparel | +16% |
**** Growth Company | +12% |
**** Athletic Footwear | +5% |
Lessons from 2005. 16 picks that year averaged +7.2K%. Best performers often come from buying during uncertainty—when conviction feels hardest.
Stock Advisor Win Rate by Holding Period
| Hold Time | SA Win Rate | Avg Return |
|---|---|---|
| < 1 Year | 54.3% | +10% |
| 1-3 Years | 58.2% | +13% |
| 3-5 Years | 37.2% | -2% |
| 5-10 Years | 62.8% | +181% |
| 10+ Years | 92.9% | +3.7K% |
504 data points over 24 years. The pattern repeats: early volatility, mid-term clarity, long-term outperformance. The data is the strategy.
Stock Advisor Performance by Year
| Year | SA Picks | Avg Return | Win Rate | |
|---|---|---|---|---|
| 2026 | 2 | 0% | 50% | CASY+4% |
| 2025 | 25 | +6% | 52% | HWM+106% |
| 2024 | 25 | +6% | 58% | SHOP+85% |
| 2023 | 25 | +44% | 75% | CRWD+235% |
| 2022 | 23 | +22% | 43% | NET+285% |
| 2021 | 23 | -33% | 17% | LRCX+360% |
| 2020 | 24 | +82% | 29% | TSLA+1.3K% |
| 2019 | 24 | +36% | 67% | SNPS+243% |
| 2018 | 22 | +155% | 64% | SHOP+795% |
| 2017 | 23 | +568% | 87% | NVDA+7.1K% |
| 2016 | 21 | +367% | 81% | SHOP+3.4K% |
| 2015 | 24 | +195% | 71% | CASY+721% |
| 2014 | 21 | +215% | 81% | IBKR+995% |
| 2013 | 19 | +324% | 68% | NFLX+2.4K% |
| 2012 | 23 | +1.3K% | 74% | TSLA+19K% |
| 2011 | 19 | +492% | 63% | AAPL+2.6K% |
| 2010 | 18 | +418% | 83% | AMZN+2.2K% |
| 2009 | 20 | +2.8K% | 90% | NVDA+48K% |
| 2008 | 18 | +1.0K% | 94% | AAPL+5.4K% |
| 2007 | 19 | +1.5K% | 37% | NFLX+27K% |
| 2006 | 20 | +2.3K% | 65% | NFLX+24K% |
| 2005 | 16 | +7.2K% | 63% | NVDA+113K% |
| 2004 | 17 | +5.4K% | 59% | NFLX+41K% |
| 2003 | 17 | +230% | 65% | BWA+1.4K% |
| 2002 | 16 | +2.6K% | 81% | AMZN+26K% |
Inside Stock Advisor
9 screenshots · Click to expand
The numbers that matter:
We analyzed positions since inception. The overall win rate is 65%, but here’s where it gets interesting: positions held for 5-10 years have a 65.2% win rate with average returns of 199.5%. Hold for 10+ years? The win rate jumps to 92.8% with 42 ten-baggers and 182 doublers.
The winners are massive—NVIDIA recommended in 2005 is up 104,690%. Netflix from 2004 is up 51,020%. Amazon from 2002 is up 28,805%. These aren’t hypothetical backtests; they’re actual recommendations with documented entry dates.
How it works:
Two new stock picks each month from the analyst team, plus a “Top 10 Stocks to Buy Now” ranking updated monthly. Each recommendation comes with a detailed thesis explaining why this business can compound for decades. Three portfolio strategies (Cautious, Moderate, Aggressive) help you match picks to your risk tolerance.
Pricing: $199/year (often $99 first year with promotions), 30-day money-back guarantee
Best for: Long-term investors with 5+ year horizons and $25,000+ to invest. The 92.8% win rate on 10+ year holds and 42 ten-baggers prove the methodology works for patient investors.
The trade-off: Volatility is the price of admission. Some recent picks are down 20-40% from their recommendation prices. The service explicitly prepares you for this—their educational content warns of 30-50% drawdowns as normal for growth investing. If that would cause you to panic-sell, consider a more conservative approach.
Dive deeper into the complete analysis in our Stock Advisor review.
Try Stock Advisor — 30-Day Guarantee
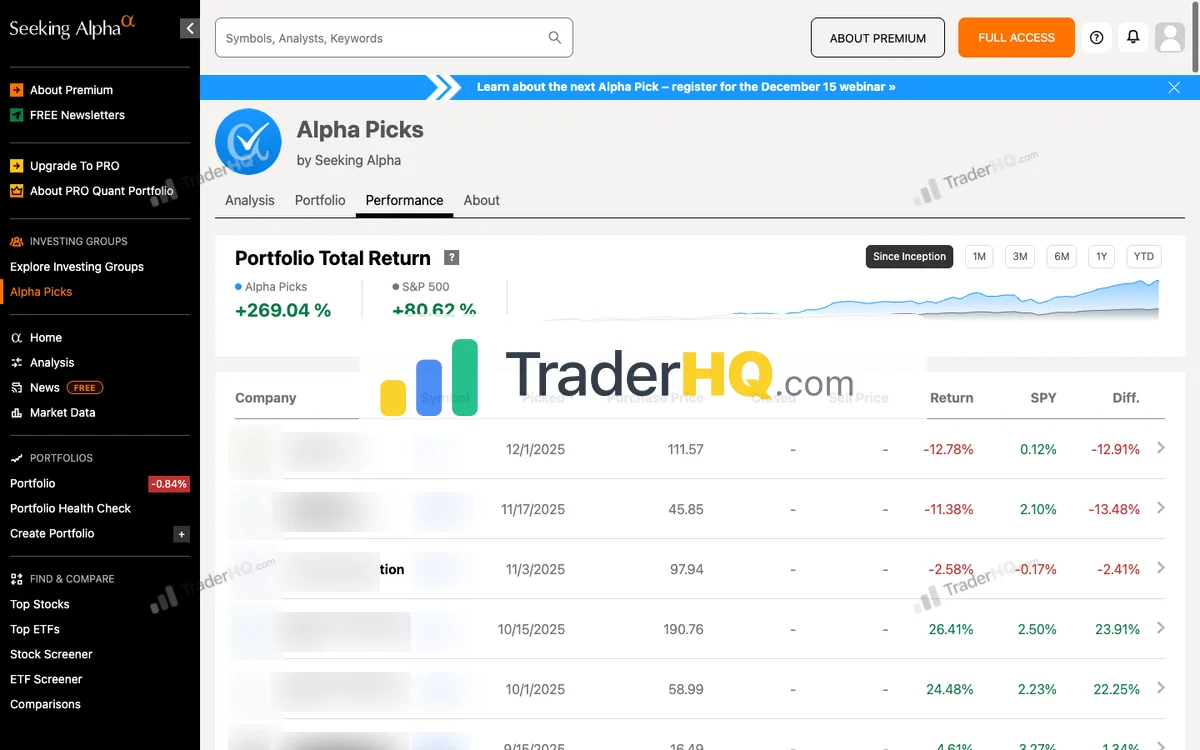
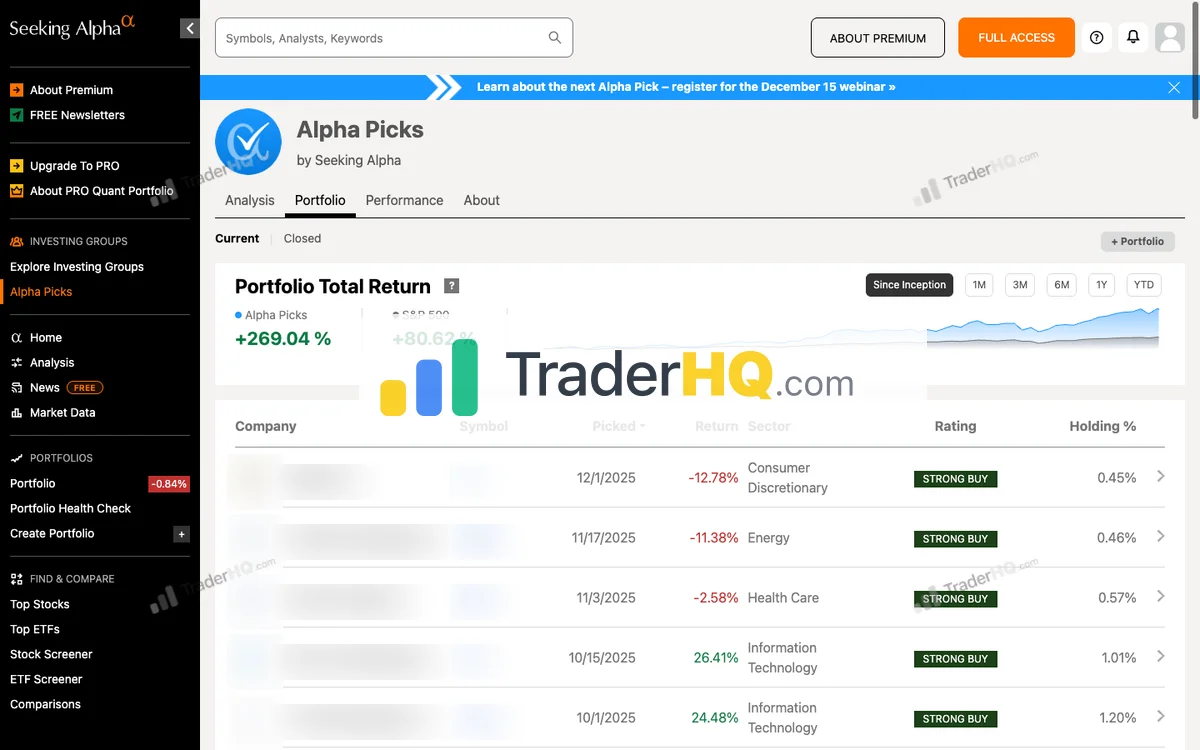
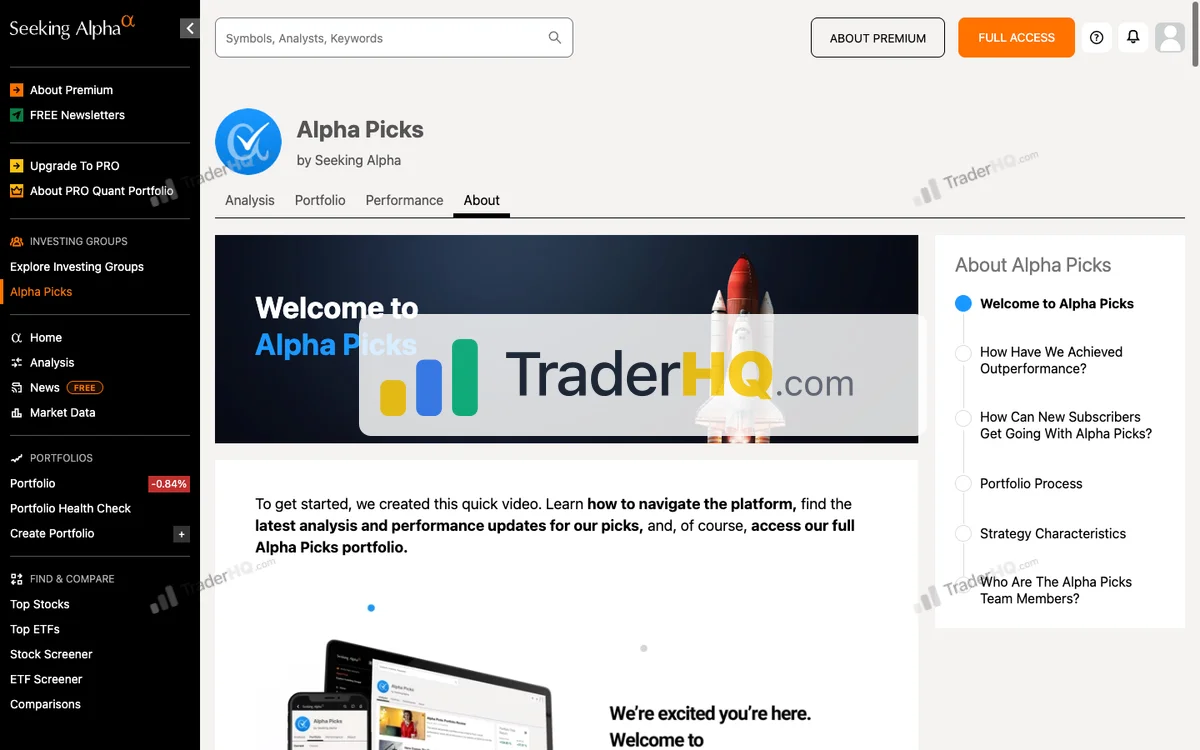
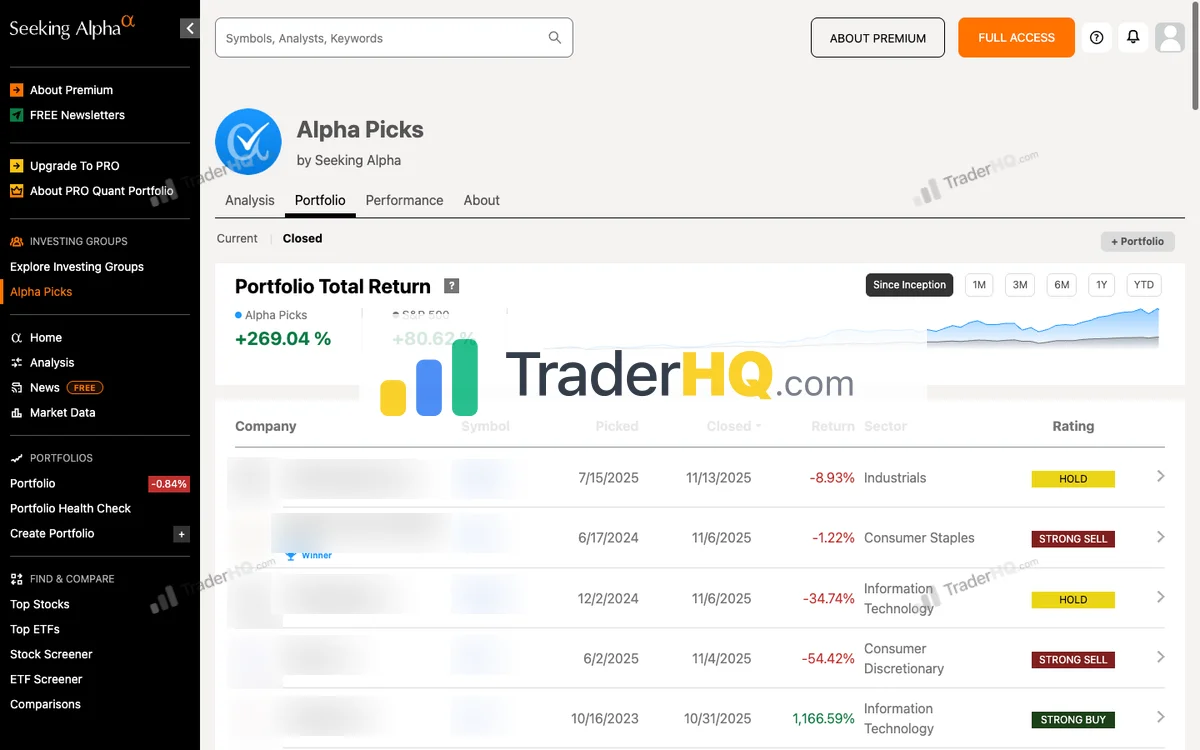
3. Alpha Picks by Seeking Alpha — The Algorithm’s Conviction

Data-driven investors who trust algorithms over human opinion
If you believe math beats narrative, Alpha Picks offers a purely quantitative approach to stock selection. No human analyst discretion—just a model that has delivered +299.6% returns since July 2022 versus +83% for the S&P 500.
Alpha Picks by Seeking Alpha Performance
Seeking Alpha · 92 picks · 4 years · Updated 2026-02-19
| AP Return | S&P 500 | Alpha | Win Rate |
|---|---|---|---|
| +297% | +81% | +216% | 73% |
S&P 500 shows what you'd have earned buying the index on each pick date instead. Same timing, fair comparison.
| AP Multi-Baggers | 10x+ | 5x+ | 3x+ | 2x+ |
|---|---|---|---|---|
| Count | 1 | 4 | 10 | 14 |
| AP Asymmetry | Avg Winner | Avg Loser | Ratio |
|---|---|---|---|
| Return | +110% | -22% | ~5:1 |
Best Performers (All-Time)
| AP Pick | Return |
|---|---|
**** Thermal Management | +348% |
**** Homebuilder | +228% |
**** Growth Company | +153% |
 POWL Powell Industries | +894% |
**** Power Plant Construction | +249% |
 SMCI Super Micro Computer | +969% |
**** Casual Dining | +209% |
 CLS Celestica | +1.2K% |
 APP AppLovin | +1.6K% |
 STRL Sterling Construction | +558% |
Latest Alpha Picks Picks
Tickers masked to protect subscriber value. Recent picks need 3-5+ years to demonstrate thesis.
| AP Pick | Return |
|---|---|
**** Memory Chips | +121% |
**** Precious Metals Mining | +106% |
**** Engineering Services | +77% |
**** Pawn & Financial Services | +63% |
**** Gold Mining | +62% |
**** Dermatology Biotech | +62% |
**** Circuit Board Manufacturing | +59% |
**** Infrastructure Construction | +58% |
**** Growth Company | +37% |
**** Growth Company | +30% |
Alpha Picks Win Rate by Holding Period
| Hold Time | AP Win Rate | Avg Return |
|---|---|---|
| < 1 Year | 65.8% | +14% |
| 1-3 Years | 77.8% | +117% |
| 3-5 Years | N/A% | N/A |
| 5-10 Years | N/A% | N/A |
| 10+ Years | N/A% | N/A |
Alpha Picks Performance by Year
| Year | AP Picks | Avg Return | Win Rate | |
|---|---|---|---|---|
| 2026 | 4 | +8% | 100% | B+11% |
| 2025 | 24 | +30% | 75% | MU+121% |
| 2024 | 24 | +49% | 67% | CLS+259% |
| 2023 | 24 | +161% | 71% | CLS+967% |
| 2022 | 16 | +65% | 75% | MOD+348% |
Inside Alpha Picks

6 screenshots · Click to expand
What the data shows:
We analyzed all positions since launch. The overall win rate is 73%, with winners significantly outperforming losers. The asymmetry is the key: when Alpha Picks wins, it wins big.
The time curve is revealing: under 1 year, the win rate is 64.9%. But hold for 1-3 years, and the win rate jumps to 77.8% with average returns of 123%. This is why we recommend Alpha Picks for 1-3 year horizons.
How it works:
Every month, the quant model scans the entire US equity universe using five factors: Value, Growth, Profitability, Momentum, and EPS Revisions. Stocks must maintain a “Strong Buy” rating for 70+ consecutive days to qualify. The two highest-scoring stocks become that month’s picks.
Exit triggers are equally systematic: the position is sold when the Quant Rating drops below “Hold” or after a 12-month maximum holding period.
Pricing: $449/year (introductory offer available), no money-back guarantee
Best for: Data-driven investors who trust algorithms over human judgment and can commit to 1-3 year holding periods. The 77.8% win rate in that window is exceptional. Caveat: Only 3.6 years of data—Stock Advisor’s 23-year track record provides more confidence for longer horizons.
The trade-off: It’s a black box. You’ll know the factors, but not the specific weightings or why Stock A scored higher than Stock B. If you need to understand why you own something to hold through volatility, this approach may not build the conviction you need.
See our full Alpha Picks review for detailed performance analysis and methodology breakdown. Torn between Alpha Picks and Stock Advisor? We break down the decision in our Stock Advisor vs Alpha Picks comparison.
Explore Alpha Picks — Quant-Driven Stock Picks
4. Seeking Alpha Premium — The Crowd-Sourced Research Hub
Seeking Alpha Premium takes a different approach: instead of one analyst team, you get access to 18,000+ contributing analysts covering stocks that Wall Street ignores. With 20 million monthly visitors, it’s the largest crowd-sourced investment research platform.
What makes it different:
The platform’s Quant Ratings system grades 10,000+ US stocks across five factors—the same methodology that powers Alpha Picks. But Premium gives you the ratings without the picks, letting you apply the insights to your own research.
Unlimited access to 5,000+ monthly articles, complete earnings call transcripts, and 10 years of financial data for every stock. The broker linking feature automatically syncs your portfolio for daily performance tracking.
Pricing: $299/year ($4.95 first month trial), auto-renews
Best for: Research junkies who want diverse perspectives and don’t mind doing their own filtering. The crowd-sourced model means you’ll find analysis on small-caps and international stocks that traditional research firms don’t cover.
The trade-off: Quality varies. Some contributors are professional analysts; others are individual investors who may not be licensed or certified. You need to evaluate sources critically—the platform doesn’t guarantee accuracy.
For a detailed analysis of features and how it stacks up against competitors, read our Seeking Alpha Premium review.
Try Seeking Alpha Premium — $4.95 First Month
5. Simply Wall St — Visual Analysis for Modern Investors

If spreadsheets make your eyes glaze over, Simply Wall St transforms complex financial data into visual infographics that make analysis intuitive. With 7 million registered investors and coverage of 120,000 stocks across 90 global markets, it’s built for accessibility.
The visual difference:
The platform uses Sankey diagrams for revenue flows, snowflake charts for multi-factor analysis, and clear infographics for valuation, financial health, and growth forecasts. Each stock report covers nine dimensions: past performance, risks, valuation, growth, financial health, dividends, management, insider transactions, and rewards.
The portfolio tracker calculates true returns including realized/unrealized gains, dividends, and currency impacts—syncing automatically with 2,000+ brokers via Plaid.
Pricing: Free (limited) / Premium $120/year / Unlimited $180/year, 14-day money-back guarantee
Best for: Visual learners who want to understand companies quickly without wading through financial statements. The global coverage makes it particularly valuable for investors looking beyond US markets.
The trade-off: No stock picks or specific recommendations. The platform provides “general advice only”—you’re getting analysis tools, not investment guidance. Fair value calculations are based on analyst forecasts, which may be inaccurate.
Check out our Simply Wall St review for a deeper look at the platform’s capabilities and visual analysis tools.
Explore Simply Wall St — 14-Day Guarantee
6. Zacks Premium — The Earnings Revisions Pioneer

Zacks Premium is built on a simple insight that founder Len Zacks discovered in the 1970s: when analysts revise their earnings estimates upward, stocks tend to outperform. The Zacks Rank system has been in continuous use since 1988, making it one of the longest-running quantitative methodologies.
The methodology:
Stocks are rated from 1 (Strong Buy) to 5 (Strong Sell) based on earnings estimate revisions, magnitude of changes, analyst agreement, and earnings surprise history. The ratings update daily as new estimate data becomes available.
The platform includes stock and fund screeners, research reports, industry rankings, and mutual fund/ETF analysis—all filtered through the earnings revision lens.
Pricing: $249/year (contact for current offers)
Best for: Investors who believe earnings momentum is the key driver of stock performance. If you follow quarterly earnings closely and want a systematic way to identify positive estimate trends, Zacks provides that framework.
The trade-off: The pricing isn’t transparently displayed—you need to contact sales or complete signup to see current offers. The website can feel dated compared to newer platforms, and detailed terms require customer service contact.
See our comprehensive Zacks Premium review for current pricing and detailed methodology analysis.
Explore Zacks Premium — Earnings-Focused Research
7. FastGraphs — Fair Value for Value Investors

Value investors who want to visualize earnings-based fair value
FastGraphs was built by Charles Carnevale, an engineer who learned in the 1970s that “earnings determine the market price of a publicly traded company in the long run.” The platform visualizes this relationship, showing when stocks are trading above or below fair value based on historical earnings patterns.
The core concept:
The tool overlays stock price against earnings-based fair value, making it immediately visible when a stock is overvalued or undervalued. Valuation metrics include Adjusted/Operating Earnings, Basic Earnings, Diluted Earnings, OCF/FFO, Free Cash Flow to Equity, FFO, AFFO, EBITDA, EBIT, and Sales—all visualized against historical norms.
Coverage includes 18,000+ stocks globally with 10+ years of historical data. Forecasting calculators help project potential returns based on various valuation scenarios.
Pricing (use code affiliate25 for 25% off):
| Plan | Regular Price | With Code affiliate25 |
|---|---|---|
| Premium (annual) | $480/yr ($40/mo) | |
| Basic (annual) | $191.40/yr ($15.95/mo) |
Both plans include a 7-day free trial. No refunds after trial ends.
Premium includes everything in Basic plus advanced portfolios, preset portfolios, broker connections, and advanced screening. Basic includes all 10 valuation metrics, 3 portfolios, and screen creation.
Best for: Value investors who want to visualize earnings-based fair value and identify undervalued opportunities. If you believe in buying below intrinsic value and selling when prices exceed fair value, FastGraphs provides the visual framework.
The trade-off: No stock picks—it’s purely a research tool. The no-refund policy is more restrictive than competitors, so use the 7-day trial thoroughly before committing. Single-device access means you can’t share accounts.
Read our full FastGraphs review to understand how it compares to other value investing tools.
Try FastGraphs — 7-Day Free Trial + 25% Off
The Allocation Reality
None of these services should be your entire investment strategy. Here’s how I think about integrating research platforms into a real portfolio:
The Core-Explore Framework:
- 90% Core: Low-cost index funds (total market, international) that capture market returns
- 10% Explore: Individual stocks selected with help from research platforms
If your “explore” allocation is $50,000, you have room for 15-20 individual positions. A $199-$449/year subscription represents 0.4-0.9% of that capital—easily justified if it helps you find one winner or avoid one disaster.
If your explore allocation is $5,000, subscription costs become a larger percentage of capital. Consider starting with lower-cost options like Simply Wall St ($120/year) or focusing on free research until you’ve built a larger base.
The Combination Approach:
Many serious investors use multiple platforms:
- Morningstar or Simply Wall St for company research and fair value estimates (see our Morningstar Investor review and Simply Wall St review)
- Stock Advisor or Alpha Picks for stock ideas they might not find themselves (compare them in our Stock Advisor vs Alpha Picks breakdown)
- Seeking Alpha Premium for diverse perspectives and earnings call transcripts (see our Seeking Alpha Premium review)
The platforms complement rather than compete—research tools help you evaluate picks from recommendation services.
The Decision Matrix
Still stuck? Use this:
| If you… | Choose… | Because… |
|---|---|---|
| Want to do your own research | Morningstar Investor | Professional tools, Fair Value estimates, Moat ratings |
| Want expert picks (5+ year horizon) | Stock Advisor | 23 years, +883.8% returns, 92.8% win rate 10+ years |
| Trust algorithms (1-3 year horizon) | Alpha Picks | Pure quant, +299.6% returns, 77.8% win rate 1-3 years |
| Want diverse crowd-sourced opinions | Seeking Alpha Premium | 18,000+ analysts, Quant ratings, earnings transcripts |
| Prefer visual analysis | Simply Wall St | Infographics, global coverage, affordable |
| Focus on earnings momentum | Zacks Premium | Earnings revision methodology since 1988 |
| Are a value investor | FastGraphs | 25% off with code affiliate25, 7-day free trial |
| Have less than $10K to invest | Simply Wall St or free tools | Lower cost until portfolio grows |
| Can’t commit to 5+ year horizons | None of these for stock picks | Consider index funds instead |
Frequently Asked Questions
What’s the best stock market research website overall?
For DIY researchers, Morningstar Investor is the gold standard. The 40+ year reputation for independent analysis (recession-tested), Fair Value estimates, and Economic Moat ratings make it the professional’s choice. For stock picks with 5+ year horizons, Stock Advisor has the longest verified track record at +883.8% returns since 2002 with 92.8% win rate on 10+ year holds. For 1-3 year horizons, Alpha Picks’ 77.8% win rate is compelling. See our detailed reviews for full analysis.
What’s the best stock research service for beginners?
Simply Wall St offers the most accessible entry point. The visual infographics make complex financial data understandable, and pricing starts at $120/year. For beginners who want stock picks, Alpha Picks provides a systematic approach that removes emotional decision-making—though the $449/year price point may be steep for smaller portfolios.
Are stock research subscriptions worth the money?
It depends on your portfolio size and time commitment. At $199-$449/year, these services cost less than a single trade commission used to. If a subscription helps you find one stock that doubles or avoid one that crashes 50%, it pays for itself many times over. The math works better with larger portfolios—a $200 subscription on a $5,000 portfolio is 4% of capital annually, while on a $50,000 portfolio it’s just 0.4%.
Motley Fool Stock Advisor vs Alpha Picks — which is better?
It depends on your time horizon:
- 5+ year horizons: Stock Advisor wins with 23 years of data (+883.8%), 92.8% win rate on 10+ year holds, and 42 ten-baggers.
- 1-3 year horizons: Alpha Picks excels with 77.8% win rate and +299.6% returns since 2022. Stock Advisor uses human analysts with narrative reasoning; Alpha Picks is pure quant with no human discretion. Alpha Picks has only 3.6 years of data—a legitimate caveat for long-term investors.
Can I use multiple stock research services?
Yes, and many serious investors do. A common combination: Morningstar or Simply Wall St for company research, plus Stock Advisor or Alpha Picks for stock ideas. The platforms serve different purposes—research tools help you evaluate, recommendation services provide ideas you might not find yourself. See our detailed Morningstar Investor review, Stock Advisor review, and Alpha Picks review for how to combine them effectively.
Do these services work in bear markets?
The best ones do. Stock Advisor’s 23-year track record (+883.8%) includes the 2008 financial crisis, 2020 COVID crash, and 2022 bear market—and delivered through all of them. Morningstar’s 40+ years of methodology is recession-tested. Alpha Picks made during the 2022 bear market showed strong performance. Bad times often create the best entry points—if you have the conviction to buy when others are selling.
What’s the minimum investment needed?
Stock Advisor suggests $25,000+ to build a diversified portfolio of 25+ stocks. Alpha Picks works similarly—with 40+ positions in the model portfolio, you need enough capital to hold meaningful positions without transaction costs eating returns. For smaller portfolios, research tools like Morningstar or Simply Wall St may provide better value until you’ve built a larger base.
How do I cancel these subscriptions?
All services allow cancellation, but refund policies vary. Stock Advisor offers a 30-day money-back guarantee. Simply Wall St has a 14-day guarantee. Alpha Picks and FastGraphs have no standard refund (discretionary only), though FastGraphs offers a 7-day free trial. Morningstar offers a 7-day free trial. Always check current terms before subscribing.
The Bottom Line
You came here with too many browser tabs and not enough clarity. Here’s the simple framework:
If you want to do your own research: Start with Morningstar Investor. The 40+ years of recession-tested methodology and 7-day free trial gives you full access to evaluate whether professional-grade tools match your investing style.
If you want expert stock picks (5+ year horizons): Start with Stock Advisor. The 23-year track record (+883.8%), 92.8% win rate on 10+ year holds, 42 ten-baggers, and 30-day guarantee make it the lowest-regret choice.
If you trust data over narratives (1-3 year horizons): Try Alpha Picks. The 77.8% win rate for 1-3 year holds and +299.6% returns since 2022 prove the systematic approach works.
The bigger risk isn’t picking the “wrong” platform. It’s spending another year researching tools while your money sits in cash earning less than inflation. Imperfect action beats perfect paralysis.
With CAPE at ~40 and the S&P at ~6,883 (barely +0.68% YTD despite validated disinflation), the rotation challenge is visceral: the index barely moves while individual stocks diverge by 83 points — a new 2026 high. The VIX declining to 20.29 tells you fear is fading, but the bond market (2-year yield at 3.47%, below fed funds; 10-year at 4.09%) confirms the rotation has room to run. Within technology alone, memory/storage surged (SNDK +155%) while enterprise software stays deeply negative (INTU -41%) — a 196-point gap within a single sector. Gold above $5,000/oz and consumer confidence at a 12-year low confirm the uncertainty persists, but credit spreads at 2.94% confirm the fundamentals are intact. Research platforms that provide fair value estimates, moat analysis, and fundamental screening help you navigate the intra-sector dispersion that defines this market. Stock Advisor’s 42 ten-baggers and 23-year track record demonstrate what disciplined, research-backed stock selection achieves when the rotation deepens beneath a calm surface. The right platform won’t guarantee success — but when 83-point dispersion rewards company-level selection and sector-level analysis fails, it helps you find the SNDK instead of the INTU.
Looking for stock-picking services instead of research tools? Explore our guide to the best stock advisors for services that provide recommendations.