

You’re not looking for another list of “best stock pickers.” You’ve seen those. They rank the same services by the same scorecards and tell you to pick the highest number.
That ranking misses the job a newsletter actually does. A subscription is a decision backbone — cadence, hold period, and sell discipline — not a trophy case. Comparing them by “who beat the market” is like comparing a written training plan to a gym membership by asking which one has the bigger biceps.
The right question isn’t “which service has the best returns?” It’s “which cadence, hold period, and sell rule matches how I actually make decisions?”
Our backbone pick: Motley Fool Stock Advisor — two picks a month, then you hold. Official scorecard +981% vs S&P +216% across 286 active / 523 total positions, 66% win rate, 49 ten-baggers. Last independent audit (February 18): +888.4%. The system is the hold. Try Stock Advisor risk-free for 30 days.
The VIX is ~14. Individual names are still moving 50% to 500%. That gap is the entire newsletter problem. The index looks calm. The S&P 500 is up +14.54% around ~7,600. Credit is quiet (HY OAS 2.71%). Then you open the constituents: SanDisk +591%, Dell +290%, Micron +240% — and The Trade Desk −63%, AppLovin −53%, Intuit −48%. Same market. Opposite years. The average top-20 S&P name is +170.4%. The average bottom-20 is −40.5%. That’s 211 points of spread under a sleepy volatility print.
This is the Hardware Boom, Software Wipeout tape. Memory, storage, and servers printed multi-bagger year-to-date returns. Enterprise software and ad-tech ate 25–60% drawdowns. Energy is still a sector leader (~+38%). Headline CPI is 3.4%. The 10-year is 4.68%. The 2-year is 4.17% — above the 3.50–3.75% fed-funds range, not below it. A divided Fed just held 9–3 with hike dissenters. CAPE sits near 41–42. AAII bears (37.9%) still outnumber bulls (34.7%) after a 15% rally.
When the fear gauge says “fine” and the names say “civil war,” improvising is how you sell the winner and keep the wreckage. A newsletter earns its fee by replacing that improvisation with three rules you can actually follow:
- Cadence — how often a new idea shows up (2/month vs on-demand research vs real-time squawk)
- Hold period — the window the math was built for (5+ years vs 1–3 years vs today)
- Sell discipline — what takes you out, or whether the system refuses to take you out
Stock Advisor is 2 picks + hold. Alpha Picks is 2 picks + sells. Everything else on this page is a tool that leaves those three decisions with you. Start with Stock Advisor’s 24.5-year hold system.
Match the backbone to the horizon:
- 1-3 year horizons: Alpha Picks — two quant picks a month plus documented exits. +378.5% vs S&P +105.6%, 103 positions, 70% win rate. Live caveat: APP, a prior poster child, is −53% YTD.
- 5+ year horizons: Stock Advisor — two picks a month and you sit. 66% win rate, 49 ten-baggers, 286 names still working.
Here’s the landscape: Investment subscriptions fall into four categories — stock-picking newsletters that tell you what to buy, research platforms that help you decide for yourself, expert-tracking tools that verify who’s worth listening to, and market intelligence services that sell speed. Each is a different backbone. This guide helps you find which one you will actually use.
The Quick Answer: Cadence, Hold, and Sell Discipline
This is not another “best advisor by scorecard” table. Rank here means which backbone fits which investor — how often you get an idea, how long you’re supposed to sit, and what (if anything) sells.
| Rank | Service | Cadence | Hold / Sell Discipline | Price | Backbone For |
|---|---|---|---|---|---|
| 🥇 | Stock Advisor | 2 picks/month | Hold. The sell is almost never. | $99/yr | Investors who can sit 5+ years |
| 🥈 | Alpha Picks | 2 picks/month | Sells: rating drop, 12-month max, 15% cap | $449/yr | Investors who want a written exit |
| 🥉 | Morningstar Investor | On-demand tools | You decide. Fair value is the sell cue. | $249/yr | DIY analysts at CAPE ~41–42 |
| 4 | Seeking Alpha Premium | Daily research | You decide. Quant grades help, they don’t sell. | $269/yr | Research synthesizers |
| 5 | TipRanks | On-demand tracking | You decide. Verify the expert first. | $99/yr | Skeptics who audit advice |
| 6 | Zacks Premium | Daily rank updates | Rank 4–5 is the sell cue | $249/yr | Earnings-revision traders |
| 7 | Benzinga Pro | Real-time | Minutes, not years. Speed is the sell. | $184/yr+ | Day traders who need the tape |
Find Your Category:
- “Just tell me what to buy — and whether to hold or sell” → Stock-Picking Newsletters (Stock Advisor, Alpha Picks)
- “Give me tools to decide myself” → Research Platforms (Morningstar, SA Premium, Zacks)
- “Help me verify who’s credible” → Expert Tracking (TipRanks)
- “I need information faster than everyone else” → Market Intelligence (Benzinga Pro)
Understanding Investment Subscription Categories
Before the individual write-ups, understand what you’re choosing between. The category is the backbone.
Category 1: Stock-Picking Newsletters
What they are: Services that provide specific buy recommendations—“buy this stock now”—with varying levels of supporting research.
What you pay for: The picks themselves, plus (in better services) a hold-or-sell rule you can actually follow when VIX is 14 and a name is down 40%.
Examples: Stock Advisor, Alpha Picks
Best for: Investors who want actionable recommendations and are willing to follow a system.
The trade-off: You’re outsourcing conviction and the exit. If you override the hold (Stock Advisor) or the sell (Alpha Picks), you didn’t buy a newsletter. You bought a suggestion box.
Category 2: Research Platforms
What they are: Tools and data that help you evaluate investments and make your own decisions. They don’t tell you what to buy—they help you figure it out.
What you pay for: Valuation models, ratings, screening tools, analyst reports, and data access.
Examples: Morningstar Investor, Seeking Alpha Premium, Zacks Premium
Best for: Self-directed investors who enjoy the research process and want to build independent capability.
The trade-off: You do the work. Cadence, hold, and sell are all on you. At CAPE ~41–42 that can be a feature — if you will actually use the tools when software is down 40% and hardware is up 200%.
Category 3: Expert Tracking Tools
What they are: Services that track and rank the performance of financial experts—analysts, bloggers, hedge funds—so you know who’s actually accurate.
What you pay for: Accountability data. Who’s right? Who’s wrong? Who should you listen to?
Examples: TipRanks
Best for: Skeptical investors who want to verify credibility before following anyone’s advice.
The trade-off: Still requires you to synthesize information and make decisions. No cadence. No hold. No sell. A filter, not a spine.
Category 4: Market Intelligence Services
What they are: Real-time news and data platforms designed for active traders who need information before it’s priced in.
What you pay for: Speed. Breaking news, unusual activity alerts, and market-moving information faster than mainstream sources.
Examples: Benzinga Pro
Best for: Day traders and swing traders who trade on news and momentum.
The trade-off: Speed-focused services are useless for long-term investors. You’re paying for an edge that only matters if you act on it immediately. That is the opposite of a 5-year hold backbone.
1. Motley Fool Stock Advisor — Two Picks, Then You Hold

Patient growth investors who hold through volatility for 5+ years
Most stock-picking newsletters give you tips. Stock Advisor gives you a hold rule dressed up as a membership.
That distinction is the whole product. Cadence is two new names a month. The hold period is five-plus years — ten if you want the math that actually built the scorecard. The sell discipline is almost a non-event: you sit through the 40% drawdowns that come with growth investing. After 24.5 years and 523 recommendations, that is the system.
Motley Fool Stock Advisor Performance
The Motley Fool · 523 picks · 25 years · Updated Aug 14, 2026
| SA Return | S&P 500 | Alpha | Win Rate |
|---|---|---|---|
| +981% | +216% | +764% | 66% |
S&P 500 shows what you'd have earned buying the index on each pick date instead. Same timing, fair comparison.
| SA Multi-Baggers | 10x+ | 5x+ | 3x+ | 2x+ |
|---|---|---|---|---|
| Count | 49 | 90 | 127 | 193 |
| SA Asymmetry | Avg Winner | Avg Loser | Ratio |
|---|---|---|---|
| Return | +1.7K% | -45% | ~38:1 |
Best Performers (All-Time)
| SA Pick | Return |
|---|---|
 NFLX Netflix | +42K% |
 SHOP Shopify | +4.7K% |
 AMZN Amazon | +34K% |
 CTAS CTAS | +4.5K% |
 TSLA Tesla | +16K% |
 DIS Disney | +6.0K% |
 AAPL Apple | +6.2K% |
 BKNG Booking Holdings | +23K% |
 NVDA NVIDIA | +138K% |
 MME.DL MME.DL | +4.3K% |
38:1 asymmetry. Winners average +1.7K%, losers average -45%. One winner offsets 38 complete losses—this is why selling winners early is costly.
See All Stock Advisor Recommendations →Latest Stock Advisor Picks
Tickers masked to protect subscriber value. Recent picks need 3-5+ years to demonstrate thesis.
| SA Pick | Return |
|---|---|
**** Chip Manufacturer | +112% |
**** Cloud Monitoring | +112% |
**** Infrastructure Construction | +100% |
**** Growth Company | +77% |
**** Growth Company | +50% |
**** Growth Company | +41% |
**** Convenience Stores | +33% |
**** Growth Company | +29% |
**** E-commerce & Cloud Giant | +26% |
**** Growth Company | +20% |
$10K → $108K. Following every recommendation since inception would yield a 10.8x return. Recent picks look small now, but compounding hasn't had time to work.
Stock Advisor Win Rate by Holding Period
| Hold Time | SA Win Rate | Avg Return |
|---|---|---|
| < 1 Year | 61.1% | +22% |
| 1-3 Years | 55.7% | +18% |
| 3-5 Years | 47.7% | +20% |
| 5-10 Years | 63.6% | +208% |
| 10+ Years | 92.9% | +4.1K% |
Time is the strategy. 10+ year picks show 92.9% win rate with +4.1K% average returns. Same methodology, same picks—time transforms the results.
Stock Advisor Performance by Year
| Year | SA Picks | Avg Return | Win Rate | |
|---|---|---|---|---|
| 2026 | 30 | +21% | 64% | INTC+112% |
| 2025 | 26 | +14% | 52% | ASML+154% |
| 2024 | 24 | +30% | 65% | AMD+216% |
| 2023 | 26 | +89% | 70% | CRWD+602% |
| 2022 | 23 | +58% | 59% | NET+527% |
| 2021 | 22 | -12% | 27% | LRCX+551% |
| 2020 | 23 | +133% | 43% | TSLA+1.1K% |
| 2019 | 23 | +54% | 70% | SNPS+242% |
| 2018 | 19 | +223% | 68% | SHOP+1.1K% |
| 2017 | 22 | +711% | 86% | NVDA+8.7K% |
| 2016 | 20 | +446% | 85% | SHOP+4.7K% |
| 2015 | 22 | +215% | 68% | CASY+952% |
| 2014 | 20 | +353% | 80% | ATVI+2.8K% |
| 2013 | 17 | +370% | 65% | NFLX+2.4K% |
| 2012 | 23 | +1.2K% | 74% | TSLA+16K% |
| 2011 | 19 | +585% | 63% | AAPL+3.1K% |
| 2010 | 18 | +459% | 83% | AMZN+2.9K% |
| 2009 | 20 | +3.3K% | 90% | NVDA+58K% |
| 2008 | 18 | +1.2K% | 94% | AAPL+6.2K% |
| 2007 | 19 | +1.5K% | 37% | NFLX+28K% |
| 2006 | 20 | +2.4K% | 65% | NFLX+24K% |
| 2005 | 16 | +8.7K% | 63% | NVDA+138K% |
| 2004 | 17 | +5.8K% | 59% | NFLX+42K% |
| 2003 | 17 | +239% | 65% | PHIN+1.5K% |
| 2002 | 16 | +3.1K% | 81% | AMZN+34K% |
Inside Stock Advisor
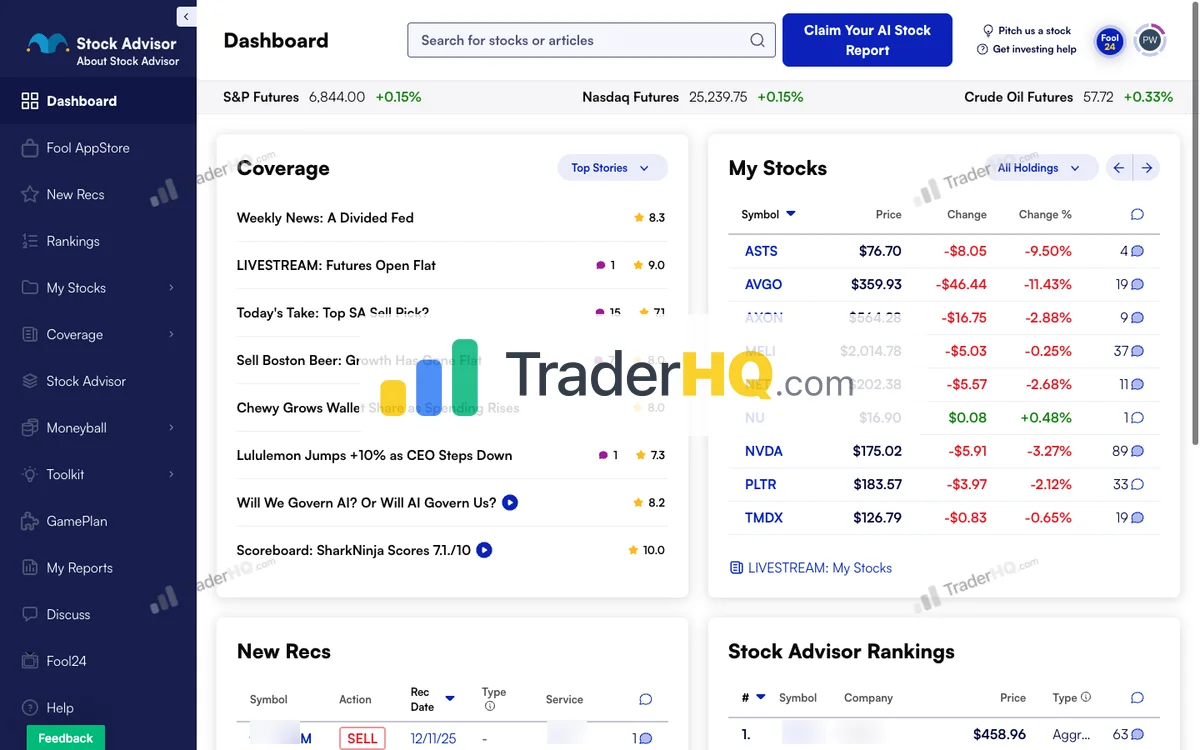
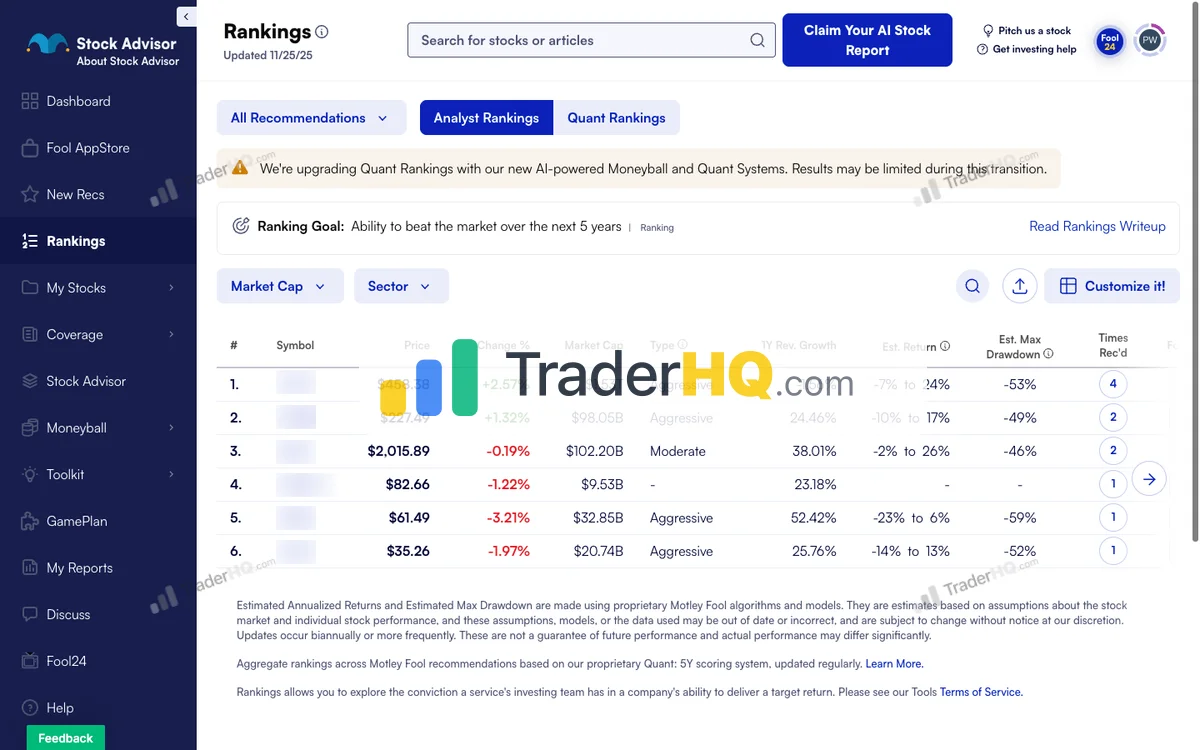
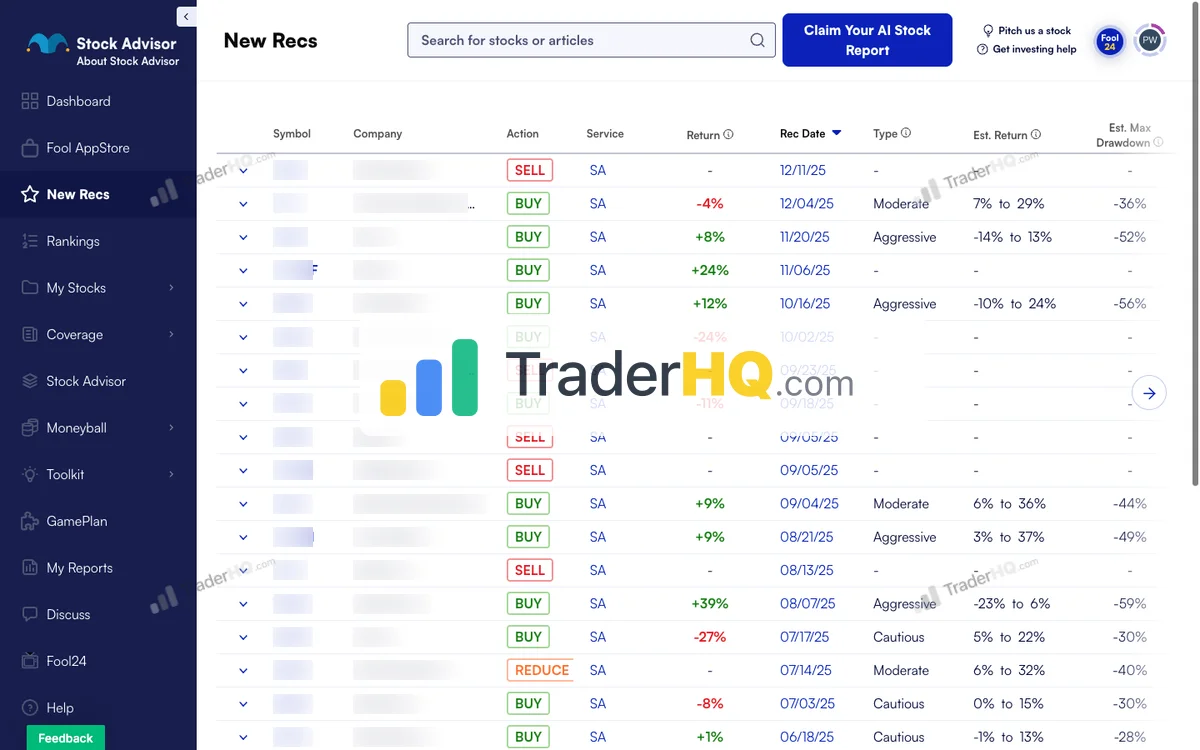
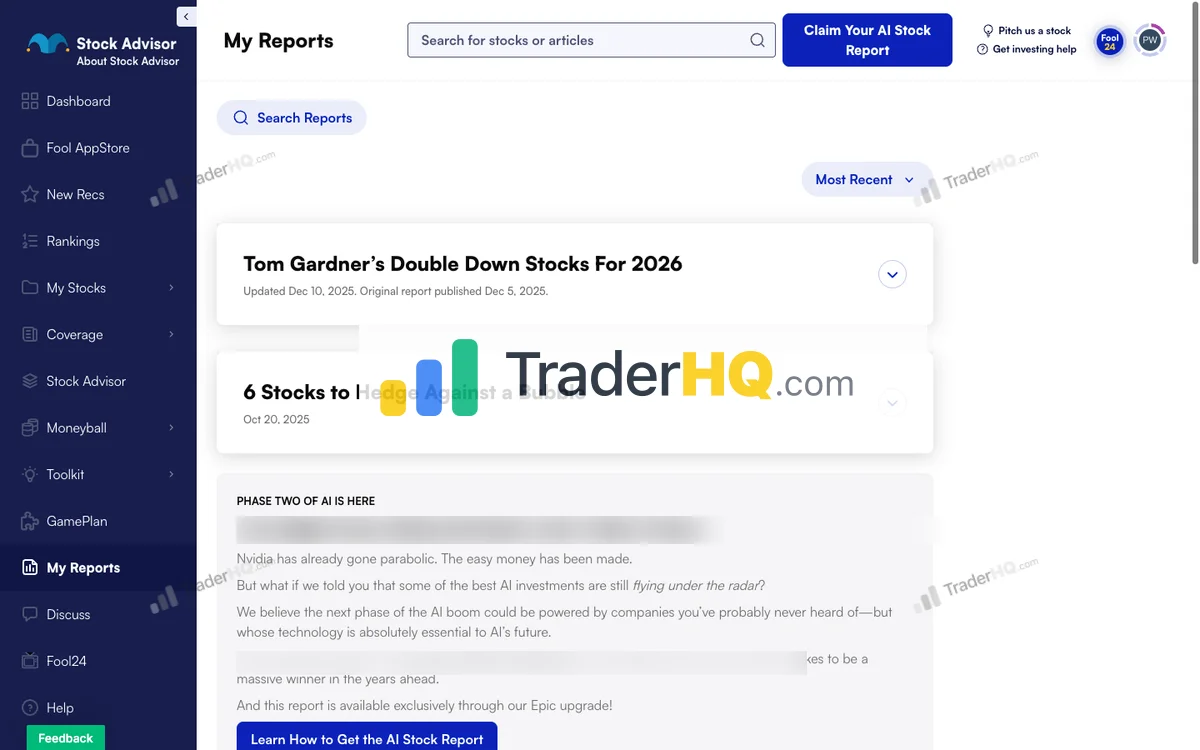
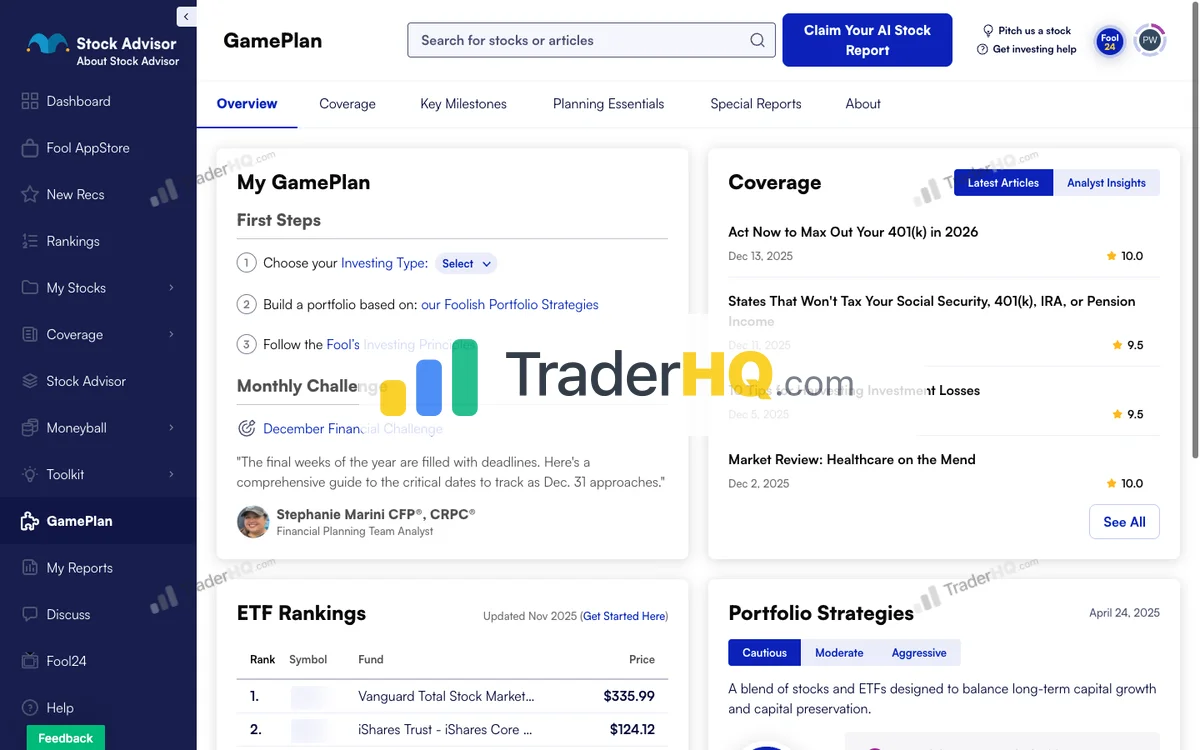
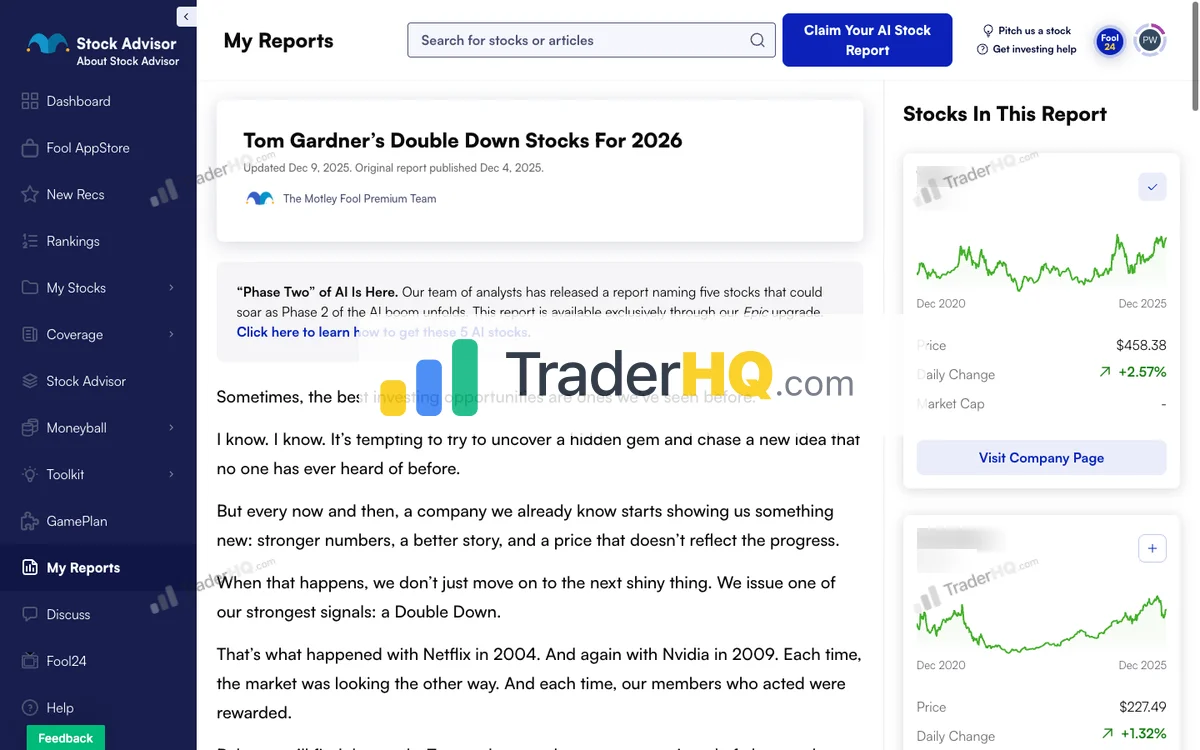
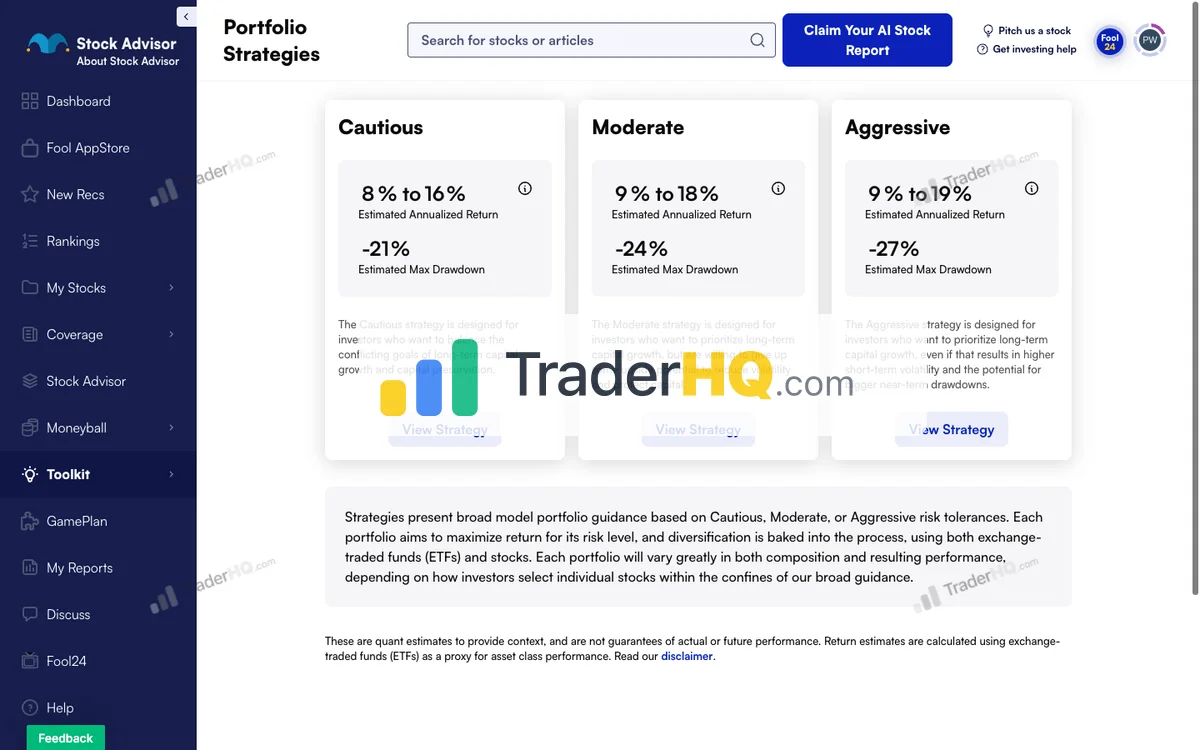
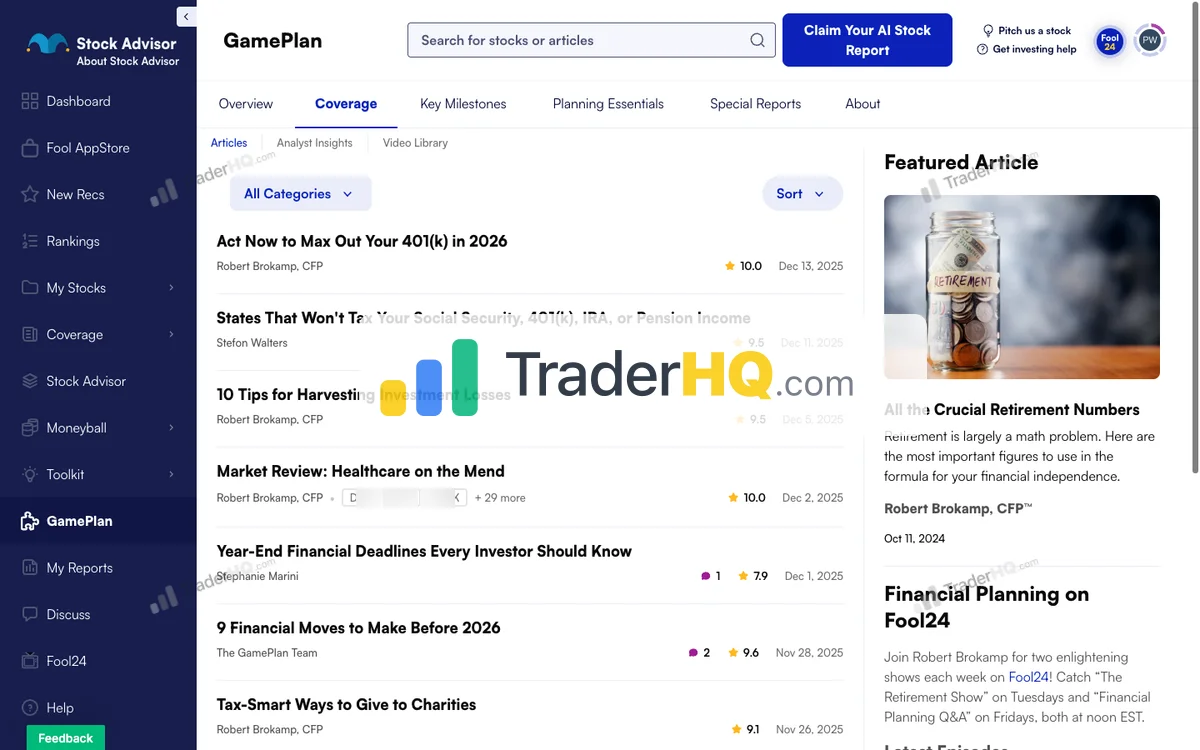
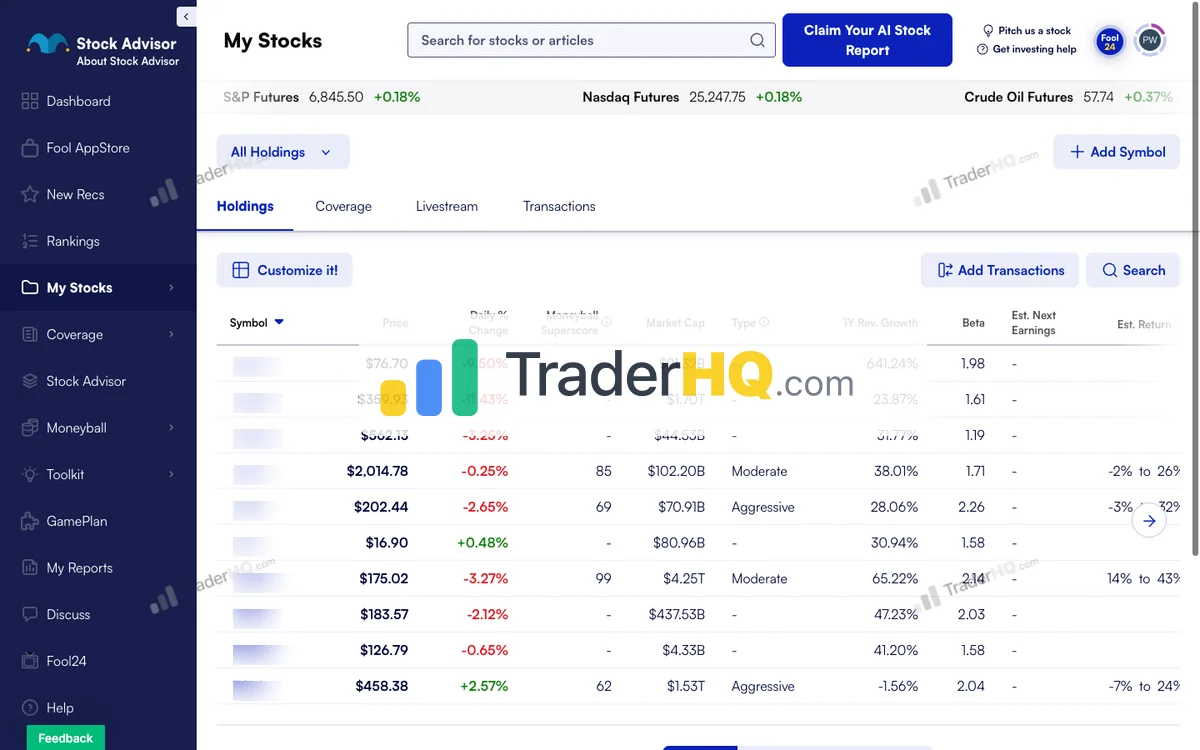
9 screenshots · Click to expand
What You’re Actually Paying For
The headline is 2 new stock picks per month. The backbone is everything around those picks:
Portfolio Strategies: Three frameworks—Cautious, Moderate, and Aggressive—calibrated to different risk tolerances. This addresses the psychological reality that even the best picks are worthless if you panic-sell during crashes.
Foundational Stocks: 10 highest-conviction core holdings with explicit risk classifications. New subscribers often ask “where do I start?” This is the answer.
Moneyball Database: 344 companies with 12+ scoring dimensions. It’s essentially a research platform that builds investor capability rather than dependency.
Re-Recommendation Signals: When existing picks become even more attractive, you get notified. This helps with position sizing and conviction-building — add, don’t rotate.
The Track Record Reality
Official +981% cumulative return since 2002 versus the S&P 500’s +216%. Live book: 286 active of 523 total, 66% win rate, 49 ten-baggers. Last independent audit (February 18): +888.4%.
Let me make that visceral: $10,000 following the official book would be worth about $108,000. The same money in an S&P 500 index fund? About $31,600.
The time curve is the sell discipline in table form:
- 66% overall win rate — and it only becomes a wealth machine with time
- 92.9% win rate for 10+ year holds — 49 ten-baggers, 173 doublers in the long-hold cohort
- Best for investors with 5+ year horizons who can treat “don’t sell” as a rule, not a vibe
But here’s what the marketing won’t tell you:
- About a third of picks lose money. Roughly 34% of recommendations end up in the red.
- Returns concentrate in winners. The top 10% of picks generate the majority of returns. Selling winners early destroys the math. That is why this service is 2 picks + hold, not 2 picks + trim.
- Vintage matters. Subscribers who joined in 2020-2021 bought at peak growth valuations. Many of those picks are still recovering. A hold backbone is ugliest in the years you most want an exit.
This isn’t criticism—it’s the reality of growth investing. The question is whether you can hold through the pain. If you can’t, this is the wrong cadence.
The Time Curve
| Holding Period | Win Rate | Average Return |
|---|---|---|
| Under 1 year | 61.1% | +21.6% |
| 5-10 years | 63.6% | +207.6% |
| 10+ years | 92.9% | Multi-bagger potential |
49 ten-baggers, 173 long-hold doublers over 24.5 years. Time horizon isn’t a suggestion—it’s the entire sell rule.
Pricing
- Regular Price: $199/year
- New Member Price: $99/year (50% off)
- Refund Policy: 30-day money-back guarantee
At $99/year, you’re paying roughly $4 per stock pick for a 24.5-year hold system (+981% official vs S&P +216%).
Who This Is For
Investors who want a complete framework, not just tips. If you’ll follow the portfolio strategies, hold through drawdowns, and think in 5+ year horizons, Stock Advisor works. If you’ll cherry-pick stocks and panic-sell the first time a software name is down 40% while VIX prints 14, save your money.
Who Should Skip This
Short-term traders. Income investors. Anyone who can’t stomach 30-50% drawdowns on individual positions. Anyone who wants a documented sell. And anyone who gets frustrated by upsell pressure—Motley Fool will try to upgrade you to Epic, Epic Plus, and beyond. Relentlessly.
Start with Motley Fool Stock Advisor — 30-Day Money-Back Guarantee
2. Alpha Picks by Seeking Alpha — Two Picks, Then It Sells

Data-driven investors who trust algorithms over human opinion
If Stock Advisor represents human judgment refined over decades, Alpha Picks represents something fundamentally different: a quantitative model with zero human discretion and a written exit.
No analyst committee. No narrative-driven investing. No “we believe in this company’s mission.” Two names a month. Then the model sells.
Alpha Picks by Seeking Alpha Performance
Seeking Alpha · 103 picks · 4 years · Updated 2026-08-15
| AP Return | S&P 500 | Alpha | Win Rate |
|---|---|---|---|
| +379% | +106% | +273% | 70% |
S&P 500 shows what you'd have earned buying the index on each pick date instead. Same timing, fair comparison.
| AP Multi-Baggers | 10x+ | 5x+ | 3x+ | 2x+ |
|---|---|---|---|---|
| Count | 2 | 4 | 12 | 19 |
| AP Asymmetry | Avg Winner | Avg Loser | Ratio |
|---|---|---|---|
| Return | +129% | -21% | ~6:1 |
Best Performers (All-Time)
| AP Pick | Return |
|---|---|
 APP AppLovin | +1.6K% |
**** Thermal Management | +348% |
 POWL Powell Industries | +1.1K% |
 SMCI Super Micro Computer | +969% |
**** Power Plant Construction | +387% |
**** Connectivity Chips | +277% |
**** Memory Chips | +409% |
**** Casual Dining | +363% |
 STRL Sterling Construction | +823% |
 CLS Celestica | +1.2K% |
Latest Alpha Picks Picks
Tickers masked to protect subscriber value. Recent picks need 3-5+ years to demonstrate thesis.
| AP Pick | Return |
|---|---|
**** Memory Chips | +409% |
**** Circuit Board Manufacturing | +137% |
**** Growth Company | +75% |
**** Growth Company | +75% |
**** Connectivity Chips | +44% |
**** Growth Company | +43% |
**** Gold Mining | +28% |
**** Growth Company | +23% |
**** Growth Company | +14% |
**** Growth Company | +10% |
Alpha Picks Win Rate by Holding Period
| Hold Time | AP Win Rate | Avg Return |
|---|---|---|
| < 1 Year | 56.1% | +14% |
| 1-3 Years | 77.6% | +102% |
| 3-5 Years | 100% | +529% |
| 5-10 Years | N/A% | N/A |
| 10+ Years | N/A% | N/A |
Alpha Picks Performance by Year
| Year | AP Picks | Avg Return | Win Rate | |
|---|---|---|---|---|
| 2026 | 15 | +3% | 60% | CRDO+44% |
| 2025 | 24 | +63% | 75% | MU+409% |
| 2024 | 24 | +75% | 67% | AGX+387% |
| 2023 | 24 | +177% | 71% | CLS+1.1K% |
| 2022 | 16 | +65% | 75% | MOD+348% |
Inside Alpha Picks
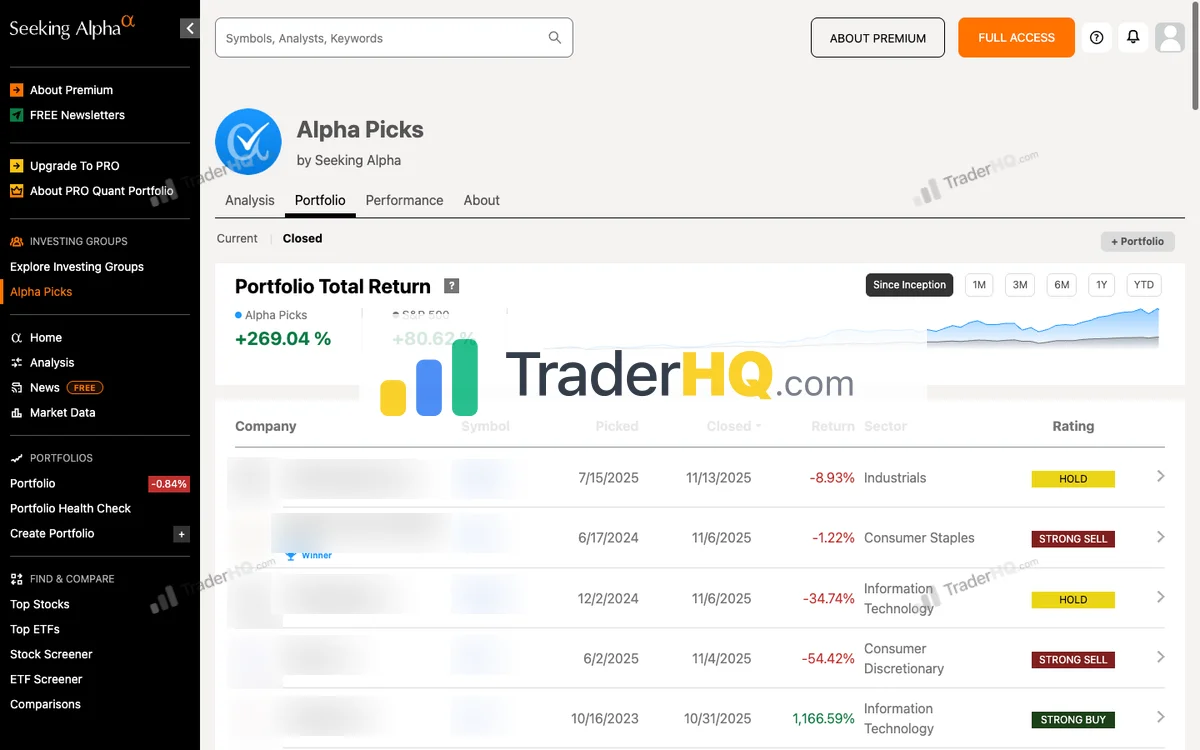

6 screenshots · Click to expand
What You’re Actually Paying For
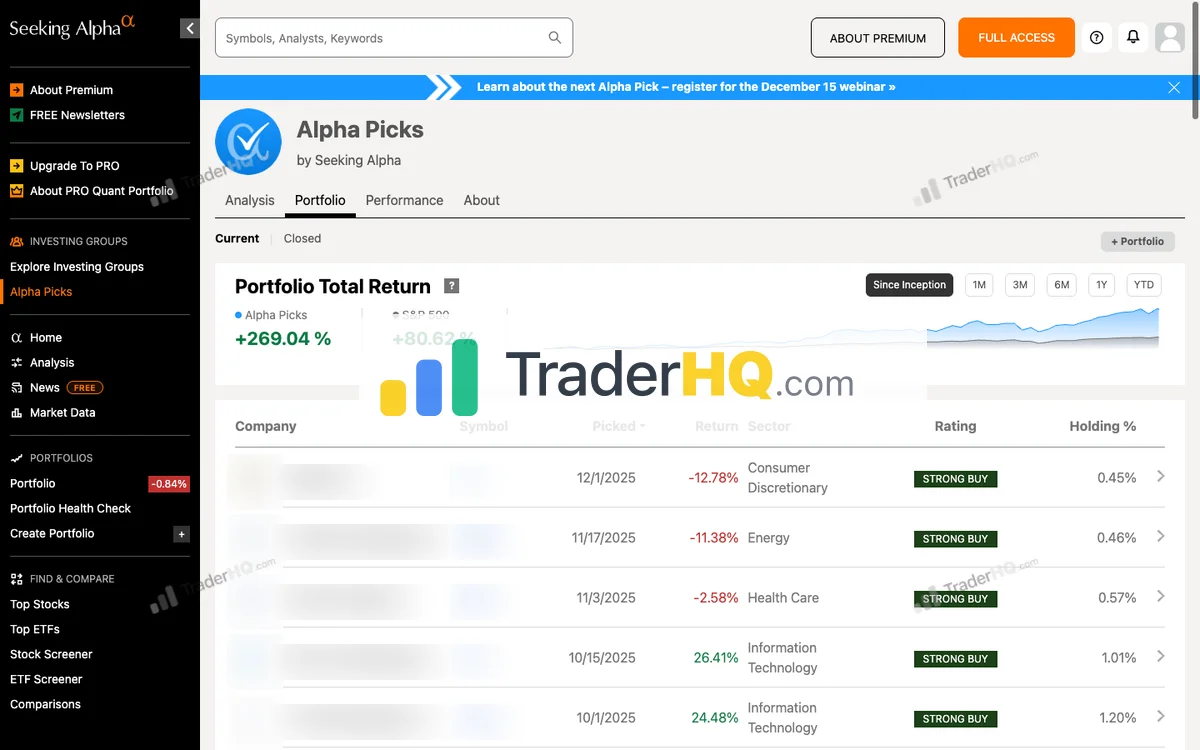
Two stock picks per month, selected entirely by algorithm. The Seeking Alpha Quant system scores every US equity on five factors:
- Value
- Growth
- Profitability
- Momentum
- EPS Revisions
The two highest-scoring stocks become that month’s picks. Exit triggers are equally systematic: quant rating drops below “Hold,” 12-month maximum holding period, or position hits 15% of portfolio.
No human override. Pure system. That is the opposite backbone from Stock Advisor — same cadence, opposite sell.
The live tape is why that sell rule matters. AppLovin, a prior Alpha Picks poster child, is −53% YTD. A hold service asks you to re-underwrite the thesis. A sell service already wrote the exit. Whether you like the result is a different question from whether you wanted a documented one.
The Track Record Reality
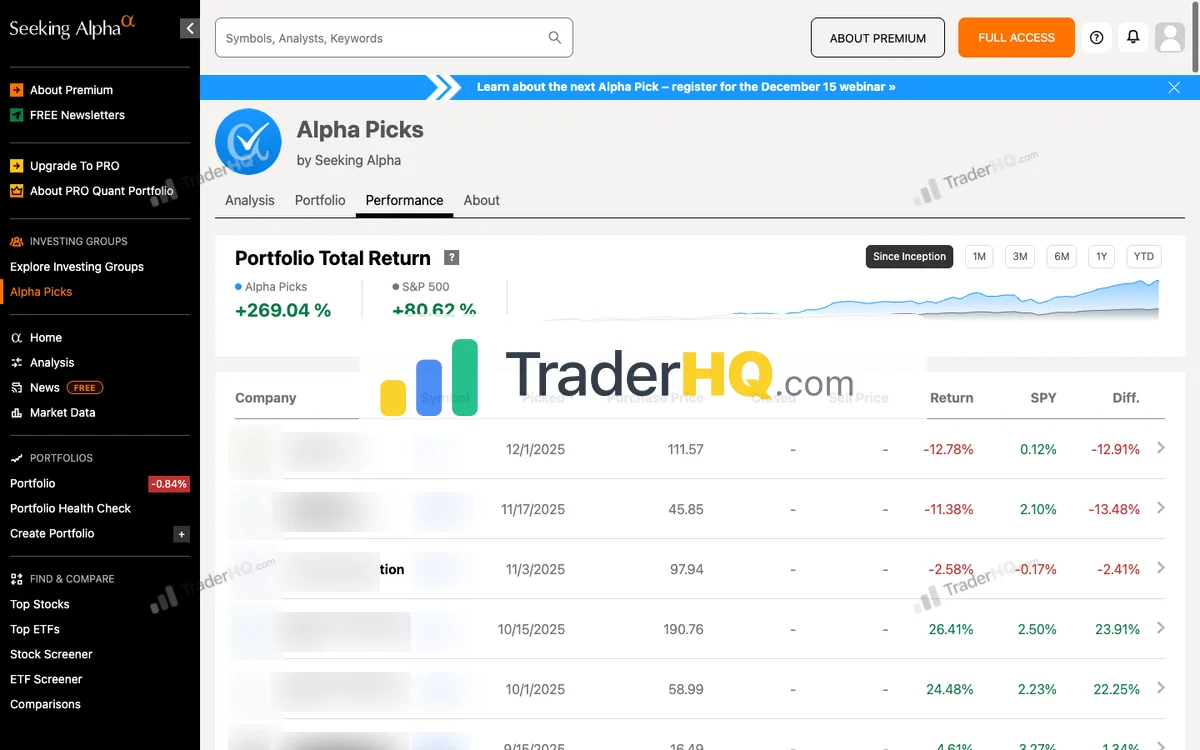
+378.5% return since July 2022 versus +105.6% for the S&P 500. 103 positions. 70% win rate. Not 73%. Not a mystery book.
| Metric | Alpha Picks | S&P 500 |
|---|---|---|
| Total Return | +378.5% | +105.6% |
| Win Rate | 70% | — |
| 1-3 Year Win Rate | 77.6% | — |
| Positions | 103 | — |
The shorter track record (4.1 years vs Stock Advisor’s 24.5) is a legitimate caveat. The service has not been through a full recession cycle. But every position is documented with entry dates, exit dates, and returns visible. Best for 1-3 year horizons where the 77.6% win rate lives — and where the sell rules are designed to operate.
The Time Curve
| Holding Period | Win Rate | Average Return |
|---|---|---|
| Under 1 year | 56.1% | +14% |
| 1-3 years | 77.6% | +102.4% |
Selling in year one still costs you the meat of the average. This is why we recommend Alpha Picks for 1-3 year horizons — long enough for the factors to work, short enough that the 12-month / rating-drop exits don’t fight a decade-long compounder thesis.
Pricing
- Regular Price: $499/year
- New Member Price: $449/year (10% off)
- Refund Policy: None (annual billing only)
At $449/year with no refund policy, Alpha Picks requires more commitment than Stock Advisor. The +378.5% vs +105.6% book and 70% win rate are the case for data-driven investors who want sells in writing. Caveat: Only 4.1 years of data—Stock Advisor’s 24.5-year track record provides more confidence for longer horizons.
Who This Is For
Investors who trust algorithms over human opinion and want the exit pre-committed. If you’ve ever sold a winner too early or held a loser too long because of emotion, a systematic sell protects you from yourself — including when the sell is APP after a monster run.
Who Should Skip This
Investors who want to understand why they own something, and investors who want to hold a 10-bagger through a factor washout. The quant model is a black box—you know the factors, but not the specific weightings. If you need narrative conviction to sit for a decade, this isn’t your service.
3. Morningstar Investor — The Research Platform Standard

Morningstar Investor is fundamentally different from the services above. It’s not a stock-picking newsletter—it’s a research platform that gives you the tools to make your own decisions.
If you want someone to tell you what to buy, skip to the next entry. If you want to become a better investor, keep reading. At CAPE ~41–42, with software names down 25–50% and hardware names up several hundred percent, a fair-value backbone is how you stop confusing a cheap multiple with a cheap business — and an expensive winner with a bubble.
What You’re Actually Paying For
Fair Value Estimates: Morningstar’s proprietary valuation methodology estimates what each stock is actually worth. When market price is below Fair Value, you’re potentially buying at a discount. When it’s above, you might be overpaying.
Economic Moat Ratings: Morningstar pioneered the concept of “economic moats”—competitive advantages that protect companies from competition. Wide moat companies can maintain pricing power and profitability for decades. Narrow moat companies have advantages that may erode. No moat companies are vulnerable to competition.
Portfolio X-Ray: Upload your holdings and see your true allocation, performance, fees, and overlaps. This alone is worth the subscription for serious investors managing multiple accounts.
200+ Data Points for Screening: Build custom screens based on valuation, growth, profitability, momentum, and hundreds of other factors.
The Track Record Question
Morningstar Investor doesn’t have a “track record” because it doesn’t make stock picks. It’s a tool, not an advisor. Cadence, hold, and sell are yours.
That said, Morningstar’s ratings methodology has been trusted for 40+ years and is recession-tested across multiple market cycles. Their quality/moat focus and fair value methodology is the industry standard for fundamental analysis. Best for DIY researchers and value investors who want to build capability, not dependency.
Pricing
- Regular Price: $249/year
- Promo: $199/year when offered
- Refund Policy: 7-day free trial
Who This Is For
Self-directed investors who want professional-grade research tools. DIY analysts who enjoy the research process. Investors who want to understand why they’re buying, not just what. Especially useful when the index is expensive and the names inside it are not one trade.
Who Should Skip This
Investors who want someone to tell them what to buy. Beginners who need guidance. Anyone seeking actionable stock picks—Morningstar won’t provide them.
4. Seeking Alpha Premium — The Crowd-Sourced Research Hub
Seeking Alpha Premium takes a different approach to research: instead of a small team of analysts, it aggregates insights from 18,000+ contributing analysts covering stocks that Wall Street ignores.
The result is the largest investor-focused content platform on the internet—5,000+ articles published monthly, covering everything from mega-caps to micro-caps.
What You’re Actually Paying For
Crowd-Sourced Analysis: 18,000+ contributors means perspectives you won’t find anywhere else. While Wall Street analysts cover the same 500 large-caps, Seeking Alpha contributors dig into small-caps, special situations, and contrarian theses.
Quant Ratings: Proprietary ratings for 10,000+ US stocks with factor grades for Value, Growth, Profitability, Momentum, and EPS Revisions. Similar methodology to what powers Alpha Picks, but applied across the entire market — grades, not a two-pick cadence.
Unlimited Earnings Transcripts: Every earnings call, fully searchable. Essential for fundamental research.
Broker Linking: Connect your brokerage accounts for automatic daily portfolio updates. See your holdings alongside Seeking Alpha’s ratings and contributor coverage.
The Quality Question
The strength of crowd-sourced content is also its weakness: quality varies dramatically by contributor. Some writers produce institutional-quality research. Others are amateurs with axes to grind.
Seeking Alpha addresses this with author ratings, track records, and the Quant system. But you still need to evaluate sources—you can’t blindly trust every article. There is no hold rule. There is no sell. You are the backbone.
Pricing
- Regular Price: $299/year
- New Member Price: $269/year (10% off)
- Refund Policy: 7-day free trial, then annual billing
Who This Is For
Research junkies who want diverse perspectives. Investors who enjoy synthesizing multiple viewpoints. Anyone who wants to discover stocks before they become consensus picks.
Who Should Skip This
Investors seeking specific stock picks. Those who want curated, quality-controlled recommendations. Anyone who doesn’t have time to evaluate contributor credibility.
5. TipRanks — The Expert Accountability Platform

Here’s a question most investors never ask: How do I know if this analyst is actually good?
Wall Street analysts make thousands of recommendations. Bloggers publish endless “buy this stock” articles. Hedge fund managers appear on CNBC with bold predictions. But who tracks whether they’re right?
TipRanks does.
What You’re Actually Paying For
Expert Performance Tracking: TipRanks monitors 96,000+ financial experts—analysts, bloggers, hedge funds, and corporate insiders—and ranks them by historical accuracy. Before you follow anyone’s advice, you can see their track record.
Smart Score: An AI-powered 1-10 rating that combines 8 key market factors to rate stocks. It’s not a recommendation—it’s a synthesis of multiple signals into a single score.
Institutional Credibility: TipRanks data is integrated into Nasdaq, TD Ameritrade, E*TRADE, and Interactive Brokers. The same data that powers your broker’s research tools is available directly.
The Accountability Insight
This is the hidden value of TipRanks: it changes how you consume financial content.
When you read an analyst recommendation, you can check their success rate. When a blogger makes a bold call, you can see their historical accuracy. When a hedge fund discloses a position, you can evaluate whether their past picks worked.
It’s not about finding “the best analyst.” It’s about knowing who to trust—and who to ignore. On a 211-point tape, that filter is useful. It is still not a hold-or-sell backbone.
Pricing
- Regular Price: $299/year
- New Member Price: $99/year (67% off, limited time)
- Refund Policy: 30-day money-back guarantee
At $99/year with the current promotion, TipRanks is the most affordable way to add accountability to your research process.
Who This Is For
Skeptical investors who want to verify credibility before following anyone. Data-driven decision makers who appreciate quantified track records. Anyone who consumes financial content and wants to know who’s actually accurate.
Who Should Skip This
Passive index investors who don’t follow individual stocks. Investors seeking specific stock picks—TipRanks helps you evaluate others’ picks, not make your own.
6. Zacks Premium — The Earnings Revisions Specialist

Zacks Premium is built on a single academic insight: earnings estimate revisions predict stock performance.
Founded in 1978 by Len Zacks (MIT PhD), the company pioneered research on the predictive power of earnings revisions. The Zacks Rank system has been in continuous use since 1988—37+ years of real-world application.
What You’re Actually Paying For
The Zacks Rank: A proprietary 1-5 rating based on earnings estimate revisions, updated daily:
- 1 = Strong Buy — Analysts raising estimates aggressively
- 2 = Buy — Estimates trending higher
- 3 = Hold — Mixed signals
- 4 = Sell — Estimates declining
- 5 = Strong Sell — Analysts cutting estimates aggressively
The logic is simple: when analysts raise earnings estimates, it signals positive information about a company’s prospects. Stocks with rising estimates tend to outperform; stocks with falling estimates tend to underperform. Rank 4–5 is the sell cue — a different backbone from “hold for a decade.”
Research Tools: Earnings calendars, estimate data, screening tools, and analyst reports. The platform is huge—almost overwhelmingly so.
The Academic Foundation
The relationship between earnings revisions and stock performance is well-documented in financial research. Zacks didn’t invent the insight—they commercialized it into a usable system.
That said, specific performance claims aren’t prominently displayed. The methodology is sound, but you’re trusting the system rather than verifying a track record.
Pricing
- Price: $249/year
- Refund Policy: 30-day money-back guarantee
Who This Is For
Earnings-focused investors who follow estimate revisions religiously. Quantitative investors who want data-driven signals. Those comfortable with information overload—Zacks gives you a lot. A trending hardware cycle is the environment this rank system was built for.
Who Should Skip This
Investors who want simple stock picks. Those overwhelmed by data-heavy interfaces. People who dislike aggressive marketing—Zacks will upsell you to Ultimate, Black Box, and beyond.
7. Benzinga Pro — The Speed Advantage

Benzinga Pro serves a completely different investor: the active trader who needs information before it’s priced in.
If you’re a long-term investor, skip this section. Benzinga Pro’s value proposition—speed—is irrelevant if you’re not trading on news. A VIX of ~14 does not make a squawk feed into a 5-year hold.
What You’re Actually Paying For
Real-Time News Feed: Benzinga claims to deliver exclusive news “up to 30 minutes” before other sources. For active traders, that window is the entire edge.
Audio Squawk: A unique audio stream of breaking headlines for hands-free monitoring. You can listen while watching charts, executing trades, or doing other work.
Signals and Scanners: Real-time alerts for price spikes, block trades, unusual options activity, and other market-moving events.
Calendars: Earnings, economic events, FDA decisions, and other scheduled catalysts.
The Speed Question
Benzinga’s claim of 30-minute news advantage is difficult to verify independently. What’s clear is that they’re positioned as a news-first platform for active traders, not a research service for long-term investors.
The platform is used by major brokerages and claims to be the “largest news vendor to North American brokerages.” That institutional adoption suggests the speed claims have merit.
Pricing
- Basic: $184/year (promo) / $367/year (regular)
- Essential: $997/year (promo) / $1,997/year (regular)
- Refund Policy: 7-day account credit (not cash refund)
The wide pricing range reflects different feature tiers. Basic includes news and calendars. Essential adds options flow, signals, and advanced features.
Who This Is For
Day traders and swing traders who need breaking news before price moves. Active investors who trade on momentum and catalysts. Anyone whose strategy depends on information speed.
Who Should Skip This
Long-term investors. Buy-and-hold investors. Anyone who doesn’t trade frequently enough to benefit from real-time news. The speed advantage is worthless if you’re not acting on it.
The Allocation Reality: How Subscriptions Fit Your Portfolio
None of these subscriptions should replace your core investment strategy. Here’s how to think about them:
The Core-Explore Framework
| Allocation | Purpose | What Goes Here |
|---|---|---|
| 80-90% | Core | Low-cost index funds (total market, international) |
| 10-20% | Explore | Individual stocks from newsletters or your own research |
If your “explore” bucket is $50,000, that’s enough for 15-20 positions from a service like Stock Advisor. The $199 list price (or $99 intro) is a rounding error on that allocation. The math works.
If your explore bucket is $5,000, a $199 fee is 4% of your capital. Consider waiting until you’ve built a larger base, or use the research platforms to learn while primarily investing in index funds.
Combining Subscriptions
Some investors use multiple services strategically. The useful combinations pair different backbones, not two copies of the same one:
Stock Advisor + Alpha Picks: Hold discipline + documented sells. Same cadence, opposite exits. Complementary — and the one pairing that can teach you which rule you actually follow.
Stock Advisor + Morningstar: Picks + research tools. Use Stock Advisor for ideas, Morningstar to evaluate them independently at CAPE ~41–42.
Any Newsletter + TipRanks: Picks + accountability. Verify the experts behind recommendations you’re following.
Avoid subscribing to two stock-picking newsletters that both tell you to hold forever. You’ll get overlapping names at double the cost and still have only one sell rule: you.
The Decision Matrix
| If you… | Choose… | Because… |
|---|---|---|
| Want 2 picks/month and a hold rule (5+ years) | Stock Advisor | 24.5-year book, 92.9% win rate on 10+ year holds |
| Want 2 picks/month and a written sell (1-3 years) | Alpha Picks | Quant exits, 77.6% win rate for 1-3 year holds, APP −53% YTD is the live test |
| Want to make your own decisions | Morningstar Investor | Fair value + moat at CAPE ~41–42 |
| Love synthesizing diverse views | SA Premium | 18,000+ contributors, crowd-sourced |
| Need to verify expert credibility | TipRanks | Tracks 96,000+ experts |
| Focus on earnings revisions | Zacks Premium | 37+ year methodology; rank 4–5 is the sell |
| Trade actively on news | Benzinga Pro | Speed advantage, real-time alerts |
| Have <$25K to invest | Index funds first | Build your base before paying for subscriptions |
Frequently Asked Questions
What is the best investment newsletter overall?
Motley Fool Stock Advisor is the best investment newsletter if your backbone is a hold. Official +981% vs S&P +216% since 2002, 286 / 523 live book, 66% win rate, 49 ten-baggers, 92.9% win rate on 10+ year holds. Last independent audit (February 18): +888.4%. For shorter horizons that want a sell in writing, Alpha Picks’ +378.5% vs +105.6%, 103 positions, and 70% win rate is the other complete system.
What’s the best investment subscription for beginners?
Stock Advisor works best for beginners because it provides more than just picks—it includes portfolio strategies (Cautious, Moderate, Aggressive), Foundational Stocks to start with, and a hold rule you can state in one sentence. The framework helps beginners understand not just what to buy, but how long to sit.
Are investment newsletters worth the money?
Yes, if you follow the cadence and the sell rule. Stock Advisor’s 10+ year picks have a 92.9% win rate with 49 ten-baggers. Alpha Picks’ 1-3 year holds show a 77.6% win rate with +102.4% average returns. The key is matching the backbone — first-year results are closer to coin flips on both. One avoided mistake on a $5,000 position saves more than years of subscription costs.
What’s the difference between stock-picking newsletters and research platforms?
Stock-picking newsletters tell you what to buy and (if they’re honest) when to sell or not sell. Research platforms help you decide for yourself. Services like Stock Advisor and Alpha Picks provide specific buy recommendations plus a hold or exit rule. Platforms like Morningstar Investor and Seeking Alpha Premium provide data, ratings, and analysis tools but don’t make buy/sell recommendations. Choose based on whether you want a spine or a toolkit.
Stock Advisor vs Alpha Picks: Which is better?
It depends on hold period and sell discipline, not the scorecard:
- 5+ year hold, almost no sells: Stock Advisor. 24.5 years, official +981% vs +216%, 66% win, 49 ten-baggers, 286 actives.
- 1-3 year hold, documented sells: Alpha Picks. 70% win, +378.5% vs +105.6% since 2022, 103 positions. APP −53% YTD is what a sell system looks like in a software wipeout. Stock Advisor uses human analysts with narrative reasoning; Alpha Picks is pure quant with no human discretion. Alpha Picks has only 4.1 years of data—a legitimate caveat for long-term investors.
Can I use multiple investment subscriptions?
Yes, but pair different backbones. Complementary combinations work well: Stock Advisor (hold) + Alpha Picks (sells), or Stock Advisor (picks) + Morningstar (fair value). Avoid overlapping services that do the same thing—you’ll get similar picks at higher cost and still won’t know your sell rule.
How much money do I need to use an investment subscription?
$25,000+ in investable assets is ideal. At smaller portfolio sizes, the annual fee ($99–449) represents too large a percentage of your capital. If you have $10,000 to invest, a $199 fee is 2% annually—you need to beat the market by 2% just to break even on the subscription.
What’s the difference between Seeking Alpha Premium and Alpha Picks?
Seeking Alpha Premium is a research platform; Alpha Picks is a stock-picking service with sells. SA Premium ($269/year) gives you access to 18,000+ contributor articles, Quant ratings, and research tools—but no specific buy recommendations. Alpha Picks ($449/year) gives you 2 specific stock picks per month selected by the Quant algorithm, plus the rating / 12-month / 15% exits. Different products for different needs.
How do I know if an investment newsletter is legitimate?
Look for verified track records, transparent methodology, and an honest hold-or-sell rule. Services like Stock Advisor and Alpha Picks publish every historical recommendation with returns. Tools like TipRanks help you verify expert credibility. Be skeptical of services that only show winners or make unrealistic return claims.
What’s the best free alternative to paid investment subscriptions?
Index funds. If you’re not willing to pay for stock picking and follow the system, a low-cost S&P 500 index fund will outperform most active investors. Beating the market through stock selection requires either significant time investment (doing your own research) or paying for expertise. There’s no free shortcut that consistently works.
How long should I hold newsletter picks?
It depends on the service — this is the backbone:
- Stock Advisor: 5+ years minimum. 10+ year holds have 92.9% win rates with 49 ten-baggers.
- Alpha Picks: 1-3 years optimal. 77.6% win rate in that window, and the model will sell sooner if the rating or the 12-month clock says so. First-year results for both are closer to coin flips. The math only works if you hold to the service’s optimal horizon — or honor its sell.
Do investment newsletters work in bear markets?
The best ones do, but expect drawdowns. Stock Advisor’s 24.5-year track record includes the 2008 financial crisis, the 2020 COVID crash, and the 2022 bear market—and delivered official +981% through all of them. Morningstar’s 40+ years of methodology is recession-tested. Alpha Picks has a 2022 slice and a 4.1-year book; it does not yet have a full-cycle claim. The key is having a hold or sell rule before the drawdown — which is why cadence and methodology matter as much as picks.
How do investment newsletters perform when VIX is 14 and names still move 50–500%?
That’s the year a backbone earns the fee. VIX ~14 and a +14.54% index do not describe SanDisk +591% versus The Trade Desk −63%. Hardware boomed. Software wiped out. 211 points of spread is the real tape.
A calm volatility print is how people convince themselves they don’t need a system. Then they override the hold on a quality name that’s down 40% and override the sell on a factor winner that’s already rolled over.
- Stock Advisor is the hold backbone — 2 picks a month, 49 ten-baggers, 66% win rate, official +981% vs +216%. Built for the names you are supposed to sit with.
- Alpha Picks is the sell backbone — 2 picks a month, 70% win, +378.5% vs +105.6%, 103 positions. Built for the names the model is supposed to exit. APP −53% YTD is not a footnote.
- Morningstar is the valuation backbone — fair value and moat when the index is expensive and the intra-tech split is violent.
When VIX says complacent and the constituents say civil war, the newsletter is not entertainment. It is the decision you already made.
Should I pause my investment newsletter subscription if I run out of capital to invest?
Consider keeping research access but reducing expectations. Most investment newsletters provide value beyond just new picks—research tools, portfolio tracking, market commentary, and educational content. If you’re temporarily out of capital, you can still use the service to: (1) Research and rank existing picks for when capital becomes available, (2) Learn from the methodology to improve your independent analysis, (3) Monitor positions you already own. That said, if the $99-449/year feels burdensome, it’s better to cancel and re-subscribe later than to let the subscription add financial stress.
The Bottom Line
You came here trying to figure out which investment subscription is “best.” The real answer is which backbone you will not override when VIX is 14 and a name is moving 50% the wrong way.
If you want two picks a month and a hold rule built for 5+ years, Stock Advisor is the proven choice. Twenty-four and a half years. Official +981% vs +216%. 286 / 523. 66% wins. 49 ten-baggers. Last audit +888.4%. The system is the sit.
If you want two picks a month and a sell in writing for a 1-3 year window, Alpha Picks is the documented quant. +378.5% vs +105.6%. 103 positions. 70% win rate. APP −53% YTD is what that sell looks like on this tape.
If you want to make your own decisions with professional-grade tools, Morningstar Investor is the industry standard — especially at CAPE ~41–42.
If you need to verify who’s worth listening to, TipRanks tracks 96,000+ experts so you don’t have to trust blindly.
The bigger risk isn’t picking the “wrong” subscription. It’s spending another year consuming free content with no cadence, no hold period, and no sell rule while hardware compounds and software melts — and calling that research.
Pick the backbone that matches your horizon. Start with one subscription. Use it consistently for a year. That’s how you find out what actually works for you.
Start with Motley Fool Stock Advisor — 30-Day Money-Back Guarantee