Stock Advisor is the better choice for most investors. It has a stronger track record (+883.8% vs +313.8%), costs one-third the price ($99 vs $299), and is available as a standalone service. Rule Breakers requires buying the Epic bundle—you can’t get it alone—and delivers more volatility for less proven outperformance.
In February 2026’s high-dispersion market — where 83-point dispersion hits a NEW 2026 HIGH, the S&P 500 pushes to ~6,883 (+0.68% YTD, within 1.4% of ATH), and the VIX drops to 20.29 as AI panic subsides — GARP quality (Stock Advisor) retains the edge, but Rule Breakers’ conditions are IMPROVING.
Quality (Stock Advisor) retains the near-term edge:
- 83-point dispersion (new 2026 high) — top 20 stocks average +51.8%, bottom 20 average -30.7% — Stock Advisor’s quality GARP approach thrives when the spread between winners and losers widens
- Enterprise software still under pressure: CRM -29%, NOW -29%, WDAY -34%, INTU -41% — while memory/storage surges with SNDK +155%, WDC +75%, MU +48% — Stock Advisor’s GARP methodology navigates this bifurcation by favoring profitable tech
- Energy leads with BKR +36% and SLB +35% in the top 20 — sector leadership at Energy +22.5%, Materials +16.9% rewards quality over speculation
- The 2Y Treasury at 3.47% sits below the Fed’s 3.50-3.75% range, pricing in cuts; CPI at 2.4% (core 2.5%) confirms disinflation
- 883.8% total return, 42 ten-baggers, and 182 doublers across 504 positions prove through-cycle compounding
Growth (Rule Breakers) conditions are IMPROVING — and that’s the contrarian signal:
- The VIX has dropped to 20.29 (down 4.3%) as AI panic subsides — declining volatility historically lifts growth stock multiples
- Enterprise software names are beaten-down: INTU -41%, WDAY -34%, CRM -29%, NOW -29% — these ARE Rule Breakers-type stocks at compressed valuations
- Tech is rebounding from its lows: the sector sits at -2.1% (improving from -3.1% last week) — early signs of rotation back toward innovation
- Manufacturing PMI at 52.6 signals economic expansion that supports growth company revenues
- 60 ten-baggers and a 97.5% win rate for 10+ year holds prove the methodology works — and improving conditions mean near-term pain is easing
The framework for deciding:
- Quality for safety now: Stock Advisor’s through-cycle track record (+883.8%, 42 ten-baggers, 65% win rate) thrives when 83-point dispersion rewards discipline. With the S&P 500 near ATH but consumer confidence at a 12-year low, quality GARP navigates the disconnect
- Growth for asymmetric upside as conditions improve: Rule Breakers’ 97.5% win rate for 10+ year holds was built by buying when growth stocks were hated. The VIX declining to 20.29 and tech beginning to rebound signals the headwinds are easing — not gone, but easing
The S&P 500 has pushed to ~6,883 (+0.68% YTD, within 1.4% of its all-time high), but the VIX at 20.29 (down 4.3%) tells a nuanced story: AI panic is subsiding, yet consumer confidence remains at a 12-year low. The 2Y yield at 3.47% sits below the Fed’s 3.50-3.75% range, pricing in cuts. CPI at 2.4% (core 2.5%) confirms the disinflation trend. Credit spreads at 2.94% show no systemic stress. Manufacturing PMI at 52.6 says the economy is expanding. Stock Advisor’s 883.8% total return was built through exactly these mixed-signal moments — when quality compounds while speculation hesitates. But with the VIX declining and tech rebounding, Rule Breakers’ conditions are the best they’ve been in months. The question is your time horizon.
Compare Stock Advisor vs Rule Breakers
But here’s what most comparisons miss: you’re not really choosing between two services. You’re choosing between standalone Stock Advisor at $99/year or the full Motley Fool Epic bundle at $299/year, which happens to include Rule Breakers alongside Stock Advisor and two other services. We cover both in detail in our Stock Advisor review and Epic bundle review.
That changes the math entirely.
Quick Comparison: Motley Fool Stock Advisor vs Rule Breakers
| Dimension | Stock Advisor | Rule Breakers | Edge |
|---|---|---|---|
| Track Record | +883.8% since 2002 | +313.8% since 2004 | Stock Advisor |
| S&P 500 Outperformance | 4.5x | +145 pts | Stock Advisor |
| Price | $99/year (promo) | $299/year (Epic bundle) | Stock Advisor |
| Standalone Available? | Yes | No (Epic only) | Stock Advisor |
| Expected Volatility | 30-50% drawdowns | 50%+ drawdowns | Stock Advisor |
| 10+ Year Win Rate | 92% | 97.5% | Rule Breakers (transparency) |
| Target Portfolio | $25,000+ | $50,000+ | Stock Advisor (accessibility) |
| Methodology | Balanced growth | Aggressive disruptors | Tie (different approaches) |
| Overall Winner | — | — | Stock Advisor |
The numbers don’t lie: Stock Advisor has beaten the market by a wider margin, costs less, and doesn’t force you into a bundle. For most investors, the decision is straightforward.
Motley Fool Stock Advisor: The 23-Year Track Record
Motley Fool Stock Advisor is the original Motley Fool subscription—the service that built their reputation. Launched in 2002 by Tom and David Gardner, it’s now led by Chief Investment Officer Andy Cross and a team of analysts. For the full breakdown of features, pricing, and performance, see our Stock Advisor review.

Motley Fool Stock Advisor Performance
The Motley Fool · 504 picks · 24 years · Updated Feb 18, 2026
| SA Return | S&P 500 | Alpha | Win Rate |
|---|---|---|---|
| +888% | +193% | +695% | 65% |
S&P 500 shows what you'd have earned buying the index on each pick date instead. Same timing, fair comparison.
| SA Multi-Baggers | 10x+ | 5x+ | 3x+ | 2x+ |
|---|---|---|---|---|
| Count | 42 | 86 | 126 | 181 |
| SA Asymmetry | Avg Winner | Avg Loser | Ratio |
|---|---|---|---|
| Return | +1.5K% | -45% | ~34:1 |
Best Performers (All-Time)
| SA Pick | Return |
|---|---|
 NVDA NVIDIA | +113K% |
 AMZN Amazon | +26K% |
 AAPL Apple | +5.4K% |
 BKNG Booking Holdings | +18K% |
 DIS Disney | +5.9K% |
 CTAS CTAS | +4.4K% |
 MME.DL MME.DL | +4.3K% |
 TSLA Tesla | +19K% |
 COST Costco | +3.5K% |
 NFLX Netflix | +41K% |
42 ten-baggers. These 1,000%+ winners—NVDA, NFLX, AMZN—are what drive the portfolio. You don't need to pick all winners; you need a few massive ones.
See All Stock Advisor Recommendations →Latest Stock Advisor Picks
Tickers masked to protect subscriber value. Recent picks need 3-5+ years to demonstrate thesis.
| SA Pick | Return |
|---|---|
**** Chip Equipment | +95% |
**** Mobile App Platform | +70% |
**** Space Launch | +58% |
**** Infrastructure Construction | +46% |
**** Growth Company | +35% |
**** Growth Company | +33% |
**** Growth Company | +24% |
**** Athletic Apparel | +16% |
**** Growth Company | +12% |
**** Athletic Footwear | +5% |
Early results mislead. < 1 year: 54.3% win rate. 10+ years: 92.9%. That 39-point gap explains why judging picks early leads to selling future winners.
Stock Advisor Win Rate by Holding Period
| Hold Time | SA Win Rate | Avg Return |
|---|---|---|
| < 1 Year | 54.3% | +10% |
| 1-3 Years | 58.2% | +13% |
| 3-5 Years | 37.2% | -2% |
| 5-10 Years | 62.8% | +181% |
| 10+ Years | 92.9% | +3.7K% |
504 data points over 24 years. The pattern repeats: early volatility, mid-term clarity, long-term outperformance. The data is the strategy.
Stock Advisor Performance by Year
| Year | SA Picks | Avg Return | Win Rate | |
|---|---|---|---|---|
| 2026 | 2 | 0% | 50% | CASY+4% |
| 2025 | 25 | +6% | 52% | HWM+106% |
| 2024 | 25 | +6% | 58% | SHOP+85% |
| 2023 | 25 | +44% | 75% | CRWD+235% |
| 2022 | 23 | +22% | 43% | NET+285% |
| 2021 | 23 | -33% | 17% | LRCX+360% |
| 2020 | 24 | +82% | 29% | TSLA+1.3K% |
| 2019 | 24 | +36% | 67% | SNPS+243% |
| 2018 | 22 | +155% | 64% | SHOP+795% |
| 2017 | 23 | +568% | 87% | NVDA+7.1K% |
| 2016 | 21 | +367% | 81% | SHOP+3.4K% |
| 2015 | 24 | +195% | 71% | CASY+721% |
| 2014 | 21 | +215% | 81% | IBKR+995% |
| 2013 | 19 | +324% | 68% | NFLX+2.4K% |
| 2012 | 23 | +1.3K% | 74% | TSLA+19K% |
| 2011 | 19 | +492% | 63% | AAPL+2.6K% |
| 2010 | 18 | +418% | 83% | AMZN+2.2K% |
| 2009 | 20 | +2.8K% | 90% | NVDA+48K% |
| 2008 | 18 | +1.0K% | 94% | AAPL+5.4K% |
| 2007 | 19 | +1.5K% | 37% | NFLX+27K% |
| 2006 | 20 | +2.3K% | 65% | NFLX+24K% |
| 2005 | 16 | +7.2K% | 63% | NVDA+113K% |
| 2004 | 17 | +5.4K% | 59% | NFLX+41K% |
| 2003 | 17 | +230% | 65% | BWA+1.4K% |
| 2002 | 16 | +2.6K% | 81% | AMZN+26K% |
Inside Stock Advisor
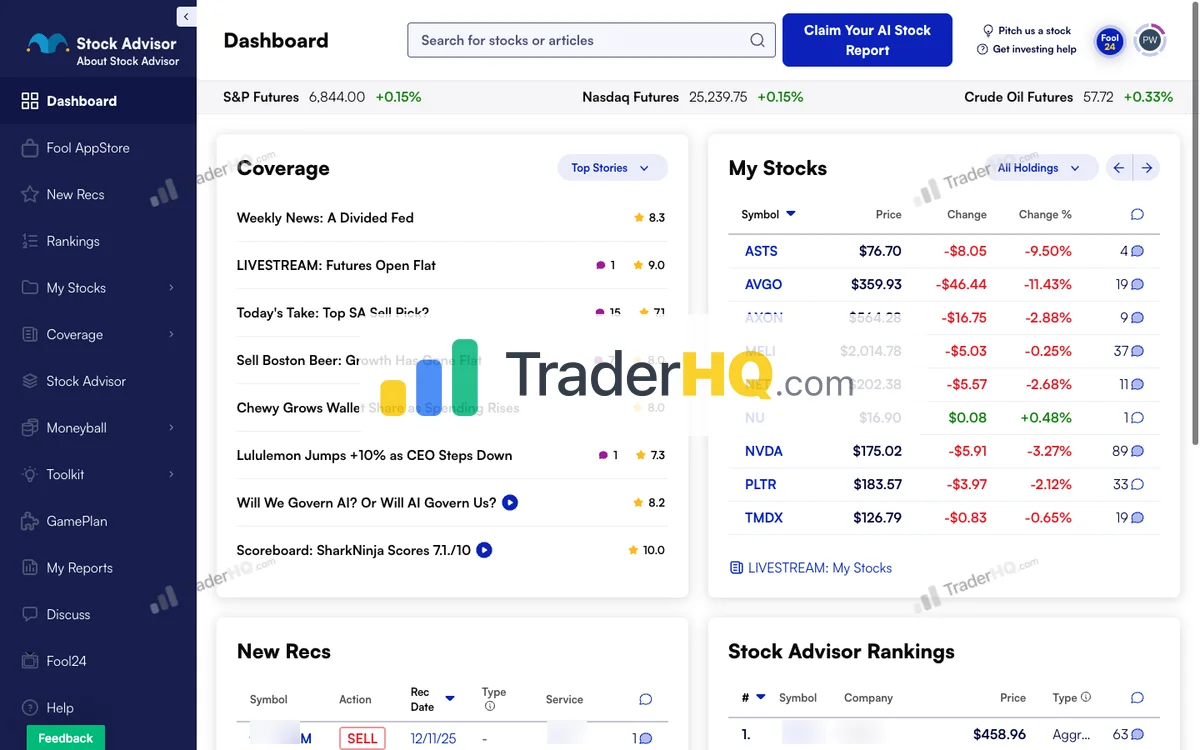
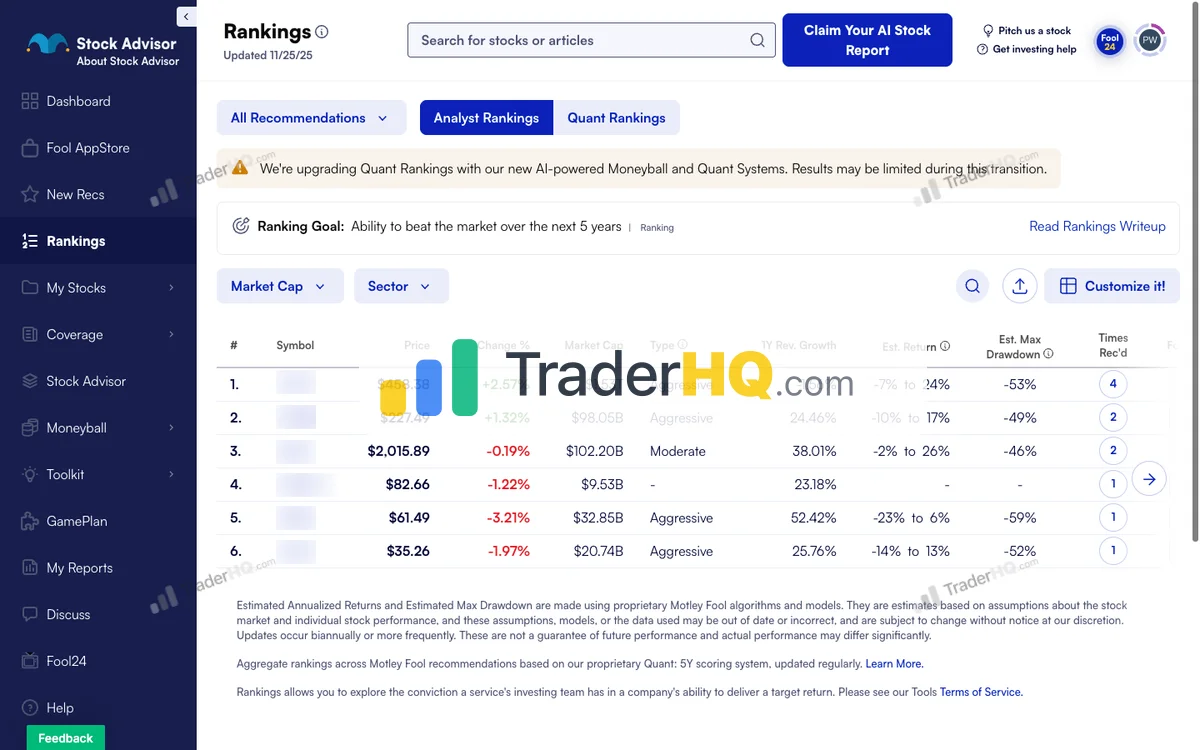
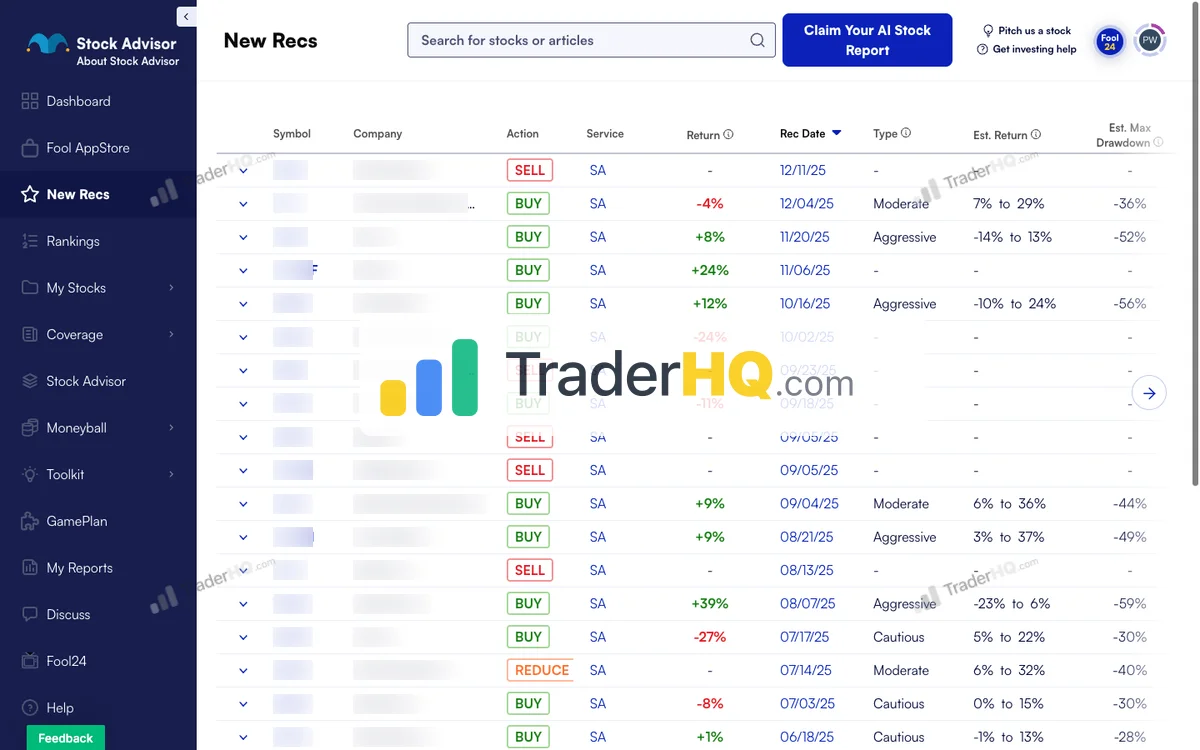
9 screenshots · Click to expand
The philosophy is deceptively simple: find companies with durable competitive advantages, buy them, and hold for years while the market catches up to their value.
The Numbers That Matter
Since 2002, Stock Advisor picks have returned +883.8% compared to the S&P 500’s +196% over the same period. That’s 4.5x outperformance—put another way, $10,000 invested following their picks would be worth roughly $98,380 today. The same amount in an index fund would be about $29,600.
The win rate tells the story of patience: 65% overall, improving to 92% for positions held 10+ years. They’ve generated 42 ten-baggers and 182 doublers across 504 positions—the kind of asymmetric wins that justify long-term holding.
But those headline numbers hide real volatility. Stock Advisor’s portfolio dropped 40% in 2022 while the S&P fell 18%. Their biggest winners—Netflix, Amazon, Nvidia—have all seen 50%+ drawdowns at various points. The strategy works if you can hold through the pain. Most people can’t.
What You Actually Get
- 2 new stock picks per month — Each with a detailed investment thesis
- Foundational Stocks list — 10 highest-conviction core holdings, updated regularly
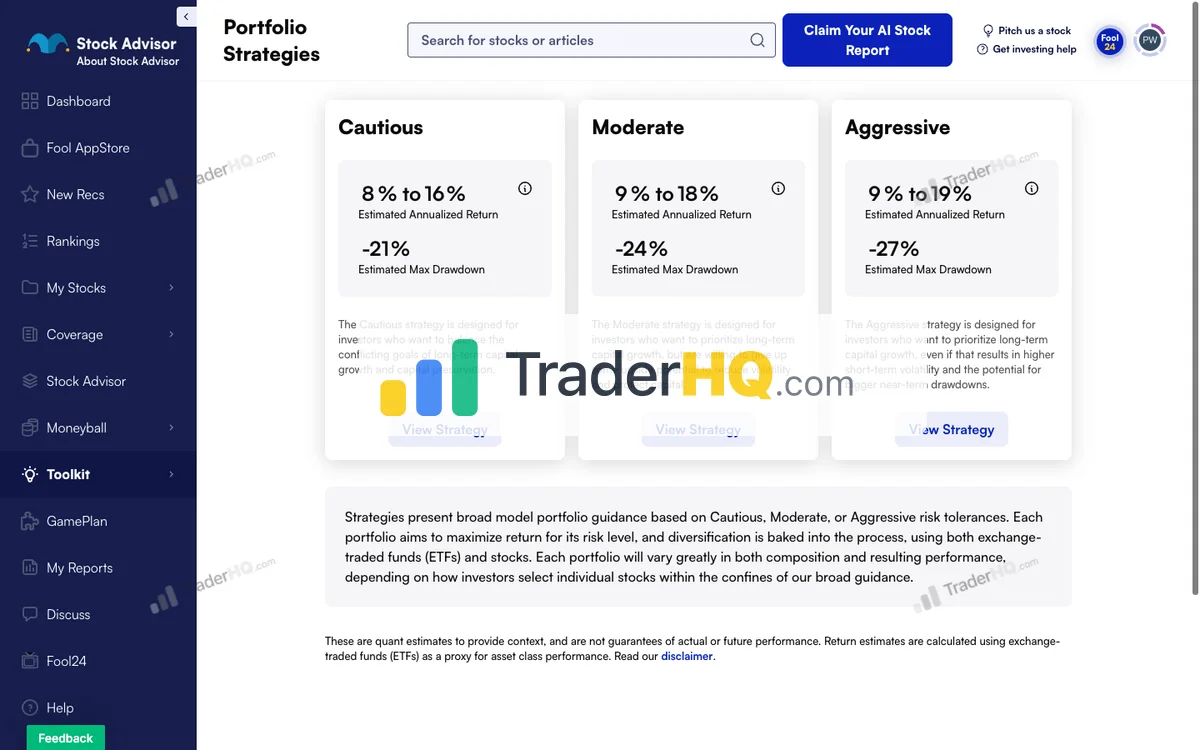
- Three portfolio strategies — Cautious, Moderate, and Aggressive frameworks calibrated to different risk tolerances
- Moneyball database — 344 stocks with quantitative projections for independent research
- Full scorecard — Every pick since 2002, wins and losses, completely transparent
The Strengths
- Proven track record — 24 years of verifiable, market-beating performance
- Standalone availability — $99/year (promo) or $199/year without bundling
- Lower volatility — Still volatile (30-50% drawdowns), but more moderate than Rule Breakers
- Complete framework — Not just picks, but a system for building a portfolio
The Limitations
- Requires 5+ year holding period — This isn’t a suggestion; it’s the entire strategy
- 2020-2021 vintage struggled — Recent picks faced brutal drawdowns
- Upsell pressure — Constant promotion of Epic, Epic Plus, and higher tiers
- Not for active traders — If you want to trade around positions, look elsewhere
Best For
Patient investors with 5+ year horizons, $25K+ portfolios, who can hold through 30-50% drawdowns and want a framework for building wealth—not just stock tips.
Try Stock Advisor — 30-Day Money-Back Guarantee
Rule Breakers: The Aggressive Growth Play
Motley Fool Rule Breakers is the growth-hunting arm of the Motley Fool ecosystem. Launched in 2004, it targets disruptive innovators before they become obvious—the companies breaking rules in their industries.

Motley Fool Rule Breakers Performance
The Motley Fool · 369 picks · 21 years · Updated 2026-02-19
| RB Return | S&P 500 | Alpha | Win Rate |
|---|---|---|---|
| +313% | +167% | +146% | 72% |
S&P 500 shows what you'd have earned buying the index on each pick date instead. Same timing, fair comparison.
| RB Multi-Baggers | 10x+ | 5x+ | 3x+ | 2x+ |
|---|---|---|---|---|
| Count | 60 | 104 | 139 | 187 |
| RB Asymmetry | Avg Winner | Avg Loser | Ratio |
|---|---|---|---|
| Return | +2.0K% | -41% | ~48:1 |
Best Performers (All-Time)
| RB Pick | Return |
|---|---|
TSLA Tesla | +19K% |
DIS Disney | +5.9K% |
 MELI MercadoLibre | +14K% |
BKNG Booking Holdings | +18K% |
 SHOP Shopify | +5.3K% |
 ISRG Intuitive Surgical | +10.0K% |
AMZN Amazon | +26K% |
NFLX Netflix | +41K% |
NVDA NVIDIA | +113K% |
AAPL Apple | +5.4K% |
60 ten-baggers. These 1,000%+ winners—NVDA, NFLX, AMZN—are what drive the portfolio. You don't need to pick all winners; you need a few massive ones.
See All Rule Breakers Recommendations →Latest Rule Breakers Picks
Tickers masked to protect subscriber value. Recent picks need 3-5+ years to demonstrate thesis.
| RB Pick | Return |
|---|---|
**** Chip Equipment | +95% |
**** Genetic Medicine | +89% |
**** Growth Company | +45% |
**** RNA Therapeutics | +14% |
**** Growth Company | +12% |
**** Convenience Stores | +4% |
**** LatAm E-commerce | -7% |
**** Growth Company | -19% |
**** Growth Company | -21% |
**** Travel & Lodging Platform | -23% |
Early results mislead. < 1 year: 35.3% win rate. 10+ years: 98.3%. That 63-point gap explains why judging picks early leads to selling future winners.
Rule Breakers Win Rate by Holding Period
| Hold Time | RB Win Rate | Avg Return |
|---|---|---|
| < 1 Year | 35.3% | -6% |
| 1-3 Years | 59.6% | +21% |
| 3-5 Years | 45% | +22% |
| 5-10 Years | 70.6% | +304% |
| 10+ Years | 98.3% | +4.1K% |
Time is the strategy. 10+ year picks show 98.3% win rate with +4.1K% average returns. Same methodology, same picks—time transforms the results.
Rule Breakers Performance by Year
| Year | RB Picks | Avg Return | Win Rate | |
|---|---|---|---|---|
| 2026 | 3 | -18% | 50% | CASY+4% |
| 2025 | 17 | -6% | 29% | ASML+95% |
| 2024 | 23 | +30% | 65% | GH+251% |
| 2023 | 31 | +26% | 61% | CRWD+262% |
| 2022 | 32 | +38% | 50% | ANET+450% |
| 2021 | 28 | -8% | 36% | LRCX+360% |
| 2020 | 26 | -7% | 27% | ASML+285% |
| 2019 | 25 | +66% | 80% | DDOG+277% |
| 2018 | 22 | +224% | 82% | MDB+1.0K% |
| 2017 | 22 | +596% | 86% | NVDA+7.1K% |
| 2016 | 23 | +783% | 91% | SHOP+5.3K% |
| 2015 | 12 | +383% | 92% | AXON+1.7K% |
| 2014 | 16 | +713% | 100% | ANET+3.0K% |
| 2013 | 13 | +611% | 100% | NFLX+2.4K% |
| 2012 | 12 | +1.2K% | 100% | META+2.7K% |
| 2011 | 11 | +2.6K% | 91% | TSLA+19K% |
| 2010 | 5 | +1.3K% | 100% | AMZN+2.2K% |
| 2009 | 12 | +6.4K% | 100% | NVDA+48K% |
| 2008 | 8 | +2.3K% | 100% | AAPL+5.4K% |
| 2007 | 7 | +1.1K% | 100% | CMG+3.0K% |
| 2006 | 7 | +7.1K% | 100% | NFLX+24K% |
| 2005 | 7 | +20K% | 100% | NVDA+113K% |
| 2004 | 3 | +31K% | 100% | NFLX+41K% |
| 2003 | 2 | +968% | 100% | HAS+1.2K% |
| 2002 | 2 | +16K% | 100% | AMZN+26K% |
Here’s the critical detail most comparisons bury: Rule Breakers is not available as a standalone service. You must purchase the Epic bundle at $299/year (new members, $499 regular) to access it. That bundle includes Stock Advisor, Rule Breakers, Hidden Gems, and Dividend Investor. Learn more in our Epic bundle review.
The Numbers That Matter
Since 2004, Rule Breakers picks have returned +313.8% compared to the S&P 500’s +169% over the same period. That’s 1.9x outperformance—meaningful, but notably less than Stock Advisor’s 4.5x.
Where Rule Breakers shines is in its transparency about time horizons:
| Holding Period | Win Rate | Average Return |
|---|---|---|
| < 1 Year | 33.3% | -8.4% |
| 1-3 Years | 55.9% | +20.1% |
| 5-10 Years | 70.3% | +304.1% |
| 10+ Years | 97.5% | +4,185% |
That 97.5% win rate at 10+ years is remarkable—but it requires a decade of patience that few investors actually have.
The Asymmetric Math
Rule Breakers explicitly embraces asymmetry: winners average +2,039%, losers average -36.8%. The asymmetry is massive. Even if you pick more losers than winners in any given year, the math still works over time.
The catch? You need to hold long enough for the winners to run. Sell early, and you’re left with the losers.
What You Actually Get (via Epic Bundle)
- 2 new Rule Breakers picks per month — Focused on disruptive innovators
- Access to 3 other scorecards — Stock Advisor, Hidden Gems, Dividend Investor
- 382 active positions — Full historical scorecard
- Moneyball quant scoring — Sophisticated ranking system for all positions
- 30-day money-back guarantee — On the Epic bundle
The Strengths
- Explicit time horizon data — They show you exactly how patience pays
- Massive asymmetric math — Winners avg +2,039% vs losers avg -36.8%
- Bundle value — If you want multiple scorecards, Epic is efficient
- Disruptor focus — Access to high-growth innovators before they’re obvious
The Limitations
- No standalone option — Must buy $299+ Epic bundle
- Extreme volatility — 50%+ drawdowns are normal; some positions down 80-90%
- 2020-2021 vintage brutal — 35-39% win rates on recent picks
- David Gardner no longer picks stocks — He stepped back in May 2021; the analyst team now makes all recommendations
- Higher portfolio requirement — $50K+ recommended to properly diversify
Best For
Aggressive investors with genuine 10+ year time horizons, $50K+ portfolios, who can stomach 50%+ drawdowns and want exposure to disruptive innovators before they become household names.
Explore Epic Bundle — Includes Rule Breakers + Stock Advisor
Head-to-Head: The Key Differences
Both services pick growth stocks. Both have long track records. Both are from the same company. So what actually separates them?
Difference #1: Risk Profile
Stock Advisor targets balanced growth—companies with competitive advantages that can compound steadily. Rule Breakers targets aggressive disruption—companies breaking rules in their industries, often before profitability.
The result: Rule Breakers is significantly more volatile. Expect 50%+ drawdowns on individual positions, with some down 80-90% before (potentially) recovering. Stock Advisor’s 30-50% drawdowns feel tame by comparison.
If you’ve never held a position down 70% while the thesis remains intact, you don’t know if you can do it. Most people discover they can’t.
Difference #2: Track Record Depth
Stock Advisor has 24 years of data. Rule Breakers has 22 years. But the performance gap is significant:
- Stock Advisor: +883.8% vs S&P’s +196% (4.5x outperformance), 65% win rate (92% for 10+ years), 42 ten-baggers, 504 positions
- Rule Breakers: +313.8% vs S&P’s +169% (+145 points outperformance), 97.5% win rate for 10+ years, 60 ten-baggers, 382 positions, 71% overall win rate
Stock Advisor has simply beaten the market by more, over a longer period. That’s not a knock on Rule Breakers—1.9x the S&P is excellent—but the comparison is clear. Notably, Rule Breakers’ 97.5% win rate for 10+ year holds edges past Stock Advisor’s 92%, suggesting that for the most patient investors, Rule Breakers’ disruptive bets pay off at an even higher rate.
Difference #3: Availability and Pricing
This is the decisive factor for many investors:
| Service | Standalone Price | Bundle Required? |
|---|---|---|
| Stock Advisor | $99/year (promo) | No |
| Rule Breakers | N/A | Yes (Epic at $299/year) |
If you only want one Motley Fool service, Stock Advisor is your only option. Rule Breakers forces you into a $299+ commitment that includes three other services you may or may not want. See our Epic bundle review for a full breakdown of what’s included.
Difference #4: Time Horizon Requirements
Both services preach patience, but Rule Breakers requires more patience:
- Stock Advisor: 5+ year holding period recommended
- Rule Breakers: 10+ years for the 98% win rate
Rule Breakers’ first-year picks mostly start underwater (33% win rate, -8.4% average return). The edge only emerges with time. If you’re not genuinely planning to hold for a decade, the 97.5% win rate and 60 ten-baggers won’t materialize for you.
The Decision Framework
Stop asking “which is better?” Start asking “which is right for me?”
Choose Stock Advisor If You:
- Want to start with Motley Fool and prefer simplicity
- Have a $25K+ portfolio but not $50K+
- Prefer lower volatility (30-50% drawdowns vs 50%+)
- Want a standalone service without bundling
- Have a 5+ year horizon (not necessarily 10+)
- Are cost-conscious ($99 vs $299)
Choose Rule Breakers (Epic Bundle) If You:
- Want multiple Motley Fool scorecards (Stock Advisor + Rule Breakers + Hidden Gems + Dividend Investor)
- Have $50K+ to deploy across aggressive positions
- Can genuinely hold through 50%+ drawdowns without panic selling
- Have a 10+ year time horizon
- Want exposure to disruptive innovators before they’re obvious
- See the bundle as value, not forced upselling
Either Works If You:
- Will actually follow the recommendations (the biggest variable is you, not the service)
- Understand that 35%+ of picks from any service will lose money
- Are adding this as one input to your process, not your entire strategy
- Can resist the urge to sell during drawdowns
The Tiebreaker
Still stuck? Ask yourself: “Would I hold through a 70% drop on a single position?”
If that makes you queasy, Stock Advisor. If you can genuinely do it, Rule Breakers might suit your temperament—but you’ll need to buy the Epic bundle to find out.
The Real Question: Is Epic Worth It?
Since Rule Breakers requires the Epic bundle, the real decision is often: Stock Advisor alone ($99) or Epic ($299)?
Here’s the math:
| Option | Price | What You Get |
|---|---|---|
| Stock Advisor alone | $99/year | 1 scorecard |
| Epic bundle | $299/year | 4 scorecards (Stock Advisor + Rule Breakers + Hidden Gems + Dividend Investor) |
That’s roughly $75 per scorecard in Epic vs $99 for Stock Advisor alone. If you’ll use multiple scorecards, Epic is better value. If you only want Stock Advisor, the bundle is overpaying for services you won’t use.
The honest answer: Most investors should start with Stock Advisor alone. If you find yourself wanting more after a year, upgrade to Epic then. Starting with the bundle because Rule Breakers sounds exciting usually leads to paying for services you ignore.
Start with Stock Advisor — Upgrade to Epic Later If Needed
The Bottom Line
Stock Advisor wins for most investors. The 24-year track record is stronger (+883.8% vs +313.8%), the 65% win rate improves to 92% for decade-long holds, the price is lower ($99 vs $299), the volatility is more manageable (30-50% vs 50%+), and you can actually buy it standalone. In February 2026’s rotation market — where the S&P 500 has pushed to ~6,883 (+0.68% YTD, within 1.4% of ATH), 83-point dispersion (a new 2026 high) separates winners from losers, and sector rotation has pushed Energy to +22.5% and Materials to +16.9% — Stock Advisor’s quality GARP approach is precisely what this environment rewards. CPI at 2.4% confirms disinflation, but consumer confidence at a 12-year low signals that quality over speculation remains the dominant theme.
Rule Breakers is the smarter choice if you want the full Epic ecosystem, have $50K+ to deploy, can hold through extreme volatility, and have a genuine 10+ year horizon. The 97.5% win rate at 10+ years and 60 ten-baggers are real — but so is the requirement to actually hold that long. Here’s the shift: conditions are improving for Rule Breakers. The VIX has dropped to 20.29 (down 4.3%), tech is rebounding from its lows (-2.1%, up from -3.1% last week), and manufacturing PMI at 52.6 signals expansion. Enterprise software names like INTU (-41%), WDAY (-34%), CRM (-29%), and NOW (-29%) remain beaten-down — historically, that’s when the best 10-year returns begin. With Rule Breakers’ 71% overall win rate and 187 doublers across 382 positions, the methodology’s track record of buying during pessimism is well-documented.
The question isn’t which service is “better.” It’s which one you’ll actually use. A mediocre service you follow beats a great service you ignore.
If I had to pick one for a friend who’s never subscribed to a stock-picking service? Stock Advisor, because the lower volatility and standalone availability make it easier to build the habits that matter. Rule Breakers is for investors who’ve already proven they can hold through pain.
For a broader look at all your options, explore our guide to the best stock advisors. Considering other comparison angles? See our Rule Breakers vs Morningstar Investor or Rule Breakers vs Seeking Alpha Premium deep dives.
Try Stock Advisor — $99/Year, 30-Day Guarantee
Frequently Asked Questions
Rule Breakers vs Stock Advisor: Which is better?
Stock Advisor wins for most investors—especially in the current quality rotation. It has a stronger track record (+883.8% vs +313.8%), 42 ten-baggers, costs less ($99/year vs $299/year for Epic), and is available standalone.
The February 2026 market makes the case clearly:
- Quality is winning now: The S&P 500 has pushed to ~6,883 (+0.68% YTD), but 83-point dispersion (a new 2026 high) means stock selection is the whole game. Energy leads at +22.5%, Materials at +16.9%, while Tech sits at -2.1%. Stock Advisor’s GARP methodology thrives in this environment
- Growth conditions are IMPROVING: The VIX has dropped to 20.29 (down 4.3%) as AI panic subsides, tech is rebounding from its lows, and manufacturing PMI at 52.6 signals expansion. Enterprise software remains beaten-down (INTU -41%, WDAY -34%, CRM -29%), but declining volatility historically lifts growth multiples
- The contrarian case is strengthening: Consumer confidence at a 12-year low and beaten-down software names are historically the exact setup that precedes strong 10-year returns. Rule Breakers’ 97.5% win rate for 10+ year holds was built by buying during exactly this kind of growth compression
In an 83-point dispersion market where the top 20 stocks average +51.8% and the bottom 20 average -30.7%, stock selection matters enormously. Choose Stock Advisor for safety and proven through-cycle returns. Choose Rule Breakers (via Epic) if you have a genuine 10+ year horizon and want to position in beaten-down growth as conditions improve.
Is Motley Fool Stock Advisor worth it?
Yes, for long-term investors who can hold 5+ years. At $99/year (promotional price), Stock Advisor has returned +883.8% since 2002 compared to the S&P 500’s +196%. The 65% overall win rate improves to 92% for 10+ year holds, with 42 ten-baggers and 182 doublers generated across 504 positions. The math works if you follow the strategy—patience lets the winners compensate. The 30-day money-back guarantee lets you evaluate risk-free. See our full Stock Advisor review for detailed analysis.
Is Motley Fool Rule Breakers worth it?
For aggressive investors with 10+ year horizons, yes—but understand the tradeoffs. Rule Breakers has returned +313.8% since 2004 (vs S&P 500’s +169%), with a remarkable 97.5% win rate on picks held 10+ years and a 71% overall win rate across 382 positions. However, it’s only available through the Epic bundle ($299/year), volatility is extreme (50%+ drawdowns common), and first-year picks mostly start underwater (33% win rate). The improving market conditions — VIX declining to 20.29, tech rebounding — make this a better entry point than recent months. It’s worth it if you’ll actually hold that long. Learn more in our Epic bundle review.
Can I subscribe to Rule Breakers without Stock Advisor?
No. Rule Breakers is not available as a standalone service. You must purchase the Motley Fool Epic bundle ($299/year for new members, $499/year regular), which includes Stock Advisor, Rule Breakers, Hidden Gems, and Dividend Investor. If you only want Rule Breakers, you’re forced to pay for three additional services.
Should I get Stock Advisor or Epic?
Start with Stock Advisor alone ($99/year) unless you’re certain you want multiple scorecards. Epic ($299/year) includes four services—Stock Advisor, Rule Breakers, Hidden Gems, and Dividend Investor—making it roughly $75 per scorecard. That’s good value if you’ll use them all, but most beginners should prove they can follow one service before adding complexity. See our Epic bundle review for a detailed breakdown. Upgrade to Epic after a year if you want more.
Which is better in 2026’s market: Rule Breakers or Stock Advisor?
Stock Advisor retains the near-term edge, but Rule Breakers’ conditions are improving. The S&P 500 has pushed to ~6,883 (+0.68% YTD, within 1.4% of ATH), and 83-point dispersion (a new 2026 high) separates winners (top 20 at +51.8%) from losers (bottom 20 at -30.7%). Energy leads at +22.5%, Materials at +16.9%, and Stock Advisor’s quality GARP approach thrives in this rotation. But here’s the shift: the VIX has dropped to 20.29 (down 4.3%) as AI panic subsides, tech is rebounding (-2.1%, improving from -3.1%), and manufacturing PMI at 52.6 signals expansion. Enterprise software names remain beaten-down (INTU -41%, WDAY -34%, CRM -29%, NOW -29%), but declining volatility historically lifts growth multiples. For Stock Advisor: proven through-cycle quality in a high-dispersion market. For Rule Breakers: improving conditions for growth with beaten-down entry points and a 97.5% win rate for 10+ year holds.
Can I use both Rule Breakers and Stock Advisor together?
Yes — and if you want Rule Breakers, you automatically get both. Rule Breakers is only available through the Epic bundle ($299/year), which includes Stock Advisor. Many investors use Stock Advisor as the portfolio foundation (quality GARP compounders, 883.8% total return, 42 ten-baggers) and Rule Breakers as the growth accelerator (disruptive innovators, 313.8% total return, 60 ten-baggers). In 2026’s high-dispersion market — with 83-point dispersion at a new 2026 high and the VIX declining to 20.29 — Stock Advisor picks provide stability while Rule Breakers positions offer asymmetric upside as growth conditions improve. The services are designed to complement each other — Stock Advisor builds the base, Rule Breakers adds the moonshots.
Does David Gardner still pick stocks for Rule Breakers?
No. David Gardner stepped back from active stock picking in May 2021. The Rule Breakers analyst team now makes all recommendations using his methodology and criteria. The same is true for Stock Advisor—Tom Gardner has limited involvement, with Andy Cross (Chief Investment Officer) leading the team. Neither service is “the Gardner brothers’ picks” anymore.