

Stock Advisor is the better choice for most investors. It has a stronger track record (+978.9% vs +311.9% — TraderHQ analysis of the published trade log, data as of Aug 31 and Aug 19, 2026, respectively), costs one-third the price ($99 vs $299), and is available as a standalone service. Rule Breakers requires buying the Epic bundle—you can’t get it alone—and delivers more volatility for less proven outperformance.
In the market as of Aug 31, 2026 — S&P 500 at ~7,686 (+13.1% YTD total return) with a 210-point spread between the average top-20 and bottom-20 stock — stock selection is the whole game, and quality GARP (Stock Advisor) retains the edge. The catch for Rule Breakers: a possible September Fed hike.
Quality (Stock Advisor) retains the near-term edge:
- 210-point dispersion — top 20 S&P stocks average +168.7% YTD, bottom 20 average -41.6% (Slickcharts, Aug 31, 2026) — Stock Advisor’s quality GARP approach is built for exactly this selection environment
- Leadership is memory/storage, refiners, cybersecurity, and biotech: SNDK +560%, MU +236%, MRNA +376% — while enterprise software stays beaten down (INTU -45.8%). Stock Advisor’s methodology can own the winners and treat the software names as thesis calls
- The Fed is holding at 3.50-3.75% with ~60-65% odds of a September hike after Chair Warsh’s Jackson Hole speech (CME FedWatch, Aug 28) — this is when a record tested through 2008, 2020, and 2022 stops being a slogan
- CPI at 3.4% (core 2.5%, BLS, July 2026) is sticky, with energy up 14.7% year-over-year
- 978.9% total return, 46 ten-baggers, and 191 doublers across 526 positions prove through-cycle compounding (TraderHQ analysis of the published trade log, data as of Aug 31, 2026)
Growth (Rule Breakers) has the right themes but a rate headwind:
- Innovation themes are accelerating in the right growth: memory/HBM demand is sold out and mRNA oncology just validated — historically Rule Breakers’ hunting ground
- Enterprise software names are beaten-down: INTU -45.8% — these ARE Rule Breakers-type stocks at compressed valuations, but only if the thesis holds
- The drag: high-duration growth de-rates hardest when the discount rate jumps, and a September hike is ~65% priced
- 37 ten-baggers and a 98.6% win rate for 10+ year holds prove the methodology works — and patience is the admission price
The framework for deciding:
- Quality for safety now: Stock Advisor’s through-cycle track record (+978.9%, 46 ten-baggers, 66% win rate) thrives when 210-point dispersion rewards discipline — and its 2008/2020/2022 receipts matter with a hike 65% priced
- Growth for asymmetric upside: Rule Breakers’ 98.6% win rate for 10+ year holds was built by buying when growth stocks were hated. The innovation cycle favors it — but only for investors who can hold through a hike-driven de-rating
The S&P 500 closed August at ~7,686 (+13.1% YTD total return, per Slickcharts, within 1% of its 7,743 high), but the headline hides a 210-point winner-loser spread. The VIX at 14.92 looks calm; individual stocks are splitting by hundreds of points. CPI at 3.4% (core 2.5%) is sticky, and the 2-year yield at 4.34% sits above the Fed’s 3.50-3.75% target, pricing a possible hike.
The rest of the tape is steady: credit spreads at 2.60% show no systemic stress, ISM Manufacturing at 55.6 says the economy is expanding, and AAII bears sit at 44.4% — the crowd is positioned for trouble the index hasn’t delivered. Stock Advisor’s 978.9% total return was built through exactly these mixed-signal moments — and bear-market vintages historically match or beat bull-market ones (TraderHQ analysis of the published trade log, data as of Aug 31, 2026). The question is your time horizon.
Compare Stock Advisor vs Rule Breakers
But here’s what most comparisons miss: you’re not really choosing between two services. You’re choosing between standalone Stock Advisor at $99/year or the full Motley Fool Epic bundle at $299/year, which happens to include Rule Breakers alongside Stock Advisor and two other services. We cover both in detail in our Stock Advisor review and Epic bundle review.
That changes the math entirely.
Quick Comparison: Motley Fool Stock Advisor vs Rule Breakers
| Dimension | Stock Advisor | Rule Breakers | Edge |
|---|---|---|---|
| Track Record | +978.9% since 2002 | +311.9% since 2004 | Stock Advisor |
| S&P 500 Outperformance | ~4.5x | +126 pts | Stock Advisor |
| Price | $99/year (promo) | $299/year (Epic bundle) | Stock Advisor |
| Standalone Available? | Yes | No (Epic only) | Stock Advisor |
| Expected Volatility | 30-50% drawdowns | 50%+ drawdowns | Stock Advisor |
| 10+ Year Win Rate | 92.2% | 98.6% | Rule Breakers (transparency) |
| Target Portfolio | $25,000+ | $50,000+ | Stock Advisor (accessibility) |
| Methodology | Balanced growth | Aggressive disruptors | Tie (different approaches) |
| Overall Winner | — | — | Stock Advisor |
The numbers don’t lie: Stock Advisor has beaten the market by a wider margin, costs less, and doesn’t force you into a bundle. (Win rates count open winners as well as closed trades; returns are computed from each publisher’s published trade log — see the scorecard notes in each section below.) For most investors, the decision is straightforward.
Motley Fool Stock Advisor: The 24-Year Track Record
Motley Fool Stock Advisor is the original Motley Fool subscription—the service that built their reputation. Launched in 2002 by Tom and David Gardner, it’s now led by Chief Investment Officer Andy Cross and a team of analysts. For the full breakdown of features, pricing, and performance, see our Stock Advisor review.

Motley Fool Stock Advisor Performance
The Motley Fool · 526 picks · 25 years · Updated Aug 31, 2026
| SA Return | S&P 500 | Alpha | Win Rate |
|---|---|---|---|
| +979% | +214% | +765% | 66% |
S&P 500 shows what you'd have earned buying the index on each pick date instead. Same timing, fair comparison.
| SA Multi-Baggers | 10x+ | 5x+ | 3x+ | 2x+ |
|---|---|---|---|---|
| Count | 46 | 91 | 128 | 191 |
| SA Asymmetry | Avg Winner | Avg Loser | Ratio |
|---|---|---|---|
| Return | +1.7K% | -44% | ~38:1 |
Best Performers (All-Time)
| SA Pick | Return |
|---|---|
 DIS Disney | +6.1K% |
 NFLX Netflix | +44K% |
 BKNG Booking Holdings | +22K% |
 NVDA NVIDIA | +133K% |
 AAPL Apple | +6.5K% |
 AMZN Amazon | +35K% |
 TSLA Tesla | +16K% |
 SHOP Shopify | +4.6K% |
 CTAS CTAS | +4.6K% |
 MME.DL MME.DL | +4.3K% |
38:1 asymmetry. Winners average +1.7K%, losers average -44%. One winner offsets 38 complete losses—this is why selling winners early is costly.
See All Stock Advisor Recommendations →Latest Stock Advisor Picks
Tickers masked to protect subscriber value. Recent picks need 3-5+ years to demonstrate thesis.
| SA Pick | Return |
|---|---|
**** Cloud Monitoring | +97% |
**** Chip Manufacturer | +85% |
**** Infrastructure Construction | +63% |
**** Growth Company | +51% |
**** Growth Company | +41% |
**** E-commerce & Cloud Giant | +28% |
**** Growth Company | +23% |
**** Convenience Stores | +19% |
**** Growth Company | +18% |
**** Growth Company | +16% |
$10K → $108K. Following every recommendation since inception would yield a 10.8x return. Recent picks look small now, but compounding hasn't had time to work.
Stock Advisor Win Rate by Holding Period
| Hold Time | SA Win Rate | Avg Return |
|---|---|---|
| < 1 Year | 57.1% | +16% |
| 1-3 Years | 55.7% | +11% |
| 3-5 Years | 48.8% | +23% |
| 5-10 Years | 62.9% | +206% |
| 10+ Years | 92.2% | +4.1K% |
Time is the strategy. 10+ year picks show 92.2% win rate with +4.1K% average returns. Same methodology, same picks—time transforms the results.
Stock Advisor Performance by Year
| Year | SA Picks | Avg Return | Win Rate | |
|---|---|---|---|---|
| 2026 | 31 | +10% | 57% | DDOG+97% |
| 2025 | 26 | +7% | 48% | ASML+133% |
| 2024 | 25 | +25% | 67% | AMD+186% |
| 2023 | 25 | +78% | 73% | CRWD+607% |
| 2022 | 23 | +58% | 59% | NET+495% |
| 2021 | 22 | -13% | 32% | LRCX+491% |
| 2020 | 24 | +146% | 46% | TSLA+1.1K% |
| 2019 | 23 | +56% | 70% | SNPS+259% |
| 2018 | 19 | +228% | 68% | SHOP+1.1K% |
| 2017 | 22 | +700% | 86% | NVDA+8.4K% |
| 2016 | 20 | +446% | 80% | SHOP+4.6K% |
| 2015 | 22 | +208% | 68% | CASY+839% |
| 2014 | 20 | +354% | 80% | ATVI+2.8K% |
| 2013 | 17 | +386% | 65% | NFLX+2.5K% |
| 2012 | 23 | +1.2K% | 74% | TSLA+16K% |
| 2011 | 19 | +561% | 63% | AAPL+3.2K% |
| 2010 | 18 | +459% | 83% | AMZN+2.9K% |
| 2009 | 20 | +3.3K% | 90% | NVDA+56K% |
| 2008 | 18 | +1.2K% | 89% | AAPL+6.5K% |
| 2007 | 19 | +1.5K% | 37% | NFLX+29K% |
| 2006 | 20 | +2.5K% | 65% | NFLX+25K% |
| 2005 | 16 | +8.4K% | 63% | NVDA+133K% |
| 2004 | 17 | +6.0K% | 59% | NFLX+44K% |
| 2003 | 17 | +229% | 65% | PHIN+1.4K% |
| 2002 | 16 | +3.2K% | 81% | AMZN+35K% |
Inside Stock Advisor
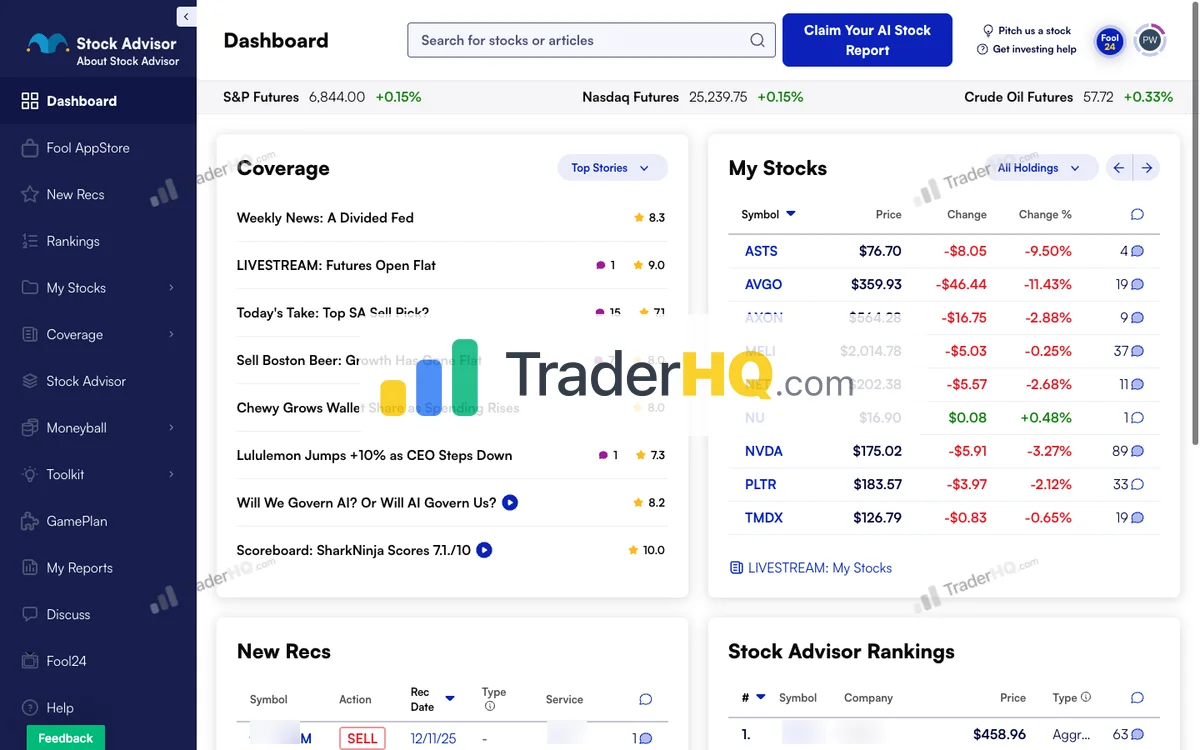
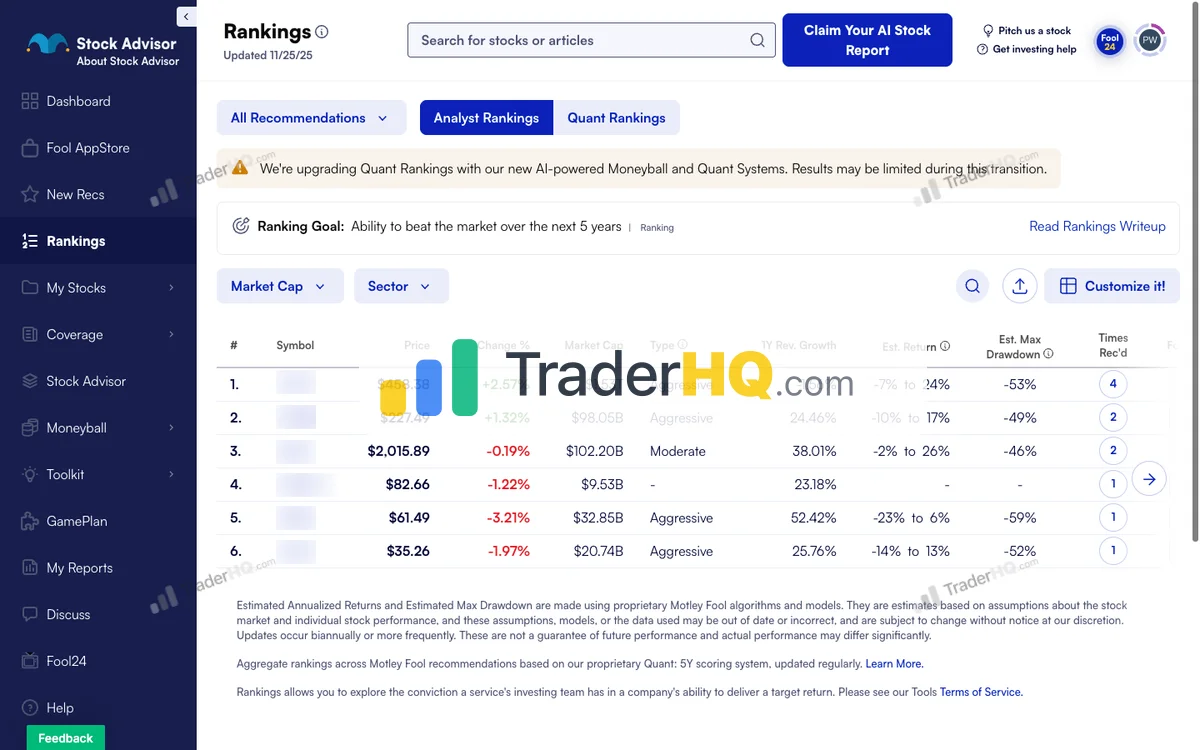
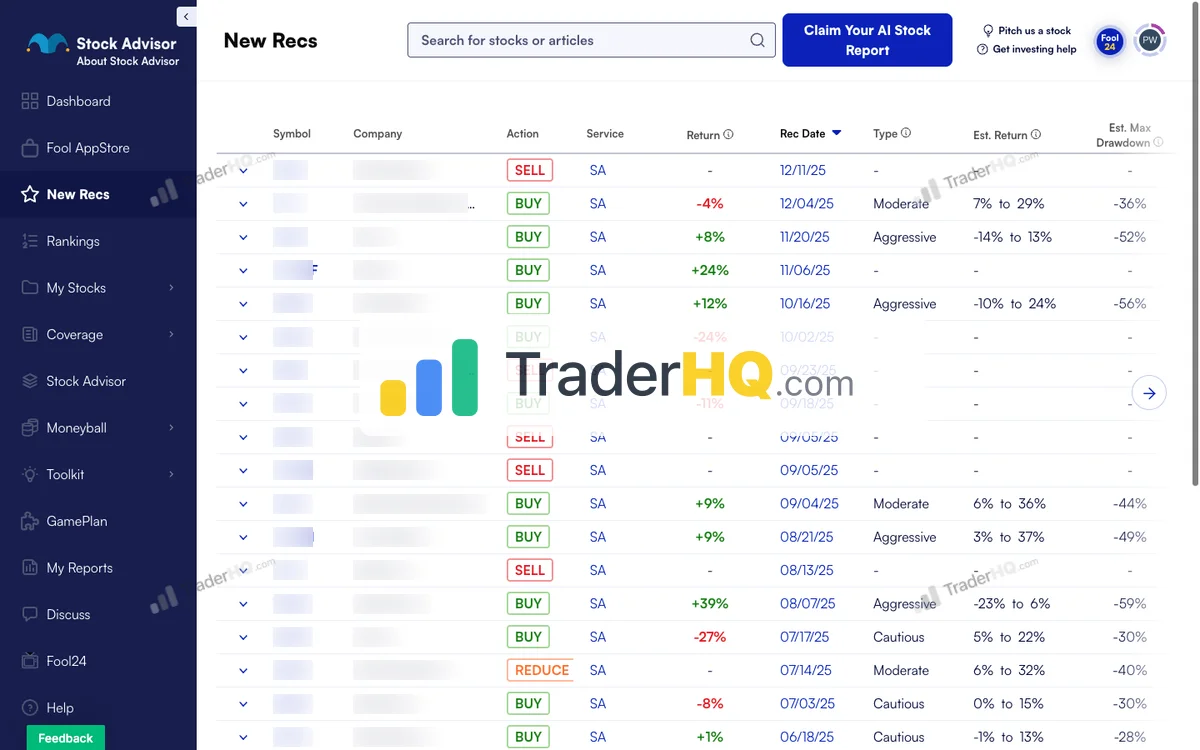
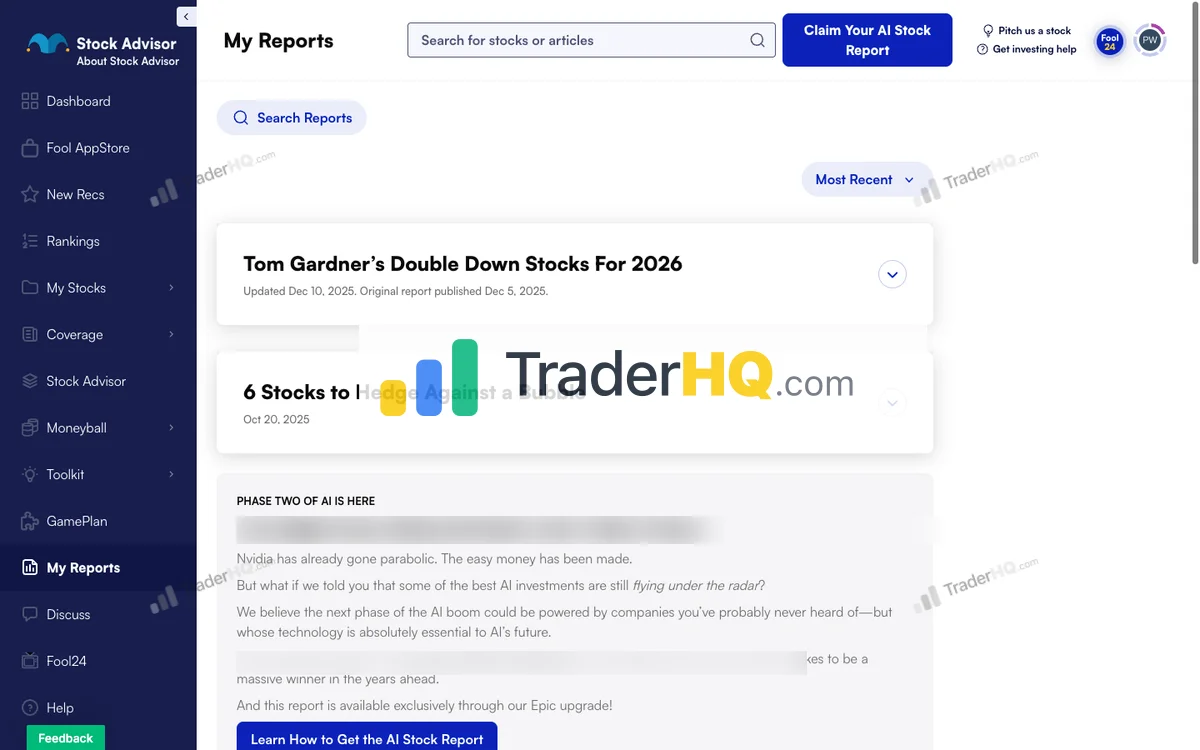
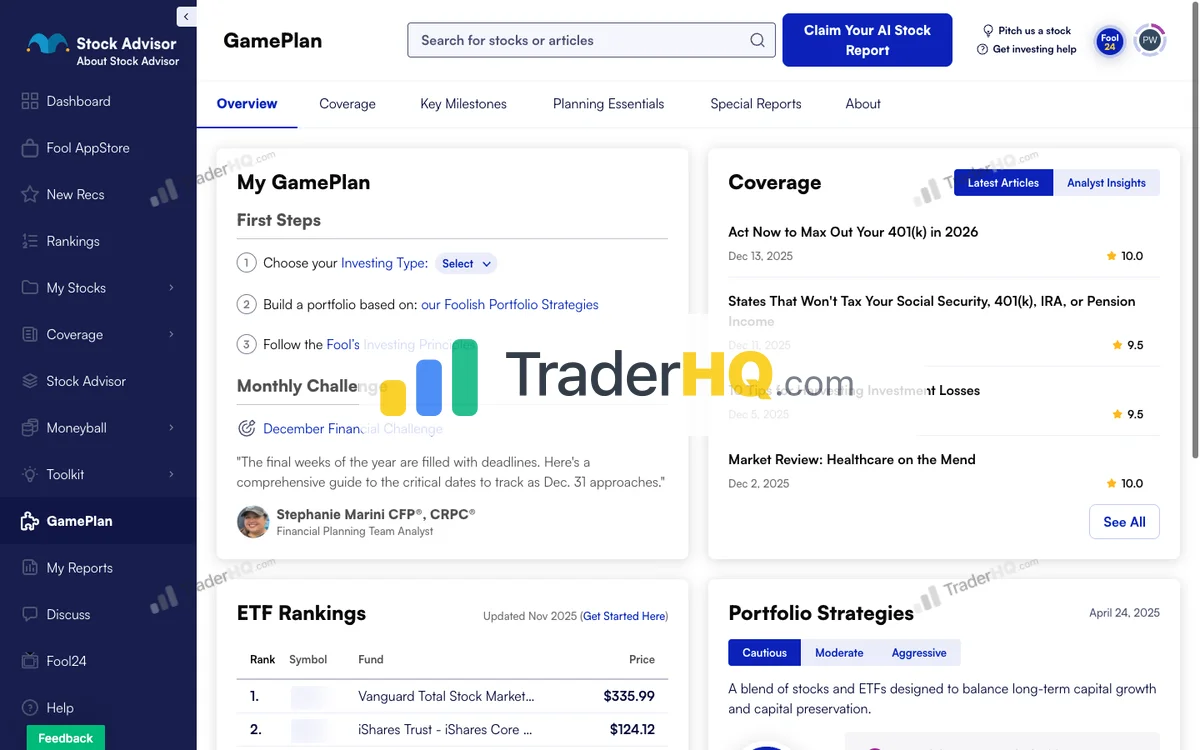
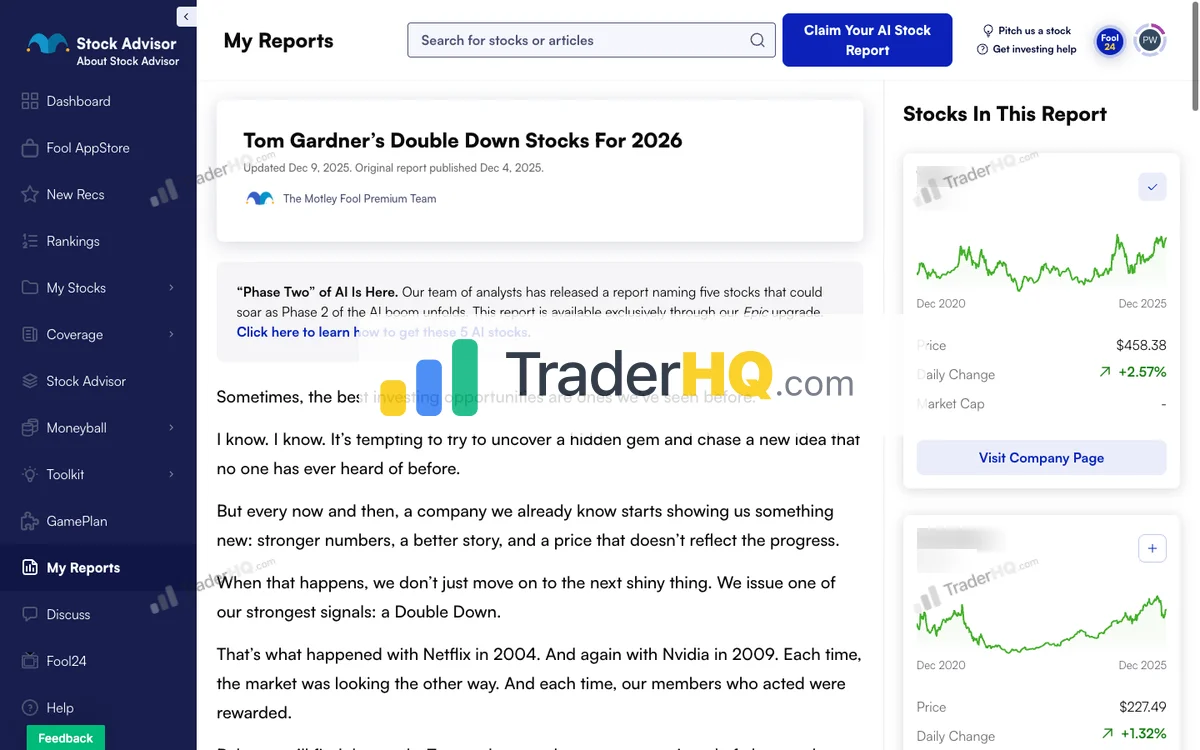
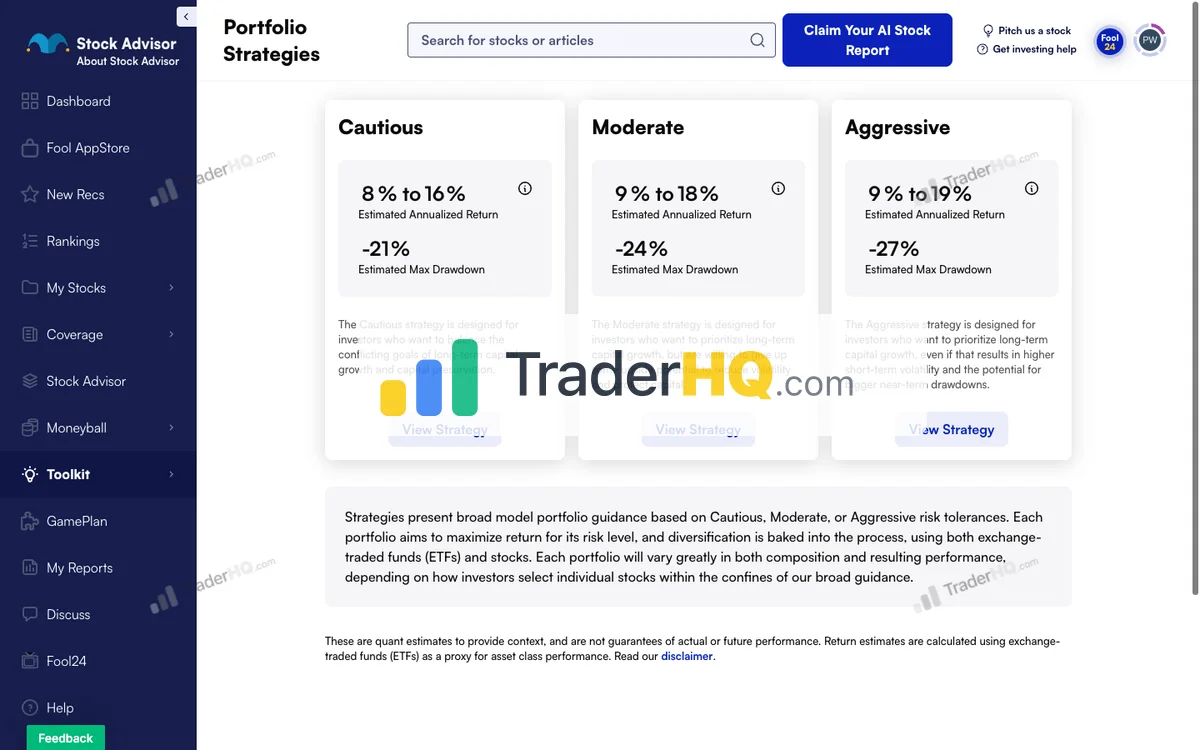
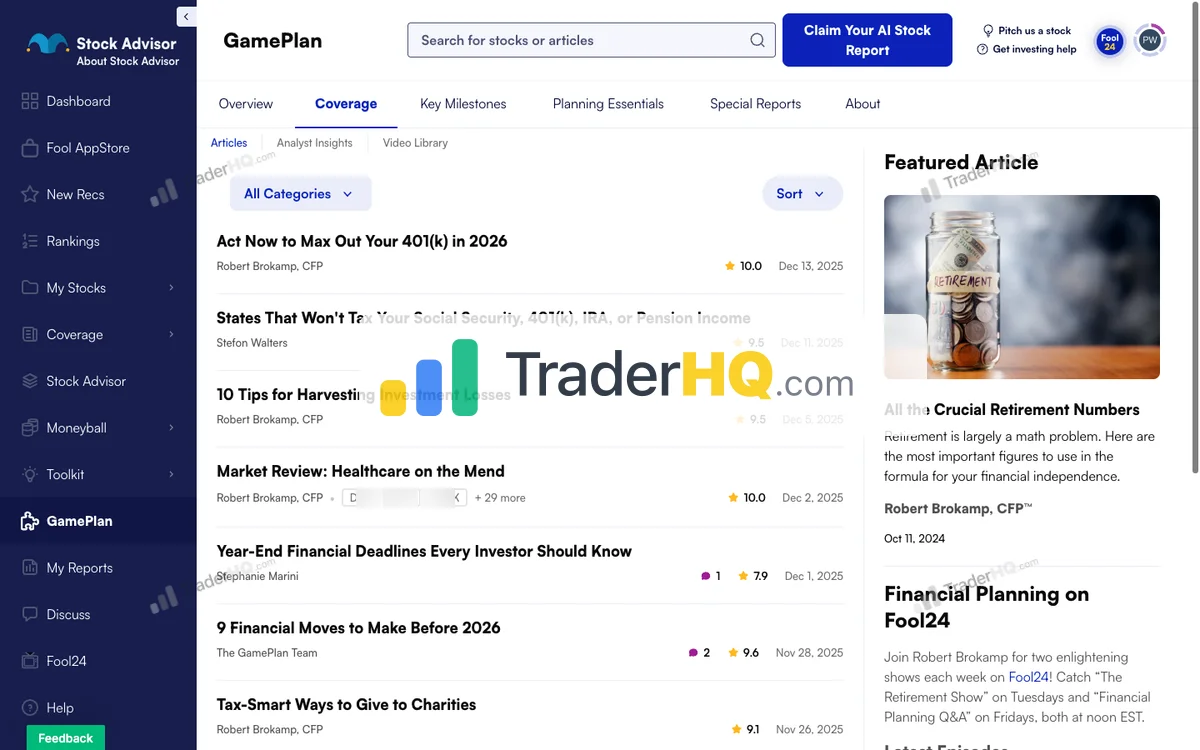
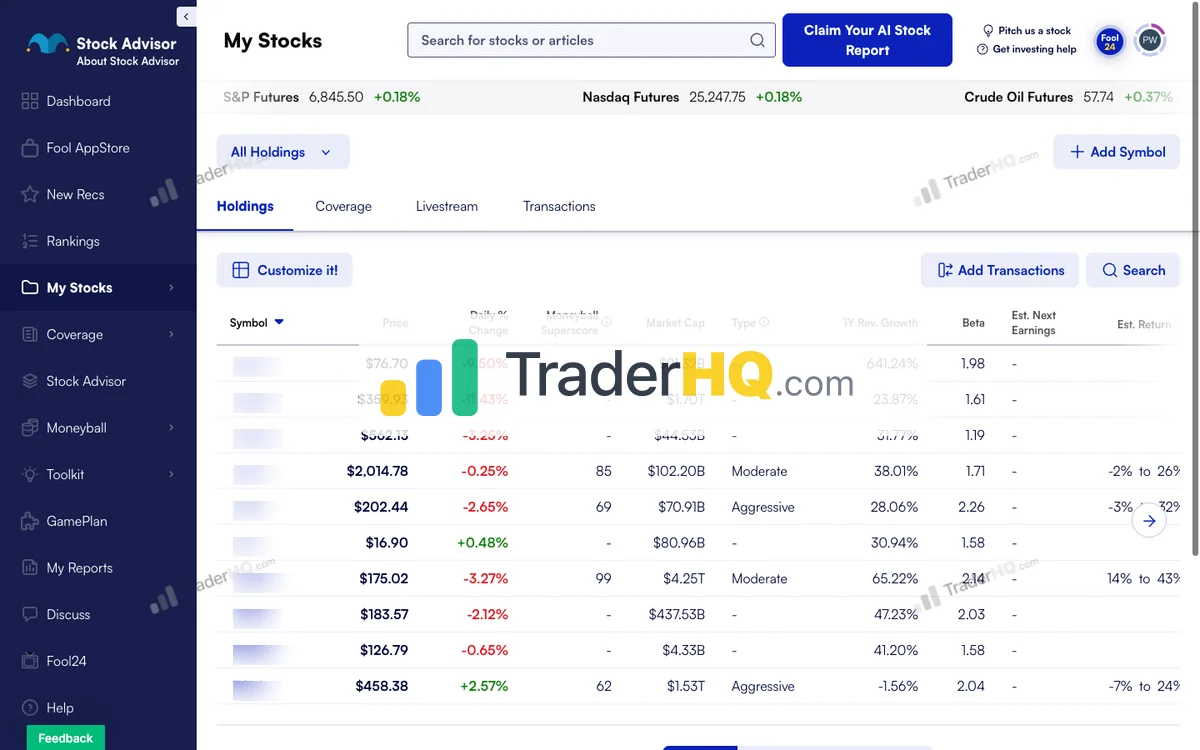
9 screenshots · Click to expand
The philosophy is deceptively simple: find companies with durable competitive advantages, buy them, and hold for years while the market catches up to their value.
The Numbers That Matter
Since 2002, Stock Advisor picks have returned +978.9% compared to the S&P 500’s +214% over the same period (measured as the average return per pick’s holding period). That’s roughly 4.5x outperformance—put another way, $10,000 invested following their picks would be worth roughly $107,886 today (TraderHQ analysis of the published trade log, 526 positions, data as of Aug 31, 2026).
How we computed this — and what it can’t tell you: Returns are computed from the publisher’s own published trade log and entry prices, and confirmed to match the publisher’s aggregate figures. This is official-computed analysis, not a third-party audit — entry prices were not independently verified. Known gaps: 4 positions lack entry dates, sector data covers only 4% of positions, and the headline is tail-driven: the typical (median) pick returned +42.4%, and even excluding the top 5% of picks the average is +160.8%. The NVDA position recommended in April 2005 is up more than 133,000% in 21+ years; the worst pick ever (SIVB.Q) lost -99.3%. Past performance does not guarantee future results.
Their record vs. your record: A service’s published record belongs to the picks; your record belongs to your entries, your exits, and your temperament. The distance between those two numbers is where almost all subscriber disappointment lives.
The win rate tells the story of patience: 66% overall, improving to 92.2% for positions held 10+ years. They’ve generated 46 ten-baggers and 191 doublers across 526 positions—the kind of asymmetric wins that justify long-term holding. The average winner is up +1,701.7%; the average loser is down -44.5%.
But those headline numbers hide real volatility. Stock Advisor’s portfolio dropped 40% in 2022 while the S&P fell 18%. Their biggest winners—Netflix, Amazon, Nvidia—have all seen 50%+ drawdowns at various points. The strategy works if you can hold through the pain. Most people can’t.
What You Actually Get
- 2 new stock picks per month — Each with a detailed investment thesis
- Foundational Stocks list — 10 highest-conviction core holdings, updated regularly
- Three portfolio strategies — Cautious, Moderate, and Aggressive frameworks calibrated to different risk tolerances
- Moneyball database — Quantitative projections for independent research
- Full scorecard — Every pick since 2002, wins and losses, completely transparent
The Strengths
- Proven track record — 24 years of verifiable, market-beating performance
- Standalone availability — $99/year (promo, renews at $199) or bundle it with Epic. Judge any subscription by year two, not year one. Intro prices are marketing; the renewal price is the product. Convert every offer into its steady-state annual cost, and set the calendar reminder before the jump arrives.
- Lower volatility — Still volatile (30-50% drawdowns), but more moderate than Rule Breakers
- Complete framework — Not just picks, but a system for building a portfolio
The Limitations
- Requires 5+ year holding period — This isn’t a suggestion; it’s the entire strategy
- 2020-2021 vintage struggled — Recent picks faced brutal drawdowns
- Upsell pressure — Constant promotion of Epic, Epic Plus, and higher tiers
- Not for active traders — If you want to trade around positions, look elsewhere
Best For
Patient investors with 5+ year horizons, $25K+ portfolios, who can hold through 30-50% drawdowns and want a framework for building wealth—not just stock tips.
Try Stock Advisor — 30-Day Money-Back Guarantee
Rule Breakers: The Aggressive Growth Play
Motley Fool Rule Breakers is the growth-hunting arm of the Motley Fool ecosystem. Launched in 2004, it targets disruptive innovators before they become obvious—the companies breaking rules in their industries.

Motley Fool Rule Breakers Performance
The Motley Fool · 217 picks · 22 years · Updated 2026-08-19
| RB Return | S&P 500 | Alpha | Win Rate |
|---|---|---|---|
| +312% | +186% | +126% | 74% |
S&P 500 shows what you'd have earned buying the index on each pick date instead. Same timing, fair comparison.
| RB Multi-Baggers | 10x+ | 5x+ | 3x+ | 2x+ |
|---|---|---|---|---|
| Count | 37 | 65 | 90 | 105 |
| RB Asymmetry | Avg Winner | Avg Loser | Ratio |
|---|---|---|---|
| Return | +918% | -36% | ~25:1 |
Best Performers (All-Time)
| RB Pick | Return |
|---|---|
 ISRG Intuitive Surgical | +7.9K% |
 VRTX Vertex Pharma | +4.8K% |
 ANET Arista Networks | +4.3K% |
 PANW Palo Alto Networks | +3.2K% |
TSLA Tesla | +16K% |
 GOOGL Alphabet (Google) | +3.1K% |
 MNST MNST | +3.2K% |
 MELI MercadoLibre | +13K% |
SHOP Shopify | +7.0K% |
 AVGO Broadcom | +3.2K% |
The multi-bagger pipeline. 105 doublers → 65 5-baggers → 37 10-baggers. About 35% of doublers become 10-baggers with enough time.
See All Rule Breakers Recommendations →Latest Rule Breakers Picks
Tickers masked to protect subscriber value. Recent picks need 3-5+ years to demonstrate thesis.
| RB Pick | Return |
|---|---|
**** Life Sciences Software | +42% |
**** Growth Company | +21% |
**** Growth Company | +17% |
**** Growth Company | +14% |
**** Growth Company | +6% |
**** Social Platform | -11% |
**** Growth Company | -12% |
**** RNA Therapeutics | -18% |
**** Growth Company | -34% |
**** Growth Company | -34% |
Early results mislead. < 1 year: 41.7% win rate. 10+ years: 98.6%. That 57-point gap explains why judging picks early leads to selling future winners.
Rule Breakers Win Rate by Holding Period
| Hold Time | RB Win Rate | Avg Return |
|---|---|---|
| < 1 Year | 41.7% | -7% |
| 1-3 Years | 61.3% | +47% |
| 3-5 Years | 55.3% | +60% |
| 5-10 Years | 69.8% | +212% |
| 10+ Years | 98.6% | +1.8K% |
The 5-10 year sweet spot. 69.8% win rate, +212% average returns. Long enough for thesis to play out, recent enough to reflect current dynamics.
Rule Breakers Performance by Year
| Year | RB Picks | Avg Return | Win Rate | |
|---|---|---|---|---|
| 2026 | 9 | +2% | 63% | VEEV+42% |
| 2025 | 12 | +1% | 42% | BBIO+99% |
| 2024 | 16 | +63% | 69% | GH+430% |
| 2023 | 19 | +69% | 58% | CRWD+647% |
| 2022 | 19 | +75% | 63% | ANET+678% |
| 2021 | 16 | +39% | 44% | CRWD+210% |
| 2020 | 13 | -16% | 31% | ISRG+100% |
| 2019 | 14 | +118% | 64% | DDOG+661% |
| 2018 | 13 | +403% | 92% | AXON+1.3K% |
| 2017 | 9 | +387% | 89% | TWLO+687% |
| 2016 | 14 | +1.4K% | 100% | SHOP+7.0K% |
| 2015 | 5 | +652% | 80% | AXON+2.5K% |
| 2014 | 11 | +1.1K% | 100% | ANET+4.3K% |
| 2013 | 8 | +456% | 100% | AX+912% |
| 2012 | 8 | +1.4K% | 100% | META+2.4K% |
| 2011 | 4 | +4.5K% | 100% | TSLA+16K% |
| 2010 | 2 | +323% | 100% | OLED+423% |
| 2009 | 7 | +3.4K% | 100% | MELI+13K% |
| 2008 | 4 | +1.6K% | 100% | ISRG+2.8K% |
| 2007 | 7 | +1.1K% | 100% | CMG+2.7K% |
| 2006 | 1 | +3.3K% | 100% | ISRG+3.3K% |
| 2005 | 6 | +3.4K% | 100% | ISRG+7.9K% |
Here’s the critical detail most comparisons bury: Rule Breakers is not available as a standalone service. You must purchase the Epic bundle at $299/year (new members, $499 regular) to access it. That bundle includes Stock Advisor, Rule Breakers, Hidden Gems, and Dividend Investor. Learn more in our Epic bundle review.
The Numbers That Matter
Since 2004, Rule Breakers picks have returned +311.9% compared to the S&P 500’s +186% over the same period (per-pick holding-period average). That’s a +126-point outperformance—meaningful, but notably less than Stock Advisor’s (TraderHQ analysis of the published trade log, 217 positions, data as of Aug 19, 2026).
How we computed this — and what it can’t tell you: Same method as above: returns computed from the publisher’s published trade log, confirmed against the publisher’s aggregate figures, not a third-party audit. Two gaps matter more here than for Stock Advisor: all 217 positions are still open, so these are unrealized marks, not a final record — and the long-term cohorts reflect a small, highly seasoned subset. Position-level texture: TSLA (rec. Nov 2011) is up +16,083%; MELI (rec. Feb 2009) +12,553%; the worst pick, UPST, lost -91.2%. The median pick is up +94.6% — the typical experience isn’t just TSLA and MELI. Past performance does not guarantee future results.
Where Rule Breakers shines is in its transparency about time horizons:
| Holding Period | Win Rate | Average Return |
|---|---|---|
| < 1 Year | 41.7% | -7% |
| 1-3 Years | 61.3% | +46.8% |
| 5-10 Years | 69.8% | +211.8% |
| 10+ Years | 98.6% | +1,775.1% |
Base rates before highlights: Any winning number travels with its whole book: loser share, average loss, and the counting method — closed trades or open — stated in the same sentence. A highlight without its denominator is marketing, not evidence. So, in one sentence: the 98.6% win rate counts open winners, the overall win rate is 74%, 26% of picks lose, and the average loss is -36% against an average winner of +917.5%.
That 98.6% win rate at 10+ years is remarkable—but it requires a decade of patience that few investors actually have. Note too that the first five years of a typical pick have historically underperformed the S&P 500; the edge emerges only after year five.
The Asymmetric Math
Rule Breakers explicitly embraces asymmetry: winners average +917.5%, losers average -36%. The asymmetry is massive. Even if you pick more losers than winners in any given year, the math still works over time.
The catch? You need to hold long enough for the winners to run. Sell early, and you’re left with the losers.
What You Actually Get (via Epic Bundle)
- 2 new Rule Breakers picks per month — Focused on disruptive innovators
- Access to 3 other scorecards — Stock Advisor, Hidden Gems, Dividend Investor
- 217 active positions — Full historical scorecard
- Moneyball quant scoring — Sophisticated ranking system for all positions
- 30-day money-back guarantee — On the Epic bundle
The Strengths
- Explicit time horizon data — They show you exactly how patience pays
- Massive asymmetric math — Winners avg +917.5% vs losers avg -36%
- Bundle value — If you want multiple scorecards, Epic is efficient
- Disruptor focus — Access to high-growth innovators before they’re obvious
The Limitations
- No standalone option — Must buy $299+ Epic bundle
- Extreme volatility — 50%+ drawdowns are normal; some positions down 80-90%
- 2020-2021 vintage brutal — The 2020 vintage averaged -16% with a 31% win rate (TraderHQ analysis of the published trade log, data as of Aug 19, 2026)
- David Gardner no longer picks stocks — He stepped back in May 2021; the analyst team now makes all recommendations
- Higher portfolio requirement — $50K+ recommended to properly diversify
Best For
Aggressive investors with genuine 10+ year time horizons, $50K+ portfolios, who can stomach 50%+ drawdowns and want exposure to disruptive innovators before they become household names.
Explore Epic Bundle — Includes Rule Breakers + Stock Advisor
Head-to-Head: The Key Differences
Both services pick growth stocks. Both have long track records. Both are from the same company. So what actually separates them?
Difference #1: Risk Profile
Stock Advisor targets balanced growth—companies with competitive advantages that can compound steadily. Rule Breakers targets aggressive disruption—companies breaking rules in their industries, often before profitability.
The result: Rule Breakers is significantly more volatile. Expect 50%+ drawdowns on individual positions, with some down 80-90% before (potentially) recovering. Stock Advisor’s 30-50% drawdowns feel tame by comparison.
If you’ve never held a position down 70% while the thesis remains intact, you don’t know if you can do it. Most people discover they can’t.
Difference #2: Track Record Depth
Stock Advisor has 24 years of data. Rule Breakers has 22 years. But the performance gap is significant:
- Stock Advisor: +978.9% vs S&P’s +214% (roughly 4.5x outperformance), 66% win rate (92.2% for 10+ years), 46 ten-baggers, 526 positions
- Rule Breakers: +311.9% vs S&P’s +186% (+126 points outperformance), 98.6% win rate for 10+ years, 37 ten-baggers, 217 positions, 74% overall win rate
Stock Advisor has simply beaten the market by more, over a longer period. That’s not a knock on Rule Breakers—a +126-point edge over the S&P is excellent—but the comparison is clear. Notably, Rule Breakers’ 98.6% win rate for 10+ year holds edges past Stock Advisor’s 92.2%, suggesting that for the most patient investors, Rule Breakers’ disruptive bets pay off at an even higher rate. (All figures: TraderHQ analysis of the published trade logs — Stock Advisor data as of Aug 31, 2026; Rule Breakers data as of Aug 19, 2026. Win rates count open winners; not third-party audits.)
Difference #3: Availability and Pricing
This is the decisive factor for many investors:
| Service | Standalone Price | Bundle Required? |
|---|---|---|
| Stock Advisor | $99/year (promo) | No |
| Rule Breakers | N/A | Yes (Epic at $299/year) |
If you only want one Motley Fool service, Stock Advisor is your only option. Rule Breakers forces you into a $299+ commitment that includes three other services you may or may not want. See our Epic bundle review for a full breakdown of what’s included.
Difference #4: Time Horizon Requirements
Both services preach patience, but Rule Breakers requires more patience:
- Stock Advisor: 5+ year holding period recommended
- Rule Breakers: 10+ years for the 98% win rate
Rule Breakers’ first-year picks mostly start underwater (41.7% win rate, -7% average return). The edge only emerges with time. If you’re not genuinely planning to hold for a decade, the 98.6% win rate and 37 ten-baggers won’t materialize for you.
The Decision Framework
Stop asking “which is better?” Start asking “which is right for me?”
Choose Stock Advisor If You:
- Want to start with Motley Fool and prefer simplicity
- Have a $25K+ portfolio but not $50K+
- Prefer lower volatility (30-50% drawdowns vs 50%+)
- Want a standalone service without bundling
- Have a 5+ year horizon (not necessarily 10+)
- Are cost-conscious ($99 vs $299)
Choose Rule Breakers (Epic Bundle) If You:
- Want multiple Motley Fool scorecards (Stock Advisor + Rule Breakers + Hidden Gems + Dividend Investor)
- Have $50K+ to deploy across aggressive positions
- Can genuinely hold through 50%+ drawdowns without panic selling
- Have a 10+ year time horizon
- Want exposure to disruptive innovators before they’re obvious
- See the bundle as value, not forced upselling
Either Works If You:
- Will actually follow the recommendations (the biggest variable is you, not the service)
- Understand that 35%+ of picks from any service will lose money
- Are adding this as one input to your process, not your entire strategy
- Can resist the urge to sell during drawdowns
The Tiebreaker
Still stuck? Ask yourself: “Would I hold through a 70% drop on a single position?”
If that makes you queasy, Stock Advisor. If you can genuinely do it, Rule Breakers might suit your temperament—but you’ll need to buy the Epic bundle to find out.
The Real Question: Is Epic Worth It?
Since Rule Breakers requires the Epic bundle, the real decision is often: Stock Advisor alone ($99) or Epic ($299)?
Here’s the math:
| Option | Price | What You Get |
|---|---|---|
| Stock Advisor alone | $99/year | 1 scorecard |
| Epic bundle | $299/year | 4 scorecards (Stock Advisor + Rule Breakers + Hidden Gems + Dividend Investor) |
That’s roughly $75 per scorecard in Epic vs $99 for Stock Advisor alone. If you’ll use multiple scorecards, Epic is better value. If you only want Stock Advisor, the bundle is overpaying for services you won’t use.
The honest answer: Most investors should start with Stock Advisor alone. If you find yourself wanting more after a year, upgrade to Epic then. Starting with the bundle because Rule Breakers sounds exciting usually leads to paying for services you ignore.
Start with Stock Advisor — Upgrade to Epic Later If Needed
The Bottom Line
Stock Advisor wins for most investors. The 24-year track record is stronger (+978.9% vs +311.9%), the 66% win rate improves to 92.2% for decade-long holds, the price is lower ($99 first year vs $299 for Epic — and Stock Advisor’s renewal at $199 is published plainly), the volatility is more manageable (30-50% vs 50%+), and you can actually buy it standalone. In the market as of Aug 31, 2026 — the S&P 500 at ~7,686 (+13.1% YTD total return, within 1% of its high), a 210-point spread between the average top-20 (+168.7%) and bottom-20 (-41.6%) stock — Stock Advisor’s quality GARP approach is precisely what this environment rewards. CPI at 3.4% is sticky, but the dispersion engine is what matters: stock selection, not index beta, is where 2026’s returns live.
Rule Breakers is the smarter choice if you want the full Epic ecosystem, have $50K+ to deploy, can hold through extreme volatility, and have a genuine 10+ year horizon. The 98.6% win rate at 10+ years and 37 ten-baggers are real — but so is the requirement to actually hold that long. Here’s the honest 2026 read: the innovation cycle (memory/HBM, mRNA oncology) is squarely Rule Breakers territory, and beaten-down enterprise software (INTU -45.8%) is historically the entry set that produces the best decade returns. But a September Fed hike is ~65% priced, and high-duration growth de-rates hardest when the discount rate jumps. The headwinds aren’t easing like they were in the spring — they’re repricing. With Rule Breakers’ 74% overall win rate and 105 doublers across 217 positions (all still open, TraderHQ analysis of the published trade log, data as of Aug 19, 2026), the methodology’s track record of buying during pessimism is well-documented — and it demands the patience this exact market will test.
The question isn’t which service is “better.” It’s which one you’ll actually use. A mediocre service you follow beats a great service you ignore.
If I had to pick one for a friend who’s never subscribed to a stock-picking service? Stock Advisor, because the lower volatility and standalone availability make it easier to build the habits that matter. Rule Breakers is for investors who’ve already proven they can hold through pain.
For a broader look at all your options, explore our guide to the best stock advisors. Considering other comparison angles? See our Rule Breakers vs Morningstar Investor or Rule Breakers vs Seeking Alpha Premium deep dives.
Try Stock Advisor — $99/Year, 30-Day Guarantee
Frequently Asked Questions
Rule Breakers vs Stock Advisor: Which is better?
Stock Advisor wins for most investors—especially in the current selection market. It has a stronger track record (+978.9% vs +311.9%), 46 ten-baggers, costs less ($99/year first year vs $299/year for Epic), and is available standalone.
The market as of Aug 31, 2026 makes the case clearly:
- Selection is the whole game: The S&P 500 sits at ~7,686 (+13.1% YTD total return), but a 210-point dispersion gap (top 20 at +168.7%, bottom 20 at -41.6%, Slickcharts) means stock selection is the whole game. Memory/storage, refiners, cybersecurity, and biotech lead; enterprise software (INTU -45.8%) lags. Stock Advisor’s GARP methodology thrives in this environment
- The rate risk is the catch for growth: The Fed is holding at 3.50-3.75% with ~60-65% September hike odds after Jackson Hole (Aug 28). High-duration growth de-rates hardest in a hike — that’s the headwind on Rule Breakers
- The contrarian case still exists: Beaten-down software names are historically the exact setup that precedes strong 10-year returns. Rule Breakers’ 98.6% win rate for 10+ year holds was built by buying during exactly this kind of growth compression — for investors with genuine decade-plus patience
In a 210-point dispersion market, stock selection matters enormously. Choose Stock Advisor for safety and proven through-cycle returns. Choose Rule Breakers (via Epic) if you have a genuine 10+ year horizon and want to position in beaten-down growth through the hike risk.
Is Motley Fool Stock Advisor worth it?
Yes, for long-term investors who can hold 5+ years. At $99/year (promotional price, renews at $199), Stock Advisor has returned +978.9% since 2002 compared to the S&P 500’s +214% (per-pick holding-period average). The 66% overall win rate improves to 92.2% for 10+ year holds, with 46 ten-baggers and 191 doublers generated across 526 positions (TraderHQ analysis of the published trade log, data as of Aug 31, 2026 — official-computed, not a third-party audit). The math works if you follow the strategy—patience lets the winners compensate. The 30-day money-back guarantee lets you evaluate risk-free. See our full Stock Advisor review for detailed analysis.
Is Motley Fool Rule Breakers worth it?
For aggressive investors with 10+ year horizons, yes—but understand the tradeoffs. Rule Breakers has returned +311.9% since 2004 (vs S&P 500’s +186%, per-pick holding-period average), with a remarkable 98.6% win rate on picks held 10+ years and a 74% overall win rate across 217 positions (TraderHQ analysis of the published trade log, data as of Aug 19, 2026 — all positions still open, so these are unrealized marks). However, it’s only available through the Epic bundle ($299/year), volatility is extreme (50%+ drawdowns common), and first-year picks mostly start underwater (41.7% win rate, -7% average). The honest 2026 read: the innovation cycle favors it, but a ~65%-priced September hike is a genuine headwind for high-duration growth. It’s worth it if you’ll actually hold that long. Learn more in our Epic bundle review.
Can I subscribe to Rule Breakers without Stock Advisor?
No. Rule Breakers is not available as a standalone service. You must purchase the Motley Fool Epic bundle ($299/year for new members, $499/year regular), which includes Stock Advisor, Rule Breakers, Hidden Gems, and Dividend Investor. If you only want Rule Breakers, you’re forced to pay for three additional services.
Should I get Stock Advisor or Epic?
Start with Stock Advisor alone ($99/year) unless you’re certain you want multiple scorecards. Epic ($299/year) includes four services—Stock Advisor, Rule Breakers, Hidden Gems, and Dividend Investor—making it roughly $75 per scorecard. That’s good value if you’ll use them all, but most beginners should prove they can follow one service before adding complexity. See our Epic bundle review for a detailed breakdown. Upgrade to Epic after a year if you want more.
Which is better in 2026’s market: Rule Breakers or Stock Advisor?
Stock Advisor retains the near-term edge; Rule Breakers carries more rate risk. The S&P 500 sits at ~7,686 (+13.1% YTD total return, within 1% of its high), and a 210-point dispersion spread separates winners (top 20 at +168.7%) from losers (bottom 20 at -41.6%). Memory/storage (SNDK +560%), refiners, and cybersecurity lead; enterprise software (INTU -45.8%) lags. Stock Advisor’s quality GARP approach thrives in this rotation — and with ~60-65% September hike odds after Jackson Hole, its 2008/2020/2022 receipts matter. That same hike risk is the drag on Rule Breakers: high-duration growth de-rates hardest when the discount rate jumps. For Stock Advisor: proven through-cycle quality in a high-dispersion market. For Rule Breakers: beaten-down growth entry points and a 98.6% win rate for 10+ year holds — for investors who can sit through the repricing.
Can I use both Rule Breakers and Stock Advisor together?
Yes — and if you want Rule Breakers, you automatically get both. Rule Breakers is only available through the Epic bundle ($299/year), which includes Stock Advisor. Many investors use Stock Advisor as the portfolio foundation (quality GARP compounders, 978.9% total return, 46 ten-baggers) and Rule Breakers as the growth accelerator (disruptive innovators, 311.9% total return, 37 ten-baggers) — both figures from TraderHQ analysis of the published trade logs (data as of Aug 31 and Aug 19, 2026, respectively). In 2026’s 210-point dispersion market — with a possible September hike repricing growth — Stock Advisor picks provide stability while Rule Breakers positions offer asymmetric upside for investors with decade-plus patience. The services are designed to complement each other — Stock Advisor builds the base, Rule Breakers adds the moonshots.
Does David Gardner still pick stocks for Rule Breakers?
No. David Gardner stepped back from active stock picking in May 2021. The Rule Breakers analyst team now makes all recommendations using his methodology and criteria. The same is true for Stock Advisor—Tom Gardner has limited involvement, with Andy Cross (Chief Investment Officer) leading the team. Neither service is “the Gardner brothers’ picks” anymore.