

You’re down to two options: Motley Fool Epic Plus and Alpha Picks by Seeking Alpha. One is a $1,999/year premium platform with 8+ monthly picks, AI-powered tools, options strategies, and daily stock recommendations. The other is a $449/year quant algorithm that has returned +348% since 2022 with every position fully documented.
Both promise to beat the market. Both target investors with serious portfolios. Both come from established financial platforms.
Why this comparison matters now: The S&P 500 closed August at 7,686, up 13.1% YTD, but the 210-point dispersion spread underneath rewards precision — top 20 stocks averaging +168.7% while the bottom 20 sit at -41.6% (Slickcharts, Aug 31, 2026). Both services aim to capture that spread, but through fundamentally different mechanisms.
Alpha Picks’ quant model — momentum is one of its five factors — faces a VIX near 15 and a Fed holding at 3.50-3.75% with September hike odds around 65% (CME FedWatch via CNBC). Epic Plus’s analyst + AI hybrid has the breadth to pivot across the rotation: energy +38.4%, materials +20.4%, memory chips leading tech’s +24.1%, while enterprise software and ad-tech names fell 20-64% (Finviz, Aug 31, 2026). With CAPE near ~41 and credit spreads at 2.60%, both approaches have a credible path to alpha — the question is which mechanism matches your investing DNA.
Seeking Alpha Alpha Picks is the better choice for most investors. The verified +348% return since July 2022 (TraderHQ analysis of the published trade log, data as of September 1, 2026), the 66% win rate, and the 77% lower price point make it the stronger value proposition. Motley Fool Epic Plus offers a genuinely impressive investing ecosystem, but it cannot document that its premium price produces premium results. The question is whether you’re paying for performance or paying for a platform.
Motley Fool Epic Plus vs Seeking Alpha Alpha Picks at a Glance
| Dimension | Motley Fool Epic Plus | Alpha Picks | Edge |
|---|---|---|---|
| Price | $1,999/year | $449/year | Alpha Picks |
| Verified Performance | No Epic Plus-specific data | +348% since July 2022 | Alpha Picks |
| Picks Per Month | 8+ (plus daily Moneyball) | 2 | Motley Fool Epic Plus |
| Methodology | Analyst + AI hybrid, 7 scorecards | Pure quant (5 factors) | Tie |
| Win Rate | N/A (no composite data) | 66% | Alpha Picks |
| Target Portfolio | $100,000+ | $10,000+ | Alpha Picks |
| Refund Policy | Credit swap only (no cash refund) | No refunds | Tie (both poor) |
| Overall Winner | — | — | Alpha Picks (for most) |
Seeking Alpha Alpha Picks: The Verified Track Record
Seeking Alpha Alpha Picks is a pure quant stock-picking service. No human discretion. No analyst narratives. Every month on the 1st and 15th, the model scans U.S. equities and selects the two highest-scoring stocks based on five factors: Value, Growth, Profitability, Momentum, and EPS Revisions.
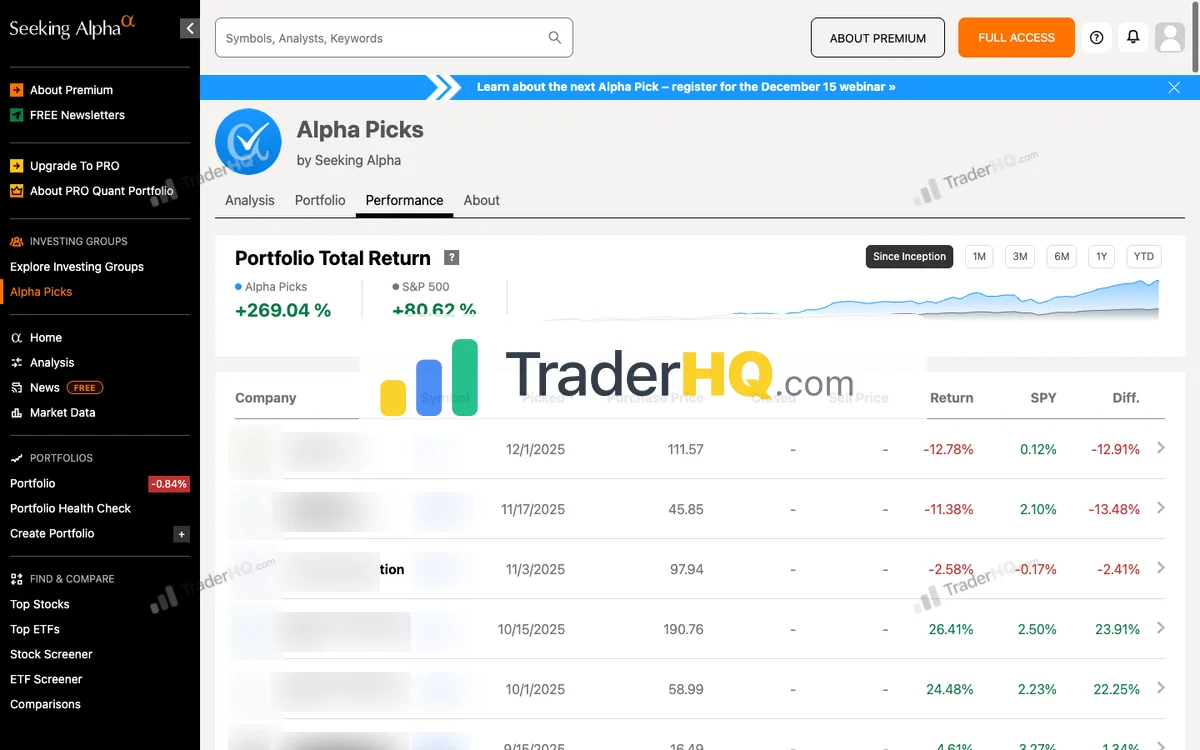
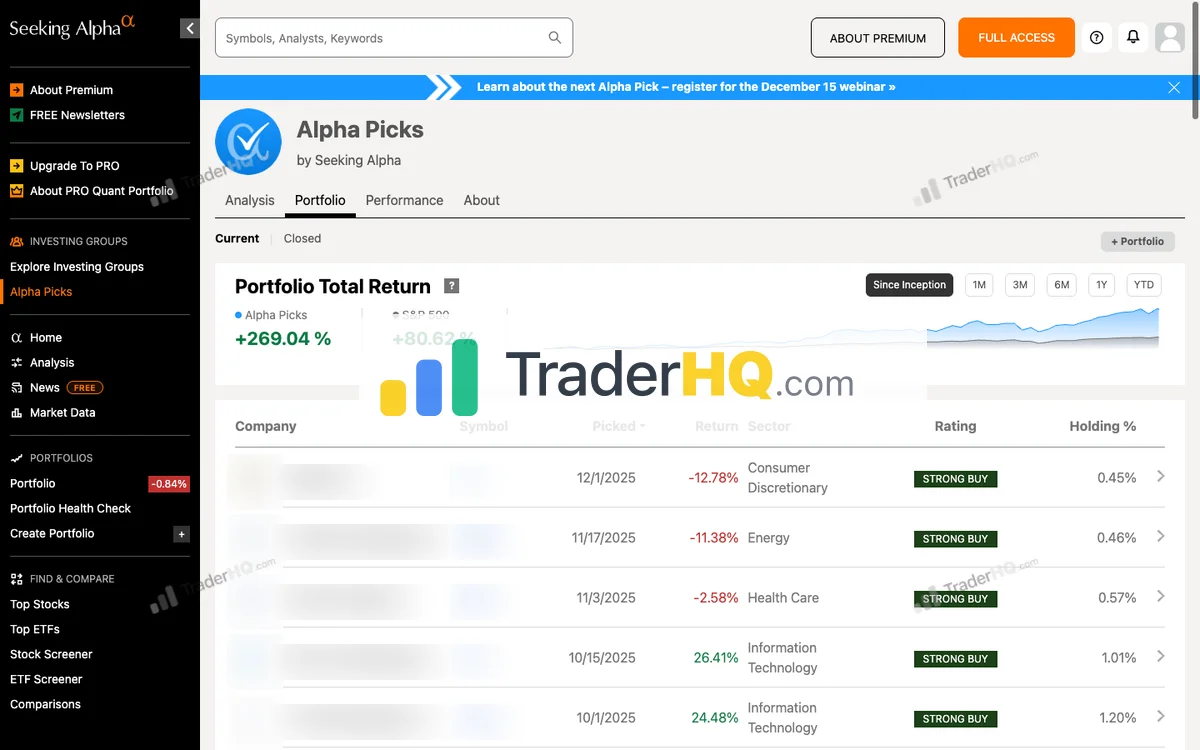
The result since July 2022: +347.9% total return versus +103.8% for the S&P 500. That is not marketing copy. It is documented across 104 positions with every entry date, every exit, and every return visible on the platform. TraderHQ analysis of the published trade log (data as of September 1, 2026) computed these returns from the publisher’s picks; the aggregate reconciles with the publisher’s figures. This is official-computed analysis — not a third-party audit. The benchmark is the average of per-position holding-period returns, not the index’s raw calendar-span return.
One honest frame before the numbers: a service’s published record belongs to the picks; your record belongs to your entries, your exits, and your temperament. The distance between those two numbers is where almost all subscriber disappointment lives.
The numbers that matter (TraderHQ analysis of the published trade log, data as of September 1, 2026) — with one rule attached: any winning number travels with its whole book: loser share, average loss, and the counting method — closed trades or open — stated in the same sentence. A highlight without its denominator is marketing, not evidence. Here the 66% win rate counts all 104 positions, open and closed; 35 picks are losers, losing on average -21.6%:
| Metric | Value |
|---|---|
| Total Return | +347.9% |
| S&P 500 (per-position average, same period) | +103.8% |
| CAGR | 43.3% |
| Win Rate | 66% (69 winners, 35 losers) |
| Median Position Return | +20.8% |
| Doublers (over +100%) | 17 |
| Ten-Baggers | 3 |
| Average Winner | +121.8% |
| Average Loser | -21.6% |
The critical insight is what the trade log calls the “time curve.” Even a perfect follower gets the returns of the year they started, not the lifetime average. Judge any long record by its starting cohorts — different start years effectively bought different products. Under one year, picks carry a 54.2% win rate with a 26.4% average return (and a 2.5% median — the typical recent pick is roughly flat). Hold 1-3 years? The win rate jumps to 77.6% with 94.5% average returns. The strategy mathematically rewards patience and punishes impatience.
What makes it work:
Seeking Alpha Alpha Picks removes the two biggest enemies of investment returns: your emotions and your timing. The model decides when to buy. The model decides when to sell. You follow. Systematic exits trigger when ratings drop to Sell/Strong Sell, or after 180 days at Hold. When a stock doubles, the “let winners run” policy only sells the initial investment on downgrades, keeping gains invested.
The transparency is exceptional. You see 51 active positions and 53 closed positions (TraderHQ analysis, data as of September 1, 2026). The +1,571% winner (APP) sits right next to the -54.4% loser (LRN) — position-level texture the platform shows in full. Re-recommended stocks average 251% returns versus 36% for single recommendations. Bear market picks from the 2022 vintage delivered an 82% win rate and 41% average returns.
A data-gap disclosure: 51 of the 104 positions are still open, so part of the +347.9% is unrealized paper profit. The service launched in July 2022, near a market bottom, which flatters absolute numbers. And the 2026 vintage is genuinely underwater so far — 16 picks averaging -6% with a 38% win rate — too early to judge, but worth naming.
Limitations:
The black-box nature is real. You know the five factors but not the specific weightings or why Stock A scored higher than Stock B. There is no portfolio construction guidance. No options strategies. No daily ideas. And the 4.2-year track record, while strong, has not been tested through a prolonged recession.
At $449/year ($499 regular price), the cost per pick is roughly $19. One avoided mistake on a $5,000 position pays for the subscription.
Motley Fool Epic Plus: The Premium Investing Platform
Motley Fool Epic Plus is The Motley Fool’s advanced-tier service, sitting between Epic ($299/year, list $499) and Fool Portfolios ($3,999/year). It delivers 8+ monthly stock picks across seven scorecards, daily Moneyball Portfolio recommendations (up to 250 per year), AI-powered scoring tools, and options trading strategies.
What you actually get:
Motley Fool Epic Plus bundles four core services that can be purchased at lower tiers — Stock Advisor (2 picks/month), Rule Breakers (1 pick/month), Hidden Gems (1 pick/month), and Dividend Investor (1 pick/month) — plus three exclusive scorecards: Trends, Value Hunters, and Global Partners (1 pick each per month).
On top of that, Motley Fool Epic Plus adds:
- AI Playbook Portfolio: Tom Gardner’s AI scoring system that evaluates a company’s technological infrastructure, AI transformation potential, and implementation quality
- Moneyball Portfolio: A real-money portfolio with daily stock guidance when markets are open
- 5 Moneymakers Portfolios: Backed by Motley Fool’s own capital, focused on businesses with pricing power
- Leveraging Options Scorecard: Options strategies for income and capital gains
- Full Moneyball Database: 3,500+ companies with AI-driven scoring (versus 340+ at the Epic tier)
- Fool IQ+ and GamePlan+: Complete financial data, quant projections, and retirement planning tools
The philosophical approach:
Motley Fool Epic Plus follows The Motley Fool’s core investing principles: buy 25+ companies over time, hold 5+ years, add savings regularly, hold through volatility, and let winners run. The AI layer adds quantitative rigor to what has historically been an analyst-driven process. In the current environment, the AI Playbook’s ability to score companies across the 2026 leadership split — memory and storage names up 75-560% YTD while enterprise software and ad-tech names fell 20-64% — gives Epic Plus a differentiation tool that traditional analyst coverage alone cannot match at the same speed.
The performance question:
Here is where it gets complicated. Motley Fool Epic Plus does not publish a composite track record for the service as a whole. The component services have strong but separate records:
- Stock Advisor: +978.9% since 2002 (66% win rate, 46 ten-baggers) — TraderHQ analysis of the published trade log (data as of August 31, 2026)
- Rule Breakers: +312% official scorecard returns (74% win rate, 37 ten-baggers, as of Aug 18, 2026)
- Hidden Gems: Motley Fool does not publish a current, per-scorecard track record for Hidden Gems, so no verifiable standalone return figure exists
- Dividend Investor: Motley Fool does not publish a current, per-scorecard track record for Dividend Investor, so no verifiable standalone return figure exists
But the unique Motley Fool Epic Plus features — AI Playbook, Moneyball Portfolio, Trends, Value Hunters, Global Partners, and options strategies — have no publicly documented performance. You are paying $1,999/year for capabilities where results are unverifiable.
The refund issue:
Unlike Stock Advisor and Epic, which offer 30-day money-back guarantees, Motley Fool Epic Plus offers only a “credit swap guarantee.” If it is not for you within 30 days, Motley Fool will transfer your membership credit to Epic ($499 value) — but you will not receive a cash refund. This is a meaningful policy shift at the premium tier.
At $1,999/year with an 8+ picks per month, the effective cost is roughly $21 per pick. But with daily Moneyball recommendations (up to 250/year), the cost per idea drops below $8.
The Head-to-Head Breakdown
Performance: Verified vs. Assumed
This is the single most important difference between these two services.
Seeking Alpha Alpha Picks documents every position with entry date, return, and S&P 500 comparison. TraderHQ analysis of the published trade log (data as of September 1, 2026) puts the total return at +347.9% versus +103.8% for the S&P 500 (per-position average benchmark). This is official-computed analysis, not a third-party audit — external prices were not independently re-verified, and with 51 of 104 positions open, part of the return is unrealized. You can see the +1,571% APP winner and the -54.4% LRN loser. That level of transparency is rare.
Motley Fool Epic Plus inherits the track records of its component services — particularly Stock Advisor’s +978.9% (TraderHQ analysis, data as of August 31, 2026). But Motley Fool Epic Plus itself has no composite performance data. The AI Playbook, Moneyball Portfolio, Trends, Value Hunters, and Global Partners scorecards launched more recently and have no publicly verifiable records. When you pay $1,999/year, a significant portion of that premium goes toward features with undocumented results.
Edge: Seeking Alpha Alpha Picks
Value Per Dollar
Motley Fool Epic Plus costs $1,999/year. Seeking Alpha Alpha Picks costs $449/year (or $499 at regular price). That is a $1,500 annual difference — or $1,550 at Alpha Picks’ regular pricing.
To justify the premium, Motley Fool Epic Plus would need to generate an additional $1,500+ in portfolio value. On a $100,000 portfolio (Epic Plus’s recommended minimum), that requires 1.5% additional annual returns just to break even on cost.
Seeking Alpha Alpha Picks’ documented 43.3% CAGR on a $10,000 minimum portfolio delivers returns that overwhelm the subscription cost. Even on a modest portfolio, the math works.
Edge: Seeking Alpha Alpha Picks
Breadth and Tools
This is where Motley Fool Epic Plus pulls ahead. Eight-plus monthly picks across seven investing styles. Daily Moneyball recommendations. AI-powered scoring across 3,500+ companies. Options strategies for income generation. Full research platform access.
Seeking Alpha Alpha Picks gives you two picks per month. A portfolio dashboard. Bi-weekly market recaps. That is it.
For investors who want a comprehensive investing ecosystem — not just stock picks, but tools, strategies, and daily engagement with the market — Motley Fool Epic Plus delivers substantially more.
Edge: Motley Fool Epic Plus
Risk Management
Seeking Alpha Alpha Picks uses systematic exit triggers: sell when ratings drop to Sell/Strong Sell, or after 180 days at Hold. The equal-weight approach and sector diversification (gold miners, tech, healthcare, industrials, cruise lines) provide built-in risk management.
Motley Fool Epic Plus diversifies across seven scorecards with different investment styles — growth, value, small-cap, income, global, and options. The variety of strategies provides natural hedging. But without composite performance data, it is impossible to assess how the combined portfolio behaves during drawdowns.
Edge: Seeking Alpha Alpha Picks (verified risk/reward) vs Motley Fool Epic Plus (broader diversification)
How to Decide
Choose Motley Fool Epic Plus if:
- You have a $100,000+ portfolio and want comprehensive daily guidance
- You value options strategies and income generation alongside stock picks
- You want AI-powered research tools and a full financial data platform
- You prefer multiple investment styles (growth, value, income, global) managed under one roof
- You already use Motley Fool’s ecosystem and want the premium experience
Choose Seeking Alpha Alpha Picks if:
- You want the best documented returns per dollar spent
- You trust algorithms over human judgment and prefer emotion-free investing
- You can commit to holding positions for 1-3+ years without intervening
- You want complete transparency on every position and its benchmark comparison
- You prefer a lean, focused service that does one thing well
Either works if:
- You are building a diversified portfolio and will follow the recommendations consistently
- You understand that any stock-picking service has losers (28-34% of picks) and that patience drives results
- You are adding this as one input to your investing process
The tiebreaker: Ask yourself this question: “Am I paying for better performance, or am I paying for a better experience?” If performance matters most, Seeking Alpha Alpha Picks has the data to back it up. If you want an immersive daily investing platform with tools, strategies, and community, Motley Fool Epic Plus delivers that.
The Bottom Line
Seeking Alpha Alpha Picks wins for most investors. The verified +348% return (TraderHQ analysis of the published trade log, data as of September 1, 2026), the 66% win rate, the 43.3% CAGR, and the $449 price point create a value proposition that Motley Fool Epic Plus cannot match on documented results alone. When you are comparing a service that shows you every position against one that cannot report composite performance, the transparent option earns trust.
But Motley Fool Epic Plus is the right choice for investors who want more than picks. If you have a six-figure portfolio and want daily Moneyball recommendations, AI-driven analysis tools, options strategies, and access to seven distinct investing approaches, the platform is genuinely comprehensive. The $1,999 buys an investing ecosystem, not just stock recommendations.
The fundamental question is simple: do you want a proven stock-picking algorithm, or a full investing command center? Seeking Alpha Alpha Picks answers the first. Motley Fool Epic Plus answers the second. For most investors focused on returns per dollar, the algorithm wins.

Alpha Picks by Seeking Alpha Performance
Seeking Alpha · 104 picks · 4 years · Updated 2026-09-01
| AP Return | S&P 500 | Alpha | Win Rate |
|---|---|---|---|
| +348% | +104% | +244% | 66% |
S&P 500 shows what you'd have earned buying the index on each pick date instead. Same timing, fair comparison.
| AP Multi-Baggers | 10x+ | 5x+ | 3x+ | 2x+ |
|---|---|---|---|---|
| Count | 1 | 4 | 12 | 19 |
| AP Asymmetry | Avg Winner | Avg Loser | Ratio |
|---|---|---|---|
| Return | +122% | -22% | ~6:1 |
Best Performers (All-Time)
| AP Pick | Return |
|---|---|
 APP AppLovin | +1.6K% |
**** Homebuilder | +228% |
**** Memory Chips | +403% |
 STRL Sterling Construction | +653% |
**** Power Plant Construction | +357% |
**** Casual Dining | +346% |
**** Thermal Management | +348% |
 CLS Celestica | +1.2K% |
 POWL Powell Industries | +887% |
 SMCI Super Micro Computer | +969% |
Latest Alpha Picks Picks
Tickers masked to protect subscriber value. Recent picks need 3-5+ years to demonstrate thesis.
| AP Pick | Return |
|---|---|
**** Memory Chips | +403% |
**** Circuit Board Manufacturing | +102% |
**** Growth Company | +75% |
**** Growth Company | +74% |
**** Gold Mining | +44% |
**** Growth Company | +42% |
**** Growth Company | +26% |
**** Growth Company | +26% |
**** Connectivity Chips | +26% |
**** Growth Company | +11% |
Alpha Picks Win Rate by Holding Period
| Hold Time | AP Win Rate | Avg Return |
|---|---|---|
| < 1 Year | 47.6% | +10% |
| 1-3 Years | 77.6% | +95% |
| 3-5 Years | 100% | +437% |
| 5-10 Years | N/A% | N/A |
| 10+ Years | N/A% | N/A |
Alpha Picks Performance by Year
| Year | AP Picks | Avg Return | Win Rate | |
|---|---|---|---|---|
| 2026 | 16 | -6% | 38% | LITE+42% |
| 2025 | 24 | +59% | 75% | MU+403% |
| 2024 | 24 | +65% | 67% | EAT+346% |
| 2023 | 24 | +155% | 71% | CLS+997% |
| 2022 | 16 | +65% | 75% | MOD+348% |
Inside Alpha Picks
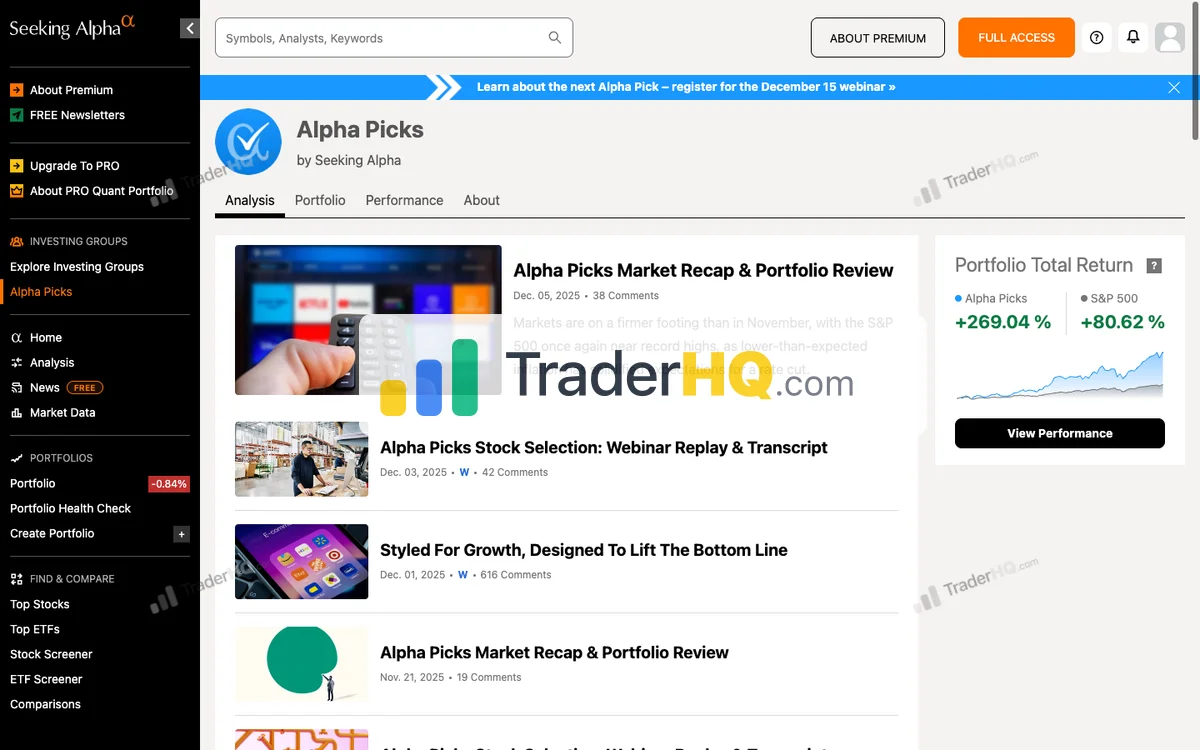
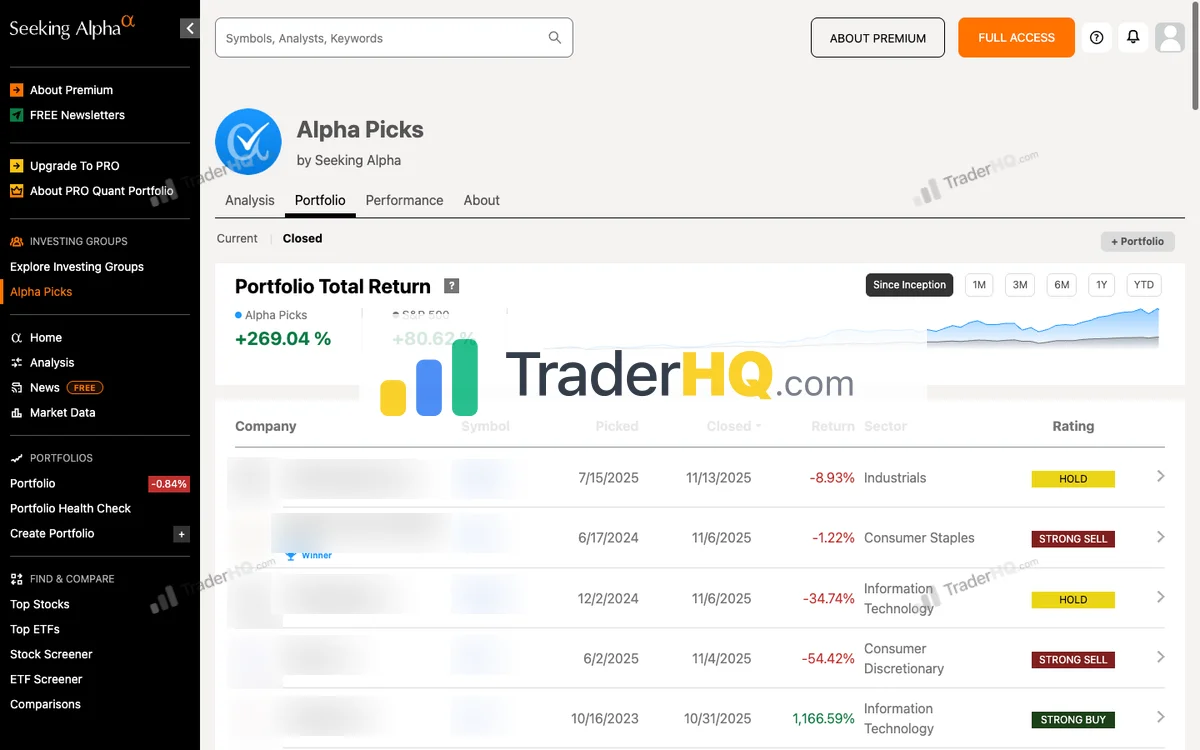

6 screenshots · Click to expand
Frequently Asked Questions
Motley Fool Epic Plus vs Seeking Alpha Alpha Picks: which is better?
Seeking Alpha Alpha Picks is better for most investors seeking documented stock-picking performance. It has delivered +348% total returns since July 2022 with a 66% win rate (TraderHQ analysis of the published trade log, data as of September 1, 2026) at $449/year. Motley Fool Epic Plus costs $1,999/year and offers a broader platform with 8+ monthly picks and AI tools, but does not publish composite performance data. Choose Seeking Alpha Alpha Picks for proven returns; choose Motley Fool Epic Plus for a comprehensive investing ecosystem with multiple strategies.
Is Motley Fool Epic Plus worth $1,999 per year?
It depends on your portfolio size and what you value. At $1,999/year, Motley Fool Epic Plus requires a $100,000+ portfolio for the cost to be reasonable relative to potential returns. You get 8+ monthly picks, daily Moneyball recommendations, AI scoring tools, options strategies, and seven investing scorecards. The platform is comprehensive. But the unique Epic Plus features lack publicly documented performance, making it difficult to verify whether the premium over the Epic tier ($299/year, list $499) is justified by results. The credit-swap-only refund policy (no cash refund) increases the commitment risk.
Is Seeking Alpha Alpha Picks worth $449 per year?
Yes, for patient investors who can hold 1-3+ years. At $449/year (or $499 regular), the service has delivered +348% total returns versus +104% for the S&P 500 (per-position average) since July 2022. The 66% win rate and 17 doublers across 104 positions demonstrate consistent performance. At roughly $19 per pick, one successful recommendation on a $5,000 position can pay for years of the subscription. The limitation is the 4.2-year track record — impressive but untested through a prolonged recession, and the 2026 vintage is underwater so far. Past performance does not guarantee future results.
Can I use both Motley Fool Epic Plus and Seeking Alpha Alpha Picks together?
Yes, and there is a logical case for it if your portfolio supports the combined cost. Seeking Alpha Alpha Picks provides the core quant-driven stock selection with verified performance, while Motley Fool Epic Plus adds daily ideas, options income strategies, AI-powered research tools, and exposure to seven investing styles. The two services use fundamentally different methodologies (pure quant vs analyst + AI hybrid), which provides genuine diversification of approach. The combined annual cost would be $2,448-$2,498, so this pairing makes most sense for portfolios above $150,000.
What does Motley Fool Epic Plus include that regular Epic does not?
Three additional scorecards, the AI Playbook Portfolio, the full Moneyball database, and options strategies. Epic ($299/year, list $499) gives you 5 picks per month across Stock Advisor, Rule Breakers, Hidden Gems, and Dividend Investor. Motley Fool Epic Plus ($1,999/year) adds the Trends, Value Hunters, and Global Partners scorecards (3 more picks/month), the AI Playbook Portfolio with AI-driven stock scoring, the expanded Moneyball database (3,500+ companies vs 340+), the Moneyball AIball database (3,400+ companies), 5 Moneymakers Portfolios, and the Leveraging Options scorecard for options trading strategies.
How does Seeking Alpha Alpha Picks pick stocks?
Pure quantitative model with no human discretion. Every month, the model scans U.S. equities and selects the two highest-scoring stocks based on five factors: Value, Growth, Profitability, Momentum, and EPS Revisions. Stocks must maintain a “Strong Buy” quant rating for at least 75 consecutive days, have $500M+ market cap, and not be a REIT or ADR. Exit triggers are equally systematic: sell when the rating drops to Sell/Strong Sell, or after 180 days at Hold. When a stock doubles, only the initial investment is sold on downgrades — gains stay invested. The model is a black box in terms of specific factor weightings.