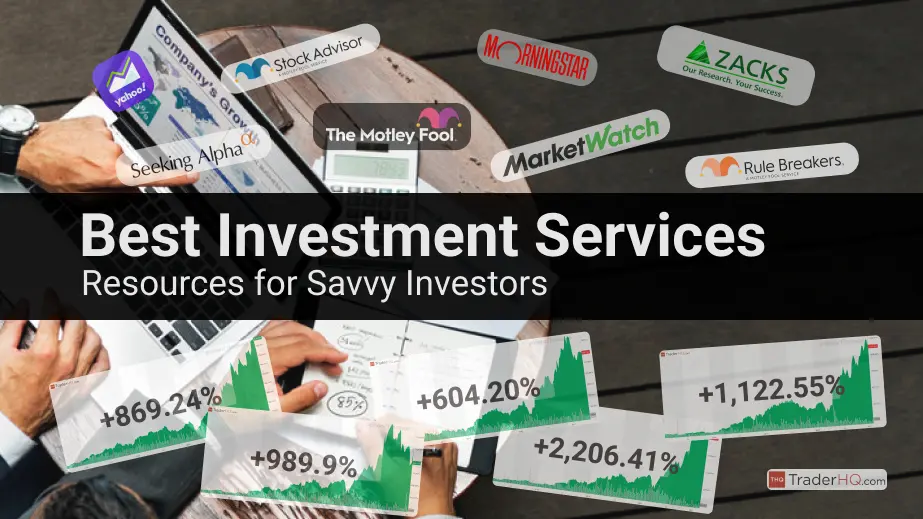
7 Best Stock Advisor Websites & Stock Picking Services in 2025
You can discover reliable stock picks to grow your portfolio with confidence using Motley Fool Stock Advisor Review and Seeking Alpha review insights.
We aim for insightful coverage of products and services, including some from compensating partners, which may influence our topics and presentation. Our opinions and conclusions remain unbiased. See our Advertiser Disclosure.
Imagine building a portfolio that doesn’t just grow, but truly secures the dreams closest to your heart—funding your children’s education or crafting a retirement you can rely on with peace of mind.
In today’s ever-shifting market, shaped by evolving trade policies, tech innovations, and global uncertainties, finding the best stock picking services 2025 has to offer can show you the way to make decisions that fit your life and protect what matters most.
Picture turning those hopes into reality with tools and guidance that feel right for you—find out how the seven top stock advisor websites can help bring clarity and confidence to every step of your journey.
1. Motley Fool Stock Advisor
-
Best for: Long-term investors hunting market-beating returns, beginners craving expert guidance, and busy professionals needing streamlined stock recommendations.
-
Cost: $99/year for new members (50% OFF $199/year)
Aggregate Overall Performance:
- Total Return: +975.44%
- S&P 500 Return: +171.82%
- Outperformance vs. S&P 500: +803.62%
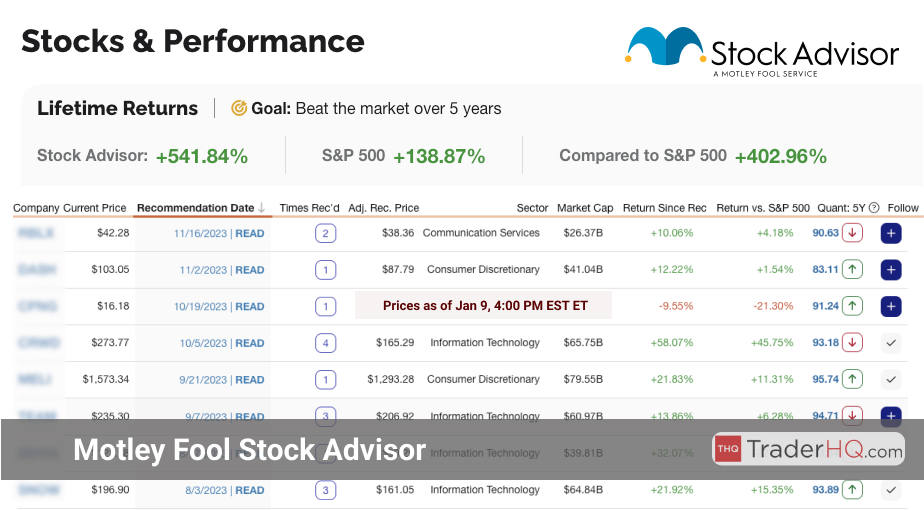
Motley Fool Stock Advisor, launched in 2002, stands as a trusted leader among the best stock advisor services for 2025. With a proven focus on long-term, buy-and-hold strategies, it’s designed to help you outpace the market, especially in today’s complex landscape where trade policy shifts and inflation pressures loom large as of May 17, 2025. Whether you’re dodging geopolitical volatility or seeking growth amidst AI-driven tech surges, Stock Advisor (see our 2025 review) offers the clarity you need.
The service delivers monthly stock picks, a handpicked list of core stocks, and transparent performance tracking. Its philosophy? Find high-quality companies with solid fundamentals and hold them for compounding gains—a strategy that’s critical when navigating interest rate fluctuations and tariff uncertainties impacting markets right now. Stock Advisor’s approach isn’t just about picks; it’s about building wealth that lasts, no matter the economic headwinds.
As of May 16, 2025, Stock Advisor boasts an average return of +975.44% since inception, crushing the S&P 500’s +171.82% over the same period. That’s a staggering outperformance of +803.62%, proving its edge even as markets grapple with small-cap undervaluation and gold’s 21% surge this year. This isn’t luck; it’s a disciplined, long-term game plan at work.
Stock Advisor’s track record shows what patience can achieve. As Peter Lynch famously said, “If you’re good, you’re right six times out of ten.” Their consistent wins reflect a knack for spotting resilient businesses, vital in a 2025 market rattled by geopolitical tensions and inflation risks. Think of it as your shield against uncertainty.
Warren Buffett’s wisdom on patience echoes here too. Stock Advisor targets companies with strong moats, top-tier management, and steady growth—exactly what you need when tech concentration risks or trade disputes threaten stability. Their picks aren’t guesses; they’re calculated bets on enduring value.
Some standout successes include:
- A semiconductor giant, recommended in 2005, skyrocketed +82,888%, turning $1,000 into over $829,880.
- A streaming pioneer, picked in 2004, delivered +64,158%, transforming $1,000 into $642,580.
- An e-commerce titan from 2002 soared +26,757%, growing $1,000 to $268,570.
Stock Advisor also tackles the emotional side of investing. Their research-backed insights keep you grounded, preventing knee-jerk reactions to market noise like the recent 10% tariff proposals shaking up global supply chains. With their guidance, you stay focused on long-term goals, not short-term chaos.
The Motley Fool platform equips you with tools like stock screeners, performance dashboards, and a robust learning hub. These resources empower you to make smart moves, especially crucial in 2025’s fast-shifting environment of AI investments and M&A rebounds. It’s not just advice—it’s a full toolkit for success.
Whether you’re new to investing or a seasoned player, Stock Advisor helps you craft a diversified, high-performing portfolio. With a focus on quality and growth, it’s your partner in achieving financial freedom, even as inflation hovers above the Fed’s 2% target and safe-haven assets like gold gain traction.
Key Features of Motley Fool Stock Advisor (read the 2025 review)
- Monthly Stock Recommendations: Get two deeply researched picks each month with detailed reports, targeting companies poised for growth—key for beating inflation in 2025.
- Curated Foundational Stocks: Access a list of 10 core stocks with long-term potential, updated to seize today’s best opportunities amid shifting interest rates.
- Monthly Rankings: See the top 10 investment ideas from their recommendations, keeping you aligned with the strongest prospects in a volatile market.
- Detailed Performance Tracking: Full transparency with returns compared to the S&P 500, so you know exactly how your portfolio stacks up against broader trends.
- Extensive Educational Resources: From articles to live Q&As and a vibrant community, gain the knowledge to navigate 2025’s complex challenges like geopolitical risks.
Motley Fool Stock Advisor’s unmatched history of market-beating returns builds unshakable trust. By pairing top-tier investments with ongoing education, it empowers you to grow wealth sustainably, even as trade tensions and fiscal spending uncertainties shape the 2025 investment landscape.
Investment Philosophy and Methodology
Long-Term, Buy-and-Hold Investing At its core, Stock Advisor champions long-term investing. You’re encouraged to ignore daily market swings—think recent small-cap dips in the Russell 2000—and focus on a company’s lasting potential. This compounding strategy is your edge against 2025’s inflation and policy-driven volatility.
This approach fosters discipline, helping you sidestep the trap of market timing. Holding quality stocks through cycles lets you capture the full growth of strong businesses, a must when tariff risks and interest rate shifts threaten short-term gains.
Focus on High-Quality Companies Stock Advisor zeroes in on firms with robust fundamentals—think steady earnings, high margins, and strong returns on equity. These are the businesses that endure downturns and thrive long-term, a lifeline in today’s economy where inflation and geopolitical strife test weaker players.
The Role of Team Everlasting Led by Tom Gardner, Team Everlasting hunts companies with:
- Strong Competitive Advantages: Unique strengths like brand power or tech innovation, critical for staying ahead in competitive 2025 markets.
- Excellent Management: Leaders who innovate and execute, steering firms through economic storms like trade policy disruptions.
- Consistent Growth: Reliable revenue and earnings growth, positioning firms as leaders for sustained wealth-building this year.
The Role of Team Rule Breakers Team Rule Breakers targets disruptive innovators with:
- Innovation: Game-changing products, vital for tapping into 2025’s AI and tech investment boom.
- Disruption: Challengers to old-guard industries, offering outsized returns in emerging sectors.
- Market Potential: Massive growth opportunities in fast-evolving fields, aligning with current trends like data center expansion.
Rigorous Analysis and Strict Criteria Every pick undergoes intense scrutiny, including:
- Fundamental Research: Deep dives into financials and business models to uncover true value, essential in a market swayed by Fed rate cuts.
- Management Assessment: Evaluating leadership’s vision and track record, a key to surviving 2025’s uncertainties.
- Competitive Advantage Analysis: Pinpointing unique edges that sustain growth, crucial during economic turbulence.
- Growth Potential: Assessing future revenue and market share gains, factoring in 2025 trends like M&A activity.
- Valuation Metrics: Using P/E ratios and cash flow analysis to ensure fair pricing, helping you buy smart in a risk-averse market.
This meticulous process delivers picks with strong growth potential while prioritizing quality—a recipe for market-beating returns, even as global tensions and inflation shape the 2025 landscape.
Stock Picking Performance and Examples of Successful Picks Motley Fool Stock Advisor’s reputation for stellar stock picks is rock-solid. Its average pick has consistently trounced the S&P 500, proving its knack for finding winners across market cycles, from 2021’s tech boom to 2025’s trade policy hurdles.
Recent performance shines bright. A June 2024 e-commerce pick returned +80%, beating the S&P 500 by +67%. An April 2024 Southeast Asian delivery play gained +50%, outperforming the market by +29%, despite volatility.
Over five years, results impress further. A January 2020 electric vehicle leader soared +1,120%, outpacing the S&P 500 by +1,021%. A June 2020 cybersecurity firm delivered +358%, exceeding the benchmark by +251%.
These wins show how Stock Advisor, a standout among the 7 best stock advisor websites and stock picking services in 2025, can transform your portfolio. Picture turning $1,000 into thousands, confidently riding market waves with expert picks at your side.
2. Alpha Picks by Seeking Alpha
-
Best for: Value investors chasing high returns, growth-focused individuals hunting for market outperformers, and strategic planners looking to diversify portfolios.
-
Cost: $449/year for new members (10% OFF $499/year)

Aggregate Overall Performance:
- Total Return: +163.81%
- S&P 500 Return: +57.41%
- Outperformance vs. S&P 500: +106.40%
Alpha Picks by Seeking Alpha is your edge in the unpredictable stock market of 2025. With trade tensions, interest rate shifts, and tech sector volatility shaping today’s landscape, this service cuts through the noise using advanced quantitative analysis and unique data to deliver top-tier investment opportunities. As of May 17, 2025, Alpha Picks empowers you to outpace the market and build wealth, even amidst inflation pressures and geopolitical risks.
Methodology and Approach
Alpha Picks (read our review) uses a disciplined, data-driven strategy to uncover winning stocks—vital in today’s complex environment. Here’s how they do it:
- Quantitative Analysis: Advanced algorithms analyze massive datasets to spotlight stocks with the highest potential to beat the market, giving you a clear advantage.
- Fundamental Research: Every pick is backed by in-depth analysis, ensuring you invest in companies with strong foundations, not just fleeting trends.
- Risk Management: With market volatility spiking due to trade policies and global tensions in 2025, their focus on risk-adjusted returns helps you navigate uncertainty with confidence.
Key Features and Benefits
Alpha Picks equips you with powerful tools and insights to fuel your financial growth, tailored to today’s challenges:
- Expert Quantitative Strategists: Tap into the expertise of pros like Steve Cress, who decode market trends to guide you toward high-potential opportunities.
- In-Depth Research and Analysis: Each stock pick includes detailed reasoning, so you know exactly why it’s recommended—crucial for confident decisions in a shaky market.
- Bi-Monthly Stock Recommendations: Stay ahead with regular updates, ensuring your portfolio adapts to fast-changing conditions like interest rate cuts or tariff impacts.
- Ongoing Portfolio Guidance: As inflation lingers and volatility persists, Alpha Picks offers continuous advice to fine-tune your strategy and safeguard your capital.
Performance in 2025
As of May 16, 2025, Alpha Picks has proven its ability to spot market-beating investments:
-
Overall Performance: Since inception, Alpha Picks has achieved a staggering total return of +163.81%, crushing the S&P 500’s +57.41% over the same period. That’s an outperformance of +106.40%, showcasing their knack for delivering value through economic ups and downs.
-
Notable Picks:
-
A Mobile App Monetization Platform picked in November 2023 returned +753.77%, turning a $1,000 investment into $8,537. This shows Alpha Picks’ ability to pinpoint explosive growth, even in competitive sectors.
-
A Server & Storage Solutions Provider from November 2022 delivered +968.59%, transforming $1,000 into over $10,685 by March 2024. It’s proof of their foresight in tech-driven markets.
-
A Casual Dining Chain selected in April 2024 gained +195.82%, growing $1,000 to nearly $2,958. This highlights their skill in identifying recovery plays amid 2025’s economic pressures.
Tools and Resources
Alpha Picks arms you with cutting-edge resources to sharpen your investment game:
- Proprietary Quantitative Ratings: Get unique insights into stock potential, helping you assess opportunities against 2025’s backdrop of trade uncertainty and AI-driven growth.
- Portfolio Management Tools: Adjust your holdings in real-time to counter market shifts, like rising inflation or geopolitical flare-ups, with ease.
- Email Alerts and Analytics: Stay informed with timely updates and deep analysis, ensuring you never miss a critical move in today’s fast-paced market.
The Team Behind Alpha Picks
The strength of Alpha Picks lies in its expert team, driving results for subscribers:
- Steve Cress, Head of Quantitative Strategies: Spearheads the analytical framework, ensuring picks are rooted in robust data for maximum impact.
- Zachary Marx, CFA, Senior Quantitative Strategist: Offers deep market insight, enhancing the service’s ability to uncover high-growth stocks.
- Joel Hancock, Senior Director of Product: Ensures tools and resources are user-friendly, so you have everything needed to act decisively.
Why Alpha Picks in 2025?
With trade tariffs looming, interest rates fluctuating, and AI investments concentrating market risk as of May 17, 2025, Alpha Picks by Seeking Alpha (see our 2025 review) (read our review) is your strategic ally. Its data-driven precision, paired with expert insights and a focus on sustainable growth, makes it indispensable for beating inflation, dodging volatility, and hitting your financial targets. Imagine turning a $1,000 investment into thousands by leveraging picks tailored to today’s unique challenges.
By joining Alpha Picks, you’re not just getting stock tips—you’re stepping into a community of savvy investors with the strategies and tools to thrive in 2025 and beyond. Don’t let market uncertainty hold you back; take control of your financial future now.
Best Stock Advisor Services for 2025 – Top Picks to Grow Your Wealth with Confidence
| 🎯 Best Stock Advisor Picks | Best For | Investing Focus |
|---|---|---|
| Motley Fool Stock Advisor | Long-term growth | Stock Picking |
| Alpha Picks by Seeking Alpha | Quant analysis | Analyst-Powered |
| Morningstar Investor | Independent research | Investment Screening |
| Zacks Premium | Research focused | Earnings Analysis |
| Seeking Alpha Premium | Detailed research | Comprehensive Analysis |
| Trade Ideas | Real-time traders | AI Insights |
| TipRanks Premium | Data-driven investing | Expert Consensus |
3. Morningstar Investor
-
Best for: Value seekers, data-driven planners, and research enthusiasts; perfect for those who crave in-depth analysis and robust research tools to navigate complex markets.
-
Cost: $199/year for new members (20% OFF $249/year)

Morningstar Investor equips you with the tools and insights to make confident investment decisions, even in today’s unpredictable landscape. With over 150 specialized analysts, Morningstar provides independent, unbiased research across diverse sectors, ensuring you have a clear view of opportunities as of May 17, 2025.
In a market shaped by trade policy uncertainties and interest rate volatility, their comprehensive ratings system—covering securities, fund managers, and ESG factors—offers a transparent framework to evaluate investments. Their cutting-edge screening tools blend data analytics with expert insights, letting you filter thousands of options and access pre-vetted lists. Updated for 2025, these tools now include AI-driven filters to spot trends like AI sector growth or small-cap value plays, keeping you ahead of the curve.
Morningstar’s Portfolio X-Ray feature delivers a multi-dimensional analysis of your holdings, uncovering hidden risks, overlaps, and fee impacts. With recent enhancements as of May 2025, it now offers predictive analytics and visualizations to simulate how your portfolio might perform under scenarios like rising inflation or geopolitical shocks. Imagine catching a costly overlap before it drags down your returns—this tool makes it possible.
- Account Aggregation: Seamlessly monitor all your investments in one place, with real-time updates reflecting 2025’s fast-moving markets.
- Personalized Insights: Get tailored recommendations based on your specific assets, now with deeper granularity to address current concerns like tariff-induced costs.
- Watchlists & Customization: Stay on top of critical data with real-time tracking of market shifts, enhanced with new features rolled out in May 2025.
Morningstar Investor’s pricing rewards commitment, offering significant savings on annual plans and a 7-day free trial to test the waters risk-free. As of May 2025, they’ve introduced flexible quarterly and semi-annual discounts, catering to varied investment timelines. It’s a small price for the peace of mind that comes with data-backed decisions.
You can leverage Morningstar’s tools for risk management, performance tracking, and uncovering hidden opportunities while staying educated on market dynamics. Picture screening 50 stocks in minutes during a volatile week in 2025—Morningstar (in-depth 2025 review) automates the heavy lifting, saving you time. New educational modules on sustainable investing and AI-driven finance, launched this year, ensure you’re not just reacting to trends but mastering them.
By providing consistent, unbiased research, Morningstar Investor (read our review) builds your trust and empowers you to take charge of your financial destiny. Whether you’re a beginner seeking simplicity, a long-term investor craving stability, or a professional needing efficiency, this service helps you navigate 2025’s challenges—from inflation pressures to tech sector concentration risks. As of May 17, 2025, Morningstar remains a leader in delivering actionable insights for a rapidly evolving market.
4. Zacks Premium
-
Best for: Experienced traders seeking detailed analytics, value investors looking for underpriced stocks, and active investors needing daily updates.
-
Cost: $249/year after free 30-day trial

Zacks Premium stands as a cornerstone in the investment research industry. Founded in 1978, Zacks Investment Research has evolved to become a trusted name for data-driven stock analysis, and as we enter 2025, its relevance remains strong amidst the evolving market dynamics.
The service’s core offerings revolve around the Zacks Rank system, a proprietary stock-rating model. This system analyzes earnings estimate revisions to identify stocks with the highest potential for outperformance. The #1 Rank List, representing the top 5% of stocks, has historically doubled the S&P 500’s returns.
What sets Zacks Premium (in-depth 2025 review) apart is its focus on earnings estimate revisions as a key indicator of future stock performance. This approach provides investors with a unique edge in predicting market movements, a strategy that continues to be effective in the volatile markets of early 2025.
Zacks Premium offers a suite of powerful tools:
-
Style Scores (Value, Growth, Momentum): These scores help investors align their strategies with specific investment styles, which is particularly useful in the current economic climate where different sectors are responding variably to global economic recovery trends.
-
Focus List Portfolio: Curates 50 stocks for long-term growth potential. This list has consistently outperformed the market since its inception, and with the latest updates in January 2025, it continues to show robust performance.
-
Industry Rank: Aggregates individual stock ranks to identify top-performing sectors. This tool is vital for investors looking to capitalize on the ongoing sector rotations influenced by technological advancements and sustainability initiatives.
-
Earnings ESP Filter: Predicts earnings surprises with remarkable accuracy. Given the recent volatility in corporate earnings due to global supply chain challenges, the ESP Filter’s insights have proven even more critical for investors in early 2025.
-
Premium Screener: Allows investors to discover stocks matching specific criteria. This customizable tool caters to various investment strategies, from value to growth to income-focused approaches, making it adaptable to the diverse investment needs in the current market.
Zacks Premium also provides in-depth Equity Research Reports on over 1,000 widely-followed companies. These reports offer valuable insights into growth drivers, industry placement, and valuation metrics, crucial for understanding the impact of recent global economic policies and shifts in consumer behavior.
The Style Scores help investors align their strategies with specific investment styles. The VGM Score combines these metrics, offering a comprehensive view of a stock’s potential, which is more relevant than ever with the rapid shifts in market conditions at the start of 2025.
Zacks’ Focus List Portfolio curates 50 stocks for long-term growth potential. This list has consistently outperformed the market since its inception, and its latest iteration in January 2025 reflects adjustments to the new economic landscape.
The Industry Rank tool aggregates individual stock ranks to identify top-performing sectors. This allows investors to capitalize on broader market trends and sector rotations, which have been influenced by recent technological breakthroughs and sustainability trends.
Zacks Premium empowers investors with data-driven insights and powerful analytical tools. Whether you’re a seasoned investor or just starting out, these resources can help enhance your investment strategy and potentially improve your portfolio performance in the dynamic market conditions of January 2025.
5. Seeking Alpha Premium
-
Best for: Data-driven analysts, long-term planners, value seekers. Comprehensive insights for strategic planning and identifying undervalued stocks.
-
Cost: $189/year (Regularly $239/year) + 7-day free trial

Seeking Alpha Premium is a comprehensive stock analysis platform that harnesses the collective wisdom of a global community of investors and industry experts. With a focus on providing diverse, data-driven insights, Seeking Alpha Premium (read our review) empowers users to make informed investment decisions in early 2025.
The platform offers an extensive array of tools and resources, including:
-
In-depth articles from seasoned investors and analysts, covering a wide range of stocks, sectors, and market trends. As of January 2025, Seeking Alpha Premium continues to deliver high-quality content, with a recent focus on emerging sectors such as AI, renewable energy, and biotechnology.
-
Proprietary ratings and quantitative metrics to help users quickly assess the strength of individual stocks. These tools have been updated to reflect the latest market conditions and include new metrics for assessing ESG (Environmental, Social, and Governance) factors, which are increasingly important for investors in 2025.
-
Powerful screening tools to help users discover new investment opportunities aligned with their portfolio and risk tolerance. In the first week of January 2025, Seeking Alpha Premium introduced enhanced screening features that allow users to filter stocks based on real-time market data and the latest economic indicators.
What sets Seeking Alpha Premium apart is the sheer breadth and depth of its crowd-sourced content. Users can access a spectrum of opinions and analysis, from detailed fundamental research to technical assessments and contrarian views. As of early 2025, the platform has seen an increase in user-generated content, reflecting the growing interest in alternative investment strategies and niche sectors.
If you’re ready to elevate your investing game and join a vibrant community of market participants, Seeking Alpha Premium is the platform to help you achieve your financial goals with confidence in early 2025.
6. Trade Ideas
-
Best for: Day traders seeking real-time data, swing traders looking for actionable alerts, and algorithmic traders interested in AI-driven insights.
-
Cost: $84/month for Standard Plan (billed annually at $999)

Trade Ideas is a pioneering stock market analytics platform that has been empowering individual traders and investors since 2002. With its cutting-edge technology and innovative tools, Trade Ideas (read the 2025 review) has carved a unique niche in the market. As of January 2025, Trade Ideas continues to evolve, adapting to the ever-changing dynamics of the financial markets and leveraging the latest advancements in AI and machine learning to enhance user experience.
At the core of Trade Ideas’ offerings is a powerful combination of real-time market data, advanced analytics, and artificial intelligence. This unique blend of features sets Trade Ideas apart from other stock advisory services, providing users with actionable insights that can be immediately applied to their trading strategies. In the current market environment, where volatility and rapid changes are the norm, the ability to access real-time data and AI-driven insights has become more crucial than ever.
One of the standout features of Trade Ideas is its AI-powered assistant, named Holly. Holly is designed to scan the market in real-time, identify potential trading opportunities, and provide users with clear, easy-to-follow trade ideas. By leveraging machine learning algorithms, Holly continuously adapts to changing market conditions, ensuring that the trade ideas generated are always relevant and up-to-date. In 2025, Holly has been further refined to incorporate the latest AI technologies, enhancing its ability to predict market movements and identify high-probability trading opportunities.
In addition to Holly, Trade Ideas offers a wealth of other tools and resources, including:
-
Customizable stock scanners
-
Real-time alerts
-
Backtesting capabilities
-
Risk management tools
-
Educational resources
These features are designed to cater to the diverse needs of Trade Ideas’ user base, whether they are day traders looking for quick profit opportunities or long-term investors seeking to build a robust portfolio. In the current market, where the ability to quickly adapt to new information is key, these tools provide a significant edge to users.
Another key aspect of Trade Ideas is its commitment to user education and community building. The platform offers a range of educational resources, including webinars, tutorials, and a comprehensive knowledge base, to help users enhance their trading skills and knowledge. In 2025, Trade Ideas has expanded its educational offerings, with new courses focused on the latest trading strategies and market trends.
Additionally, Trade Ideas fosters a vibrant community of traders through its trading room and forum, where users can interact, share ideas, and learn from one another. This community aspect has become even more valuable in the current year, as traders seek to navigate the complexities of the market together.
If you’re looking for a stock advisory service that can provide you with the tools, insights, and support you need to succeed in the markets, Trade Ideas is definitely worth considering. With its advanced technology, user-friendly interface, and commitment to user education, Trade Ideas has the potential to revolutionize your trading experience and help you achieve your financial goals in the dynamic market environment of 2025.
7. TipRanks Premium
-
Best for: Growth seekers looking for analyst insights, trend spotters benefiting from data visualization, and value hunters using stock scores.
-
Cost: $360/year for new members
TipRanks Premium is a cutting-edge stock advisor service that harnesses the power of aggregated expert opinions and predictive tools to provide investors with actionable market insights. By compiling data and forecasts from top-performing analysts, TipRanks offers a comprehensive overview of market sentiment and consensus, empowering users to make more informed investment decisions in the dynamic market environment of January 2025.
What sets TipRanks apart is its unique approach to transparency and user empowerment. The platform provides a wealth of features designed to give investors a clear, unbiased view of the market, including:
-
Analyst Rating Consensus: See the overall “buy, hold, or sell” recommendations from top analysts for any given stock. This can be particularly useful as we enter 2025, with various sectors expected to rebound or continue their growth trajectory.
-
Price Targets: Access the average, high, and low price targets from analysts to gauge a stock’s potential upside or downside. With the economic forecasts for 2025 suggesting a potential shift in interest rates, these targets can offer critical insights.
-
Insider Trading Signals: Monitor the trading activity of company insiders, which can often provide clues about a stock’s future performance. Given the increased regulatory scrutiny in 2025, insider trading patterns could be more telling than ever.
In addition to these powerful tools, TipRanks Premium (read our review) offers a host of resources to help investors stay informed and ahead of the curve. From daily stock ideas to in-depth research reports, the platform provides a constant stream of valuable insights. As we move into 2025, TipRanks has enhanced its data analytics capabilities to better predict market trends in the post-AI boom era.
Whether you’re a seasoned investor or just starting to build your portfolio, TipRanks Premium can be an invaluable ally in your investment journey. With its commitment to transparency, data-driven insights, and user empowerment, TipRanks is uniquely positioned to help you navigate the complex world of stock investing with confidence and clarity, especially in the volatile market conditions anticipated for 2025.
If you’re ready to take your investment strategy to the next level, TipRanks Premium could be the solution you’ve been seeking. By leveraging the collective wisdom of top market experts and cutting-edge predictive tools, you’ll be well on your way to building a robust, resilient portfolio designed to weather any market conditions in 2025.
What is a Stock Advisor Website?
A stock advisor website is an online platform designed to provide investors with expert guidance, recommendations, and tools to make informed investment decisions. These websites aim to demystify the process of selecting stocks by offering curated lists of promising investment opportunities. Leveraging the expertise of professional analysts and comprehensive research, stock advisor websites empower investors to build profitable portfolios with confidence.
Whether you’re a novice investor or a seasoned market participant, a stock advisor website can serve as an invaluable resource throughout your investing journey. These platforms typically feature a range of offerings, including stock picks, in-depth market analysis, and educational content tailored to help you navigate the complexities of the stock market. By subscribing to a reputable stock advisor website, you can gain access to the insights and strategies necessary to make smart investment choices and grow your wealth over time.
One of the primary advantages of using a stock advisor website is the potential to outperform the broader market. Many of these services boast a proven track record of delivering market-beating returns due to the rigorous research and analytical expertise of their teams. By following the guidance of a trusted stock advisor, you can position yourself to capitalize on profitable opportunities while mitigating risks.
However, not all stock advisor websites are created equal. It’s crucial to select a service that aligns with your investment goals, risk tolerance, and learning preferences. Look for a platform with a transparent methodology, a strong history of performance, and a user-friendly interface that facilitates easy implementation of their recommendations. With the right stock advisor website, you can approach the stock market with enhanced knowledge, skill, and confidence.
What is the Best Stock Advisor?
Identifying the best stock advisor involves evaluating several key factors. First and foremost, you want a service with a proven track record of delivering market-beating returns over the long term. Look for a stock advisor that has consistently outperformed benchmark indexes like the S&P 500, demonstrating their ability to identify winning stocks in various market conditions.
Transparency is another critical component of top-tier stock advisor services. You want a platform that openly shares its methodology, performance metrics, and track record, ensuring you can trust the validity of their recommendations. The best stock advisors provide clear, detailed analysis and rationale behind each stock pick, enabling you to understand the factors driving their investment decisions.
Affordability and value are also essential considerations. While investing in quality research and guidance is crucial, you don’t want to overpay for services you don’t need. Look for a stock advisor that offers various subscription options and pricing tiers to fit your budget and investing goals.
Ultimately, the best stock advisor for you will depend on your unique needs and preferences as an investor. Some platforms may be better suited for long-term, buy-and-hold investors, while others cater to more active traders. Consider your investment style, risk tolerance, and learning objectives when evaluating potential stock advisor services.
How We Evaluated the Best Stock Advisor Websites?
To determine the best stock advisor websites, we conducted a comprehensive evaluation process that considered a range of critical factors. Our goal was to identify platforms that offer the most value, performance, and user experience for investors like you.
Key criteria we assessed include:
-
Track Record: We analyzed each stock advisor’s historical performance, focusing on services that have consistently beaten the market over the long term.
-
Transparency: We prioritized platforms that openly share their methodology, performance metrics, and investment rationale, ensuring trust in their recommendations.
-
Expertise: We evaluated the qualifications, experience, and track record of each service’s analysts and research team.
In addition to these core factors, we also considered:
-
Educational Resources: The best stock advisors don’t just tell you what to buy—they also help you understand why. We looked for platforms with robust educational content to help you grow your investing knowledge.
-
User Experience: A stock advisor website should be easy to navigate and use. We assessed each platform’s interface, mobile accessibility, and overall user experience.
-
Community and Support: Many of the best stock advisor services offer vibrant investor communities and responsive customer support. We factored these elements into our evaluation as well.
By weighing each of these criteria and more, we identified the stock advisor websites that truly stand out. While no single service may be perfect for every investor, the platforms that scored highest in our evaluation offer a compelling combination of performance, value, and user experience. Whether you’re just starting to invest or looking to take your portfolio to the next level, these top-rated stock advisor websites can provide the guidance and insight you need to succeed in the market.
Benefits of Using a Stock Advisor Website
Using a stock advisor website offers several benefits that can significantly enhance your investing experience and outcomes:
-
Access to Expert Analysis: Stock advisor websites employ seasoned analysts who conduct thorough research, saving you time and effort while providing access to high-quality insights.
-
Diversified Recommendations: These platforms often offer a diversified list of stock picks, helping you spread risk across different sectors and industries.
-
Educational Support: Many stock advisor websites offer educational materials, webinars, and tutorials that can help you build your investing knowledge and skills.
-
Timely Updates: Subscribers receive timely updates and alerts about market changes, new stock picks, and portfolio adjustments, ensuring you stay informed and can act swiftly.
-
Community Engagement: Some platforms feature forums or groups where you can discuss strategies, share experiences, and gain insights from other investors.
Conclusion
Stock advisor websites can be a powerful tool for investors looking to make informed decisions and achieve their financial goals. By providing expert analysis, diversified recommendations, and educational resources, these platforms can help you navigate the complexities of the stock market with greater confidence. However, it’s essential to choose a service that aligns with your investment strategy, risk tolerance, and budget. By carefully evaluating your options and using stock advisor websites as a complement to your own research, you can enhance your investing journey and work towards building a successful portfolio.
FAQ: Motley Fool Stock Advisor
Choosing the right stock advisor service can be a critical decision in your investing journey. To help you determine if Motley Fool Stock Advisor is the best fit for your needs, here are answers to some of the most commonly asked questions about the service:
What is the track record of Motley Fool Stock Advisor?
Stock Advisor has a proven history of delivering market-beating returns. Since its inception in 2002, the service’s recommendations have yielded an average return of , significantly outperforming the S&P 500’s return of over the same period. That means Stock Advisor has beaten the market by times, demonstrating the effectiveness of its investment philosophy and methodology.
How many stock picks does Stock Advisor provide?
Each month, Stock Advisor delivers two new stock recommendations, complete with in-depth research reports and clear investment rationales. Additionally, the service maintains a list of 10 Foundational Stocks, representing core holdings with strong long-term growth potential. This combination of monthly picks and foundational stocks provides a steady stream of high-quality investment ideas.
What is the investment philosophy behind Stock Advisor’s picks?
Stock Advisor follows a long-term, buy-and-hold investment philosophy. The service focuses on identifying high-quality companies with strong competitive advantages, excellent management, and consistent growth prospects. By holding these stocks for the long term, investors can benefit from compounding returns and weather short-term market fluctuations.
How does Stock Advisor help me build a diversified portfolio?
Diversification is a core tenet of Stock Advisor’s approach. The service recommends stocks across various sectors and market capitalizations, helping you build a well-rounded portfolio that can mitigate risk. Additionally, Stock Advisor provides ongoing guidance for managing and rebalancing your portfolio to ensure it stays aligned with your goals and risk tolerance.
What resources does Stock Advisor offer beyond stock picks?
Stock Advisor offers a wealth of educational resources and tools to support your investing journey. These include in-depth articles, videos, and live Q&A sessions with the service’s expert analysts. The Stock Advisor platform also features a stock screener, performance tracking, and a vibrant member community where you can learn from and share ideas with fellow investors.
Can Stock Advisor adapt to my unique investing needs and goals?
Absolutely. Stock Advisor recognizes that every investor’s situation is unique. The service offers a diverse range of investment ideas and strategies, from Starter Stocks for beginners to aggressive growth picks for those with higher risk tolerances. With its ongoing guidance and personalized support, Stock Advisor can help you tailor your portfolio to your individual needs and goals.
Ultimately, Motley Fool Stock Advisor’s combination of a proven track record, long-term investment philosophy, and comprehensive support makes it a compelling choice for investors seeking to grow their wealth in the stock market. If you’re ready to take control of your financial future, we encourage you to try Stock Advisor today and start building a portfolio of high-quality, market-beating stocks.
Related Motley Fool Resources:
- •Explore our choices for the Best Investment Subscriptions.
- •Read our detailed Motley Fool review.
- •Secure the best Motley Fool discounts and promotions.
- •Check out the latest Motley Fool stock picks.
🧠 Thinking Deeper
- ☑️ Prepare yourself for the inevitability of economic cycles. They create both challenges and opportunities.
- ☑️ Don't diversify just for the sake of it. Concentrate on your highest conviction ideas.
- ☑️ Don't diversify mindlessly. It's okay to concentrate on your best ideas if you've done your homework.
- ☑️ Don't let fear of volatility keep you on the sidelines. Long-term growth requires riding out short-term fluctuations.
📚 Wealthy Wisdom
- ✨ The individual investor should act consistently as an investor and not as a speculator. - Benjamin Graham
- ✔️ It's not whether you're right or wrong that's important, but how much money you make when you're right and how much you lose when you're wrong. - George Soros
- 🌟 The stock market is a no-called-strike game. You don't have to swing at everything — you can wait for your pitch. - Warren Buffett
- 🚀 In investing, what is comfortable is rarely profitable. - Robert Arnott
📘 Table of Contents
- • Motley Fool Stock Advisor
- • Alpha Picks by Seeking Alpha
- • Methodology and Approach
- • Key Features and Benefits
- • Performance in 2025
- • Tools and Resources
- • The Team Behind Alpha Picks
- • Why Alpha Picks in 2025?
- • Best Stock Advisor Services for 2025 – Top Picks to Grow Your Wealth with Confidence
- • Morningstar Investor
- • Zacks Premium
- • Seeking Alpha Premium
- • Trade Ideas
- • TipRanks Premium
- • What is a Stock Advisor Website?
- • What is the Best Stock Advisor?
- • How We Evaluated the Best Stock Advisor Websites?
- • Benefits of Using a Stock Advisor Website
- • Conclusion
- • FAQ: Motley Fool Stock Advisor
- • What is the track record of Motley Fool Stock Advisor?
- • How many stock picks does Stock Advisor provide?
- • What is the investment philosophy behind Stock Advisor’s picks?
- • How does Stock Advisor help me build a diversified portfolio?
- • What resources does Stock Advisor offer beyond stock picks?
- • Can Stock Advisor adapt to my unique investing needs and goals?