Advertiser DisclosureWe strive for editorial integrity. We receive compensation from some of the links, products, and or services mentioned in this post. Click to read more
Best Stock Picking Services
Here are the best stock advisor websites and stock picking services we've reviewed in 2024.
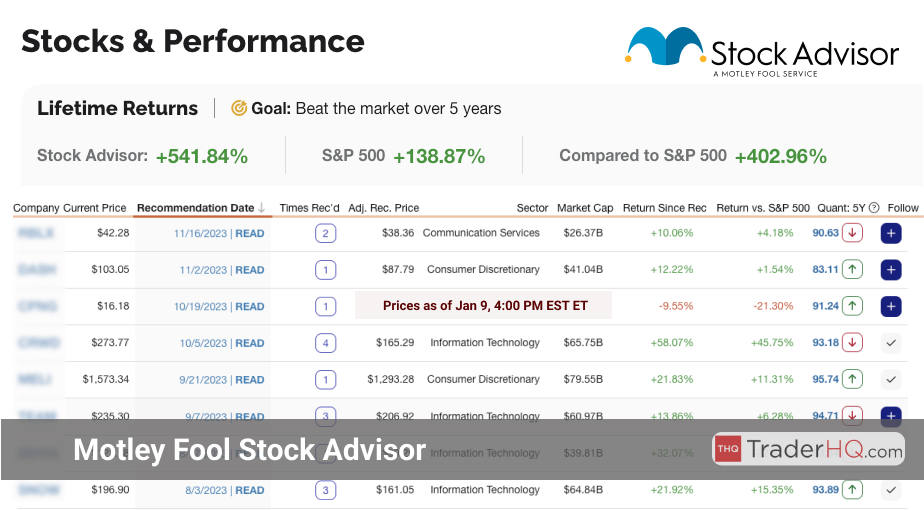
Motley Fool Stock Advisor is a premier investment advisory service. It offers expert stock picks with a proven track record. The service is designed for long-term investors seeking market-beating returns.
Each month, you'll receive two new stock recommendations carefully selected for their growth potential. With a focus on quality businesses, Stock Advisor aims to help you build wealth over time.
Whether you're a beginner or an experienced investor, Stock Advisor provides valuable insights. Let's dive deeper into what makes this service stand out.
Stock Advisor Performance
The Motley Fool's Stock Advisor service has a history of delivering market-beating returns. By focusing on companies with strong growth potential, the service aims to help subscribers build wealth over the long term.
Let's take a closer look at the performance of some of Stock Advisor's top picks:
Best Stock Advisor Picks (2002 to 2024)
Return*
Annualized Return
Computer Graphics Company
46,588%
60%
Streaming Company
29,833%
37%
Online Retail Company
22,713%
53%
Travel Company
14,339%
28%
Electric Car Company
6,828%
46%
These Stock Advisor stock picks have produced an average return of 24,060% or 45% annualized.. (As of Apr 19, 2024)
While these are the best performers the average Stock Advisor pick has returned 605.87% compared to 144.40% for the S&P 500.
Stock Advisor's ability to identify winning stocks spans across various time frames. The service's recommendations have not only outperformed over the long term but have also delivered impressive returns in more recent years.
Best Stock Picks (2017 to 2024)
Return
Annualized Return
Advertising Tech Company
1,115%
47%
Cybersecurity Company
702%
169%
Freight Forwarding Company
659%
34%
Credit scoring Company
579%
36%
Fast Casual Company
492%
29%
Q4-2019 Stock Advisor Stock Picks
The Q4-2019 Stock Advisor picks have produced an average return of 158%. (As of Apr 19, 2024)
Stock Picks from Q4-2019
Return
Annualized Return
Cloud Software Company
311%
38%
Advertising Tech Company
301%
37%
Streaming Company
78%
14%
Consulting Firm Company
62%
12%
Biotech Company
36%
7%
This closer look at the individual year of 2019 demonstrates that even within a shorter to medium-term timeframe, selected stocks can yield impressive results..
Rigorous stock selection process focusing on companies with strong fundamentals and growth prospects
Impressive track record of outperforming the S&P 500 over the long term
In-depth analysis and research supporting each stock recommendation
Educational resources to help investors make informed decisions and understand key concepts
Active community of like-minded investors for sharing insights and strategies
Best Suited for:
Investors seeking high-quality stock picks with the potential to beat the market
Those looking to build a diversified portfolio of individual stocks for the long haul
Beginners who want guidance and education to navigate the stock market with confidence
Experienced investors aiming to enhance their portfolio with well-researched growth stocks
Individuals committed to a buy-and-hold strategy rather than short-term trading
What You Get:
Two Monthly Stock Picks: Carefully selected stocks with high growth potential and strong fundamentals.
Best Buys Now: A curated list of timely investment opportunities to consider adding to your portfolio.
Starter Stocks: Foundational stock recommendations for those just beginning to build their portfolio.
Community Access: Join a vibrant community of investors to share insights, discuss strategies, and learn together.
Educational Resources: Gain access to a wealth of materials to expand your investing knowledge and skills.
Performance Tracking: Monitor the performance of recommended stocks against benchmark indices for transparency.
Satisfaction Guarantee: Experience the service risk-free with a 30-day membership fee back guarantee.
Best Uses:
Building a foundation of high-quality, growth-oriented stocks for your investment portfolio
Discovering hidden gems and innovative companies with disruptive potential before the broader market
Gaining insights and knowledge to make well-informed investment decisions with confidence
Engaging with a supportive community of investors to share ideas, challenges, and successes
Accessing a trusted resource for unbiased, well-researched stock recommendations and analysis
Bottom-line
Motley Fool Stock Advisor is a top-tier investment advisory service. It offers a compelling value proposition for growth-oriented investors.
With a focus on quality stocks and a long-term perspective, Stock Advisor can help you navigate the market with confidence. If you're ready to invest in your financial future, it's a service worth considering.
Insider Tip: Enhance your stock picking prowess by combining Motley Fool's recommendations with your own due diligence and portfolio management strategies.
Best for: Growth investors, risk-tolerant investors.
Cost: $99/year with our link (67% OFF $299/year).
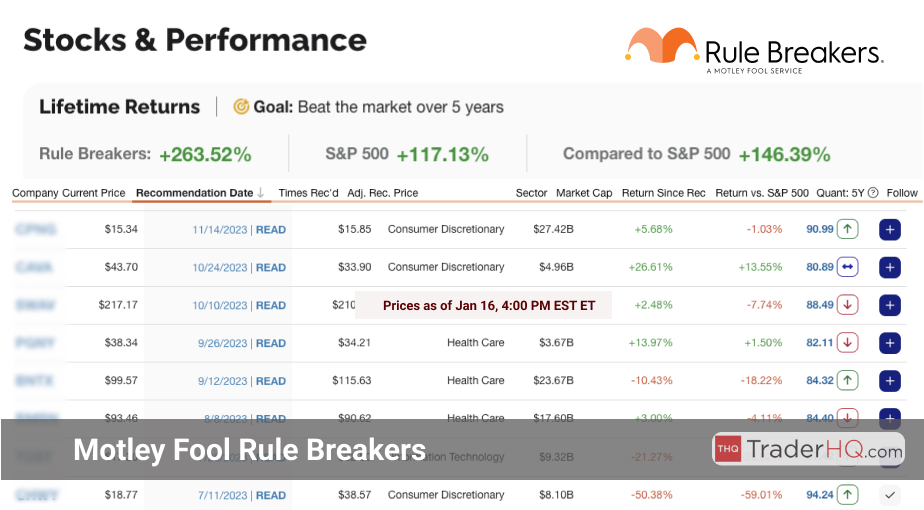
Motley Fool Rule Breakers is a high-growth stock picking service. It challenges conventional wisdom to identify disruptive companies poised for outsized returns. The service provides monthly stock picks, in-depth analysis, and a supportive investor community.
Rule Breakers is tailored for investors with a long-term horizon. It's designed for those willing to embrace volatility in pursuit of transformative gains. The service equips subscribers with the tools and insights to navigate growth investing.
By focusing on innovative businesses not yet recognized by the broader market, Rule Breakers offers a pathway to potentially significant returns. It's an invaluable resource for growth-oriented investors seeking to align their portfolios with future industry leaders.
Rule Breakers Performance
An effective investment strategy is supported by clear performance data, reflecting both past achievements and future potential.
Reviewing the Motley Fool Rule Breakers performance data, we highlight the service's track record for investors targeting long-term growth.
The performance figures of these selected stocks demonstrate the potential for significant returns.
Best Rule Breakers Picks (2012 to 2024)
Return*
Annualized Return
Electric Car Company
6,828%
46%
Gaming Company
5,927%
55%
Computer Graphics Company
2,873%
60%
E-commerce Company
2,056%
48%
Streaming Company
1,691%
31%
The average return of these stocks is 3,875%, with an annualized return of 48%. (As of Apr 19, 2024).
Average performance across all picks from Stock Advisor has resulted in 605.87%, outperforming 144.40% of the S&P 500.
The next Rule Breakers pick will be released on Apr 18, 2024.
Access upcoming picks and all historical selections with a 30-day money-back guarantee on membership.
Rule Breakers Release Schedule
Release Date
New Stock Pick
Apr 11, 2024
5 Best Buys Now
Apr 18, 2024
New Stock Pick
Apr 25, 2024
5 Best Buys Now
May 2, 2024
Rule Breakers recommendations are based on continuous investment research and identifying growth opportunities. This is essential for a portfolio growth.
Investors should not only consider past performance but also focus on new picks.
Data is significant, but practical experience and insight are also necessary for investing.
Rule Breakers provides detailed research aimed at uncovering future market leaders, supporting a proactive, growth-oriented investment strategy.
Focuses on identifying disruptive, innovative companies with high growth potential
Provides a clear, actionable framework for growth investing
Offers in-depth analysis and insights on recommended stocks
Fosters a supportive community of like-minded investors for learning and idea-sharing
Maintains a long-term perspective, aligning with the true trajectory of growth stocks
Best Suited for:
Investors with a high risk tolerance, comfortable with volatility in pursuit of significant returns
Those with a long-term investment horizon, understanding that growth stocks may take time to realize their full potential
Investors seeking exposure to innovative, disruptive companies across various sectors
Individuals looking to diversify their portfolios with a focused allocation to high-growth stocks
Those eager to learn and engage with growth investing strategies and a community of like-minded investors
What You Get:
Monthly Stock Picks: Two new high-growth stock recommendations each month, complete with detailed analysis.
Real-Time Alerts: Timely updates on recommended stocks, including any changes in opinion or analysis.
Best Buys Now: A regularly updated list of the top 10 timely stock picks for new money.
Starter Stocks: Foundational stock recommendations to build the core of a growth-oriented portfolio.
Community and Resources: Access to educational materials, discussion boards, and a community of growth investors for ongoing learning and engagement.
Best Uses:
Building a concentrated portfolio of high-conviction growth stocks
Identifying companies with disruptive potential before they become widely recognized
Complementing a diversified investment strategy with an allocation to high-growth opportunities
Staying attuned to emerging trends and industries poised for significant growth
Accessing a vetted source of growth stock ideas for further research and consideration
Bottom-line
Motley Fool Rule Breakers is a powerful resource for growth-oriented investors. It offers a principled approach to identifying and investing in high-potential, innovative companies.
While not suitable for every investor, those aligned with its philosophy and willing to embrace volatility may find significant value in its recommendations and educational resources.
Insider Tip: When utilizing a stock picking service like Rule Breakers, maintain a diversified portfolio to manage risk while still capturing growth potential.
Best for: Buy-and-hold investors, Data-driven investors.
Cost:$449/year with our link (10% OFF $499/year).
Alpha Picks by Seeking Alpha delivers high-probability investment recommendations for long-term capital appreciation. It employs a unique "quantamental" approach, blending quantitative analysis with fundamental investment principles. By leveraging proprietary data and sophisticated algorithms, Alpha Picks aims to simplify the investment process while outperforming market averages.
The service targets investors who believe in data-backed decision-making but may lack the resources or expertise to perform such analysis independently. It offers not just recommendations but education and transparency behind each pick, promoting an educated investor base poised for long-term growth through disciplined investment practices.
Whether you're looking to gradually integrate Alpha Picks into your existing portfolio or use it as an idea generation tool, the service provides direct stock picks every two weeks, along with detailed analysis for each recommendation.
What I like Most
Data-driven approach: Alpha Picks employs a rigorous, quantitative stock selection strategy, leveraging proprietary data and sophisticated algorithms to identify high-potential investments.
Quantamental methodology: By blending algorithmic precision with fundamental investing insights, Alpha Picks offers a unique and comprehensive approach to stock selection.
Transparency and education: Subscribers gain access to detailed analysis for each recommended stock, enhancing their financial literacy and understanding of investment decision-making.
Proven performance: Alpha Picks has demonstrated notable outperformance since inception, as evidenced by time-weighted returns calculated consistent with GIPS standards.
Risk management: The service actively manages risks by setting strict criteria for buy/sell decisions and diversifying across sectors to minimize concentration risk.
Best Suited for:
Long-term investors: Alpha Picks caters to individuals seeking capital appreciation over the long haul, emphasizing a buy-and-hold strategy over frequent trading.
Data-savvy investors: Those who appreciate a mix of data-driven analytics and fundamental investing principles will find Alpha Picks' quantamental approach appealing.
Hands-off investors: By providing direct stock picks and detailed analysis, Alpha Picks is well-suited for investors who prefer a more passive approach to portfolio management.
Investors seeking outperformance: With a track record of beating market benchmarks like the S&P 500, Alpha Picks is designed for investors aiming to outperform average returns.
What You Get:
Bi-weekly stock picks: Direct investment recommendations delivered every two weeks, ready for integration into your portfolio.
Detailed stock analysis: In-depth insights into each recommended stock, enhancing your understanding of the investment rationale.
Exclusive webinars: Access to webinars hosted by the quant team, providing deeper insights into their process and methodology.
Proven performance tracking: Transparent reporting of Alpha Picks' performance using time-weighted returns consistent with GIPS standards.
Quantamental approach: A unique blend of quantitative analysis and fundamental investing principles, aiming to optimize returns while managing risk.
Sector diversification: Active management of sector concentration risk through diversification and rotation based on valuation improvements.
Best Uses:
Building a long-term portfolio: Use Alpha Picks recommendations as the foundation for a buy-and-hold investment strategy aimed at long-term capital appreciation.
Enhancing existing portfolios: Gradually integrate Alpha Picks into your current portfolio to improve overall performance and diversification.
Generating investment ideas: Leverage the service's stock picks and analysis as a source of inspiration for further research and investment decision-making.
Developing investing knowledge: Learn from the detailed stock analysis and exclusive webinars to deepen your understanding of quantitative and fundamental investing principles.
Bottom-line
Alpha Picks by Seeking Alpha is a compelling choice for data-driven, long-term investors seeking to outperform the market. By combining quantitative analysis with fundamental investing insights, the service offers a unique and effective approach to stock selection.
While the subscription cost may be higher than some other services, Alpha Picks' proven performance, transparency, and educational resources make it a worthwhile investment for those serious about growing their wealth in the stock market.
Insider Tip:Utilize Alpha Picks' stock analysis to identify potential winners in your existing portfolio and optimize your holdings for better returns.
Best for: Individual investors, dividend investors, financial analysts.
Cost: $189/year with our link (21% OFF $239/year) + 7-day free trial.
Seeking Alpha Premium empowers investors to make well-informed decisions through comprehensive tools and insights. It caters to those seeking in-depth stock analysis and income-generating strategies.
With a focus on individual investors, dividend enthusiasts, and financial analysts, the service offers a wealth of resources to navigate the complex investment landscape.
From multi-faceted stock ratings to dividend insights, Seeking Alpha Premium provides the tools needed to refine your investment approach. Let's dive into the key features.
What I like Most
Triangulated analysis from Quant Ratings, SA Authors, and Wall Street provides a balanced perspective.
Dividend Grades enable income investors to identify reliable, growth-oriented dividend stocks.
Screening tools and comparative analysis features streamline the stock discovery and evaluation process.
Real-time alerts on rating changes and relevant news help users stay agile in the market.
Portfolio management tools, including grading and monitoring, support a data-driven approach to optimizing returns.
Best Suited for:
Individual investors seeking to enhance their stock analysis and selection process through quantitative insights.
Dividend investors prioritizing income generation and requiring tools to assess dividend safety and growth.
Financial analysts and portfolio managers looking for efficient research tools and a holistic view of investments.
Long-term investors who value historical data and trends for making informed decisions.
Investors who prefer to stay updated with real-time alerts and news tailored to their portfolio and interests.
What You Get:
Quant Ratings: Algorithmic stock evaluations based on statistical models for data-driven insights.
SA Author Ratings: Collective wisdom from Seeking Alpha's seasoned contributor community.
Wall Street Ratings: Professional analyst opinions from financial institutions for a broader perspective.
Dividend Grades: Assessment of dividend safety, growth, and consistency for income-focused strategies.
Screening Tools: Efficient stock discovery based on specific criteria to narrow down investment options.
Real-Time Alerts: Instant notifications on rating changes and news to enable timely decision-making.
Comprehensive Access: Unlimited access to articles, earnings calls, transcripts for in-depth research.
Comparative Analysis: Side-by-side stock comparisons for benchmarking and relative strength analysis.
Portfolio Monitoring: Tools to grade and assess portfolio health based on various factors.
Downloadable Financial Data: Access to 10+ years of financial statements for offline analysis.
Best Uses:
Constructing a diversified portfolio by leveraging multi-faceted stock ratings and analysis.
Identifying reliable, growth-oriented dividend stocks for a sustainable income investing strategy.
Conducting efficient stock screening and discovery based on specific criteria and investment goals.
Staying informed with real-time alerts on portfolio holdings and watchlist to enable timely actions.
Performing in-depth stock research using comprehensive data, news, and comparative analysis tools.
Monitoring and optimizing portfolio health using grading tools and factor-based assessments.
Bottom-line
Seeking Alpha Premium is a comprehensive toolkit for investors seeking to elevate their research and decision-making process. With a wealth of data, insights, and portfolio management tools, it caters to a wide range of investing styles and goals.
Whether you're focused on income generation, long-term growth, or tactical strategies, Seeking Alpha Premium provides the resources needed to navigate the market with confidence. Its user-friendly interface and real-time updates make it a valuable asset for both novice and experienced investors alike.
Insider Tip: Leverage Seeking Alpha Premium's stock analysis tools to identify high-quality companies with consistent revenue growth and strong market positions. These insights can help you build a resilient portfolio positioned for long-term success.
Best for: Long-term investors, Growth-oriented investors.
Cost:$200/year with our link (50% OFF $399/year).
7 Investing delivers a comprehensive subscription service tailored to empower long-term, growth-oriented investors.
Through in-depth analysis and educational resources, 7 Investing fosters confident, well-informed investment decisions.
Let's explore what makes 7 Investing a standout choice for savvy investors.
What I like Most
Offers seven thoroughly researched stock recommendations each month, providing a focused investment approach.
Comprehensive reports dive deep into each pick's investment thesis, giving subscribers a clear understanding of the rationale behind the recommendations.
Fosters a long-term investment mindset, encouraging patience and a focus on enduring value creation.
Cultivates an engaged community of investors through subscriber calls and forums, facilitating knowledge sharing and collective wisdom.
Transparent performance tracking via scorecards builds trust and allows subscribers to evaluate the service's effectiveness.
Best Suited for:
Investors seeking a concentrated portfolio of high-potential, long-term growth opportunities.
Those who value a deep understanding of the companies they invest in, appreciating the comprehensive analysis provided.
Individuals looking to enhance their investment knowledge and decision-making skills through educational resources and community engagement.
Investors who prefer a more focused, curated approach to stock picking rather than broad, generalized recommendations.
Those seeking to align their investments with enduring business models and strong growth prospects over speculative market trends.
What You Get:
Monthly Stock Picks: Gain access to seven thoroughly vetted stock recommendations each month.
In-Depth Research Reports: Receive comprehensive analysis for each pick, understanding the investment thesis inside out.
Educational Resources: Enhance your investing knowledge through reports, videos, and podcasts tailored to diverse learning preferences.
Community Engagement: Interact with fellow investors via subscriber calls and forums, learning from collective experiences.
Performance Tracking: Monitor recommendation performance transparently, evaluating service effectiveness.
Strategy Guidance: Glean insights into crafting robust investment strategies and diversifying risk from seasoned experts.
Timely Updates: Stay informed about significant company or market events that could influence your investments.
Best Uses:
Building a concentrated, high-conviction portfolio aligned with your long-term investment goals.
Developing a deep, multifaceted understanding of the companies you choose to invest in.
Engaging with and learning from a vibrant community of like-minded investors.
Enhancing your overall investment acumen and strategic decision-making capabilities.
Gaining exposure to potentially transformative, market-leading companies poised for sustained growth.
Bottom-line
7 Investing offers a holistic approach to stock picking that extends beyond mere recommendations.
By fostering education, community engagement, and a long-term perspective, it empowers investors to navigate the market with confidence.
Insider Tip:Leverage 7 Investing's stock analysis to identify high-conviction, long-term holdings for your portfolio's core.
Best for: Data-driven investors, Financial advisors
Cost:$360/year with our link (50% OFF $720/year)
TipRanks Premium empowers investors with institutional-grade data and analytical tools. It transforms complex financial information into actionable insights, enabling informed decision-making. The service caters to diverse needs, from individual portfolios to professional advisory.
With a user-friendly interface and mobile accessibility, TipRanks Premium ensures seamless navigation and real-time updates. Its comprehensive toolkit includes advanced filters, risk assessments, and insider trading insights.
By aggregating expert opinions and incorporating risk analysis, the platform offers a multifaceted perspective on investments. TipRanks Premium is committed to data security and compliance, providing a reliable ecosystem for financial research.
What I like Most
Aggregates analyst ratings and price targets, offering a consensus view
Provides a wealth of data points and metrics for fundamental analysis
Offers unique insights like analyst track records and insider trading activity
Intuitive interface makes navigation and interpretation of data easy
Covers a wide range of stocks, including international markets
Best Suited for:
Investors who believe in a data-driven approach to stock selection
Those seeking to validate their investment theses with expert opinions
Individuals looking to track and evaluate analyst performance over time
Investors interested in monitoring insider sentiment and trading activity
Those who value a comprehensive, all-in-one platform for stock research
What You Get:
Stock Analysis: In-depth reports with key data points and visual analysis
Analyst Ratings: Consensus ratings and price targets from top analysts
Analyst Track Record: Evaluate analysts based on their historical accuracy
Insider Trading Data: Monitor insider transactions for potential signals
News Sentiment Analysis: Gauge media sentiment around stocks
Smart Portfolio Tools: Track and analyze your holdings' performance
Watchlist Synchronization: Sync your watchlists across devices
Stock Screener: Filter stocks based on multiple fundamental criteria
Best Uses:
Conducting comprehensive fundamental analysis on individual stocks
Validating investment ideas with consensus analyst opinions
Identifying stocks with positive insider sentiment or trading activity
Tracking the performance and accuracy of individual analysts over time
Monitoring news sentiment to gauge market perception of a stock
Managing and analyzing personal portfolio holdings
Bottom-line
TipRanks Premium is a powerful ally for data-driven investors. It aggregates expert opinions, insider activity, and fundamental data into an accessible format.
While not a stock-picking service per se, it provides the tools and insights to make informed investment decisions. For those willing to conduct their own analysis, TipRanks Premium is a valuable resource.
Insider Tip:Use TipRanks' stock analysis tools to validate your investment strategies and enhance your portfolio management skills.
Best for: Fundamental investors, Portfolio builders
Cost: $199/year with our link (20% OFF $249/year)
Morningstar Investor empowers you with trusted, independent research to make informed investment decisions. As an experienced investor, I appreciate how Morningstar Investor provides comprehensive tools and insights to navigate the market with confidence. Let's explore what makes this service stand out and how it can elevate your investment strategy.
With a team of over 150 specialized analysts, Morningstar Investor offers unbiased, in-depth analysis across various sectors. This expertise, combined with a commitment to subscriber interests, ensures you receive objective research to support your investment goals.
Whether you're seeking to build a diversified portfolio, manage risk, or discover new opportunities, Morningstar Investor has the features to help you succeed. In the following sections, we'll dive into the key aspects that make this service an invaluable resource for investors like you.
What I like Most
Comprehensive ratings system with transparent methodology and broad coverage, including ESG considerations
Investment screening tools that integrate data analytics with expert insights to effectively filter options
Portfolio X-Ray feature providing multi-dimensional analysis to identify concentrations, redundancies, and hidden risks
Fee evaluation to understand the impact of expenses on investment returns
Personalized insights and customization features to ensure relevant, actionable content
Best Suited for:
Self-directed investors who actively manage their own portfolios and seek detailed research
Those who value objective, unbiased analysis to inform their investment decisions
Investors looking to streamline portfolio monitoring and management across all holdings
Individuals aiming to enhance their financial literacy and understanding of investment strategies
Those seeking to align their investments with personal financial goals and risk tolerance
What You Get:
Comprehensive Ratings System: Understand the basis of investment evaluations and explore rated securities, fund managers, and ESG factors.
Investment Screening Tools: Utilize data-driven filters and curated lists to identify investments aligning with your strategy efficiently.
Portfolio X-Ray: Gain a granular view of your portfolio composition, uncovering concentrations, redundancies, and hidden risks.
Fee Evaluation: Assess the often-overlooked impact of expenses on your investment returns for better-informed decisions.
Account Aggregation: Consolidate and monitor all your investment holdings in real-time for cohesive strategy management.
Personalized Insights: Access tailored analysis focusing on your specific assets, enhancing relevance and actionability.
Watchlists and Customization: Keep pertinent information readily accessible, improving your user experience and decision process.
Best Uses:
Manage portfolio risk by understanding diversification levels and identifying potential concentrations
Track asset performance against benchmarks to ensure alignment with your investment objectives
Discover new investment opportunities through data-driven screening that aligns with your financial goals
Enhance your financial literacy by interacting with in-depth research material and expert insights
Streamline portfolio analysis, saving time and reducing the cognitive load of manual calculations and monitoring
Stay informed with updates and alerts that automate part of the investment monitoring process
Bottom-line
Morningstar Investor is a comprehensive tool for investors seeking to make informed, data-driven decisions. By providing unbiased research, personalized insights, and powerful portfolio management features, this service empowers you to take control of your investments with confidence.
Whether you're a seasoned investor or just starting to build your portfolio, Morningstar Investor offers the resources and expertise to help you navigate the market effectively. With its commitment to objective analysis and subscriber-centric approach, this service is a valuable asset for any investor's toolkit.
Insider Tip: Leverage Morningstar's stock analysis to identify companies with strong economic moats—a key indicator of sustainable competitive advantage and potential long-term value creation.
These top stock picking and stock advisor services offer a range of valuable features, from expert recommendations to comprehensive research and analysis tools, catering to both novice and experienced investors looking to enhance their investment strategies.
Motley Fool Stock Advisor: Offers monthly stock picks from experienced investors Tom and David Gardner, focusing on long-term growth potential.
Motley Fool Rule Breakers: Identifies high-growth stocks with disruptive innovation, suitable for investors with a higher risk tolerance. Consider the Motley Fool Epic Bundle to access both Stock Advisor and Rule Breakers at a discount.
Alpha Picks by Seeking Alpha: Provides thoroughly researched stock recommendations leveraging the collective wisdom of top-performing contributors.
Seeking Alpha Premium: Offers an extensive suite of tools, including Stock Quant Ratings and Dividend Grades, for investors relying on in-depth analysis.
7 Investing: Delivers seven monthly stock recommendations focused on long-term value creation, ideal for building a durable and diverse portfolio.
TipRanks Premium: Provides access to market data, analyst ratings, and price targets for data-driven investment decisions.
What is a Stock Picking and Stock Advisor Service?
A stock picking and stock advisor service is a platform that provides expert recommendations and analysis to help investors make informed decisions about which stocks to buy, sell, or hold. These services are designed to save time and effort for investors who may not have the expertise or resources to conduct in-depth research on their own.
Typically, these services employ experienced analysts and investors who use various methods, such as fundamental analysis, technical analysis, and market trends, to identify stocks with the potential for growth or undervaluation. They then provide their subscribers with regular updates, reports, and recommendations based on their findings.
Stock picking and stock advisor services cater to a wide range of investors, from beginners to seasoned professionals. Some services focus on specific sectors or investment strategies, while others offer a more general approach. Many of these platforms also provide educational resources and tools to help investors improve their knowledge and skills.
Investing in the stock market always involves some level of risk, but stock picking and stock advisor services aim to minimize that risk by providing well-researched and data-driven recommendations. By leveraging the expertise of these services, investors can potentially enhance their portfolio performance and achieve their financial goals more effectively.
What is the Best Stock Picking and Stock Advisor Service?
While there are numerous stock picking and stock advisor services available, two of the most highly regarded and popular options are Motley Fool Stock Advisor and Motley Fool Rule Breakers. Both services are offered by The Motley Fool, a well-established and trusted name in the investment community.
Motley Fool Stock Advisor, led by co-founders Tom and David Gardner, focuses on identifying stocks with strong long-term growth potential. Each month, subscribers receive two new stock recommendations, along with in-depth analysis and ongoing updates. The service has a proven track record of outperforming the market, making it an excellent choice for investors seeking to build a solid, long-term portfolio.
On the other hand, Motley Fool Rule Breakers, also led by David Gardner, targets high-growth, innovative companies that are poised to disrupt their industries. This service is geared towards investors with a higher risk tolerance who are looking to invest in the "next big thing." Rule Breakers provides monthly stock picks, as well as a wealth of research and analysis to help subscribers make informed decisions.
For investors seeking the best value, the Motley Fool Epic Bundle combines both Stock Advisor and Rule Breakers at a discounted price. This bundle offers a diverse range of investment opportunities, catering to both conservative and growth-oriented investors. With a focus on long-term success and a commitment to transparency, the Motley Fool services are an excellent choice for those looking to elevate their investment game.
FAQ - The Motley Fool's Stock Advisor Service
What makes The Motley Fool's Stock Advisor service stand out among other advisory services?
The Motley Fool's Stock Advisor service distinguishes itself with a proven track record of providing high-quality stock picks that have historically outperformed the market. Its success is attributed to its consistent, long-term investment philosophy and the deep-dive research carried out by Motley Fool co-founders Tom and David Gardner. Stock Advisor simplifies complex investment decisions by delivering straightforward, actionable advice twice a month, making it particularly appealing to investors seeking clarity and ease of use.
How does Stock Advisor help individual investors?
Stock Advisor is built around the needs of individual investors, regardless of their experience level. By offering comprehensive stock analysis, educational content, and clear recommendations, the service aims to demystify the investing process. It empowers subscribers to build diversified portfolios poised for long-term growth, fostering an investment approach that leverages patience and market resilience.
Can beginners benefit from the Motley Fool's Stock Advisor?
Absolutely. Beginners can greatly benefit from the Stock Advisor service because it provides them with expertly chosen stock picks along with explanations of the reasoning behind each selection. This knowledge sharing not only aids in making informed investment choices but also serves as a practical financial education that enriches a beginner's understanding of stock market dynamics.
What kind of support and resources does Stock Advisor offer?
Subscribers to Stock Advisor gain access to a wealth of resources, including in-depth research reports, stock recommendations, portfolio management tools, and a supportive community forum. The service also comes with access to Motley Fool's wealth of published articles on investment strategies, market news, and financial discipline, facilitating ongoing education and support.
Is there flexibility in how I can use Stock Advisor recommendations?
Yes, while Stock Advisor provides specific stock picks, as an investor, you have complete autonomy over how you use these recommendations. You can choose to follow them closely or use them as starting points for your own research and analysis. This flexibility ensures that you can adapt the advice given to suit your unique investment style and risk tolerance.
Remember, while The Motley Fool's Stock Advisor service can be a powerful asset in reaching your financial goals, it's important for you to remain engaged with your investments and make decisions that align with your individual objectives and circumstances.
*Disclaimer: Unless noted otherwise all returns are as of Apr 19, 2024. Past performance is no guarantee of future results. Individual investment results may vary. All investing involves risk of loss.
We provide general information, not investment advice. Some of the links on this page are affiliate links in which we receive a commission when a purchase is made.
$89 promotional price for new members only. $110 discount based on current list price of Stock Advisor of $199/year. Membership will renew annually at the then current list price.
$99 promotional price for new Rule Breakers members. $200 discount based on current list price for Rule Breakers of $299. Membership will renew annually at the then current list price.